Evaluating Participation in the 1991 Government Farm Program
March 16, 1991
PAER-1991-1
Authors: Purdue Farm Management Staff – Chris Hurt, Don Pershing, Lee Schrader, Bob Jones, Craig Dobbins, Bill Uhrig, Howard Doster, Marshall Martin, and Wally Tyner
![]()
![]()
![]()
![]()
![]()
The 1991 farm program is the first year under the new Agriculture Act. New alternatives are provided for farmers which include planting flexibility and opportunities to plant minor oilseeds under the 0-92 program. This article provides a brief overview of the program, suggests a step-by-step approach for farmers to evaluate the economics of their alternatives, and provides our own economic analysis using Purdue budgets.
Farmers are given flexibility to plant alternative crops on portions of their crop bases this year. Both com and wheat farmers have 25 percent of their bases which are flexible to be planted to alternative crops. This 25 percent is composed of 15 percent of the base which is called the Normal Flex Acres (NFA), and 10 percent called Optional Flex Acres (OFA). The NFA acres are not eligible for deficiency payments, while the OFA acres are eligible for deficiency payments, but only if they are planted to the program crop.
Steps For Farmer Evaluation
The following steps are suggested for farmers to evaluate their economic alternatives:
- Decide whether to participate or stay out this year.
- If you participate, what is the highest return crop on NFA?
- What is the best return crop on OFA?
- Consider returns in 0-92.
- Consider returns for Pay-92.
- Select the highest return set of crops.
- How sensitive are returns on these “best crops” to: Price change, yield change, rotations, planting dates, ASCS yield base, and other factors?
Corn Program
The following economic evaluations are based upon Purdue budgets for various classes of land. The low-quality land has yields for com at 93 bushels per acre, beans at 30 bushels, and wheat at 51 bushels. These same yields for the average-quality land are: 119, 38, and 60. For the high-quality land, yields are: 150, 48, and 68 bushels per acre. Prices per bushel used in these examples were: com $2.30; soybeans $5.80; and wheat $2.50. Numbers shown in the tables are the returns per base acre above the direct costs of production.
The first items most farmers will want to evaluate are the returns for participation versus staying out of the program. Returns are about $20 to $30 per acre higher to participate in the basic com program, which allows farmers to plant 92.5 percent of their corn base to com. Since participation generally looks favorable, the next evaluation is to examine the highest return crop on the NF A acres. Most will want to consider soybeans on com NFA. You can see in the table that returns go down modestly in our base case when beans are planted on NFA.
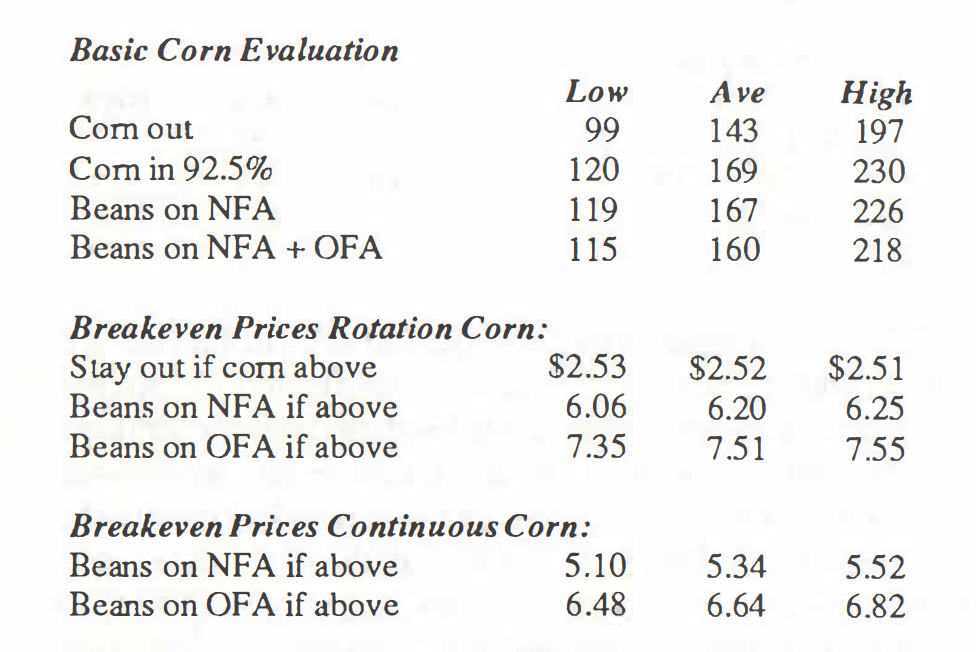
Table 1.1 Basic Corn Evaluation
Planting beans on OFA, however, sharply reduces returns. This is because the OFA acres are eligible for com deficiency payments, thus, if beans are planted on com OFA, a sharp reduction in government payments occurs. This, of course, is not the case on NFA acres since they are not eligible for com deficiency payments.
Breakeven prices are also shown in the table. The com breakeven shows the com price per bushel needed to stay out of the program and receive as high a return as program participation (given assumptions in the base case). These levels are generally in the low $2.50 range. Soybean breakevens show that $6.06 to $6.25 beans are needed on rotation corn to break even with $2.30 corn on the corn NF A. Prices well over $7 are needed to break even with corn on OFA.
The economics of flexing beans on corn base may be somewhat different if a farm has had continuous corn. Research by Purdue agronomists shows a seven percent lower corn yield for continuous versus rotation corn. In addition, production costs on continuous corn are higher, especially for added pesticide costs. We have assumed a seven percent lower corn yield and $10 to $12 an acre higher production costs. Breakeven prices to flex soybeans on corn NF A are lowered to $5.10 to $5.52 per bushel. Flexing onto corn OFA would require soybean prices of $6.48 to $6.82. Thus, it appears that most producers who have a portion of their corn base in continuous corn will want to strongly consider flexing this to soybeans, at least on the OFA acres.
Most farmers will want to examine the potential returns from 0-92 and Pay-92 alternatives for their corn base. The 0-92 provisions are similar to last year in that the corn base (or a portion of it) could be diverted to conservation use, and still receive 92 percent of the deficiency payments. With the $15 per acre set-aside cost used in the base budgets, returns above direct costs per acre would be only $21 to $42 per acre depending on land quality (CU 100% line) (CU stands for conservation use acres). However, since the 15 percent NFA acres do not receive any deficiency payment, one could elect 0-92, plant 15 percent to soybeans, and still receive the full deficiency payment. This would increase returns to $36 to$71 per corn base acre. New provisions called Pay-92 allow farmers to plant a minor oilseed crop on 92.5 percent of the corn base, harvest all of the crop, and still receive the 0-92 deficiency payment.
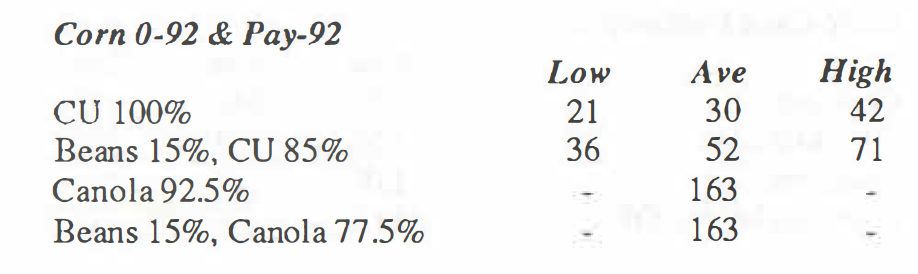
Table 1.2 Corn 0-92 & Pay-92
The two oilseeds which are possibilities in Indiana are canola and sunflowers. Budgets for sunflowers do not appear financially attractive, so we have used canola for these illustrations. As shown in the table, returns for Pay-92 with canola appear to be only about $6 per acre below corn in the basic program. Thus, Pay-92 with canola on corn base may be a consideration for coming years, but we will all have to learn more about the crop and watch prices. The following are general conclusions about the corn program:
- Returns are $20 to $30 per acre higher to participate.
- Most participants should consider:
- Flexing beans on corn NFA, especially for average to low quality land.
- Breakevens are slightly over $6 per bushel on rotation corn.
- Breakevens are $5 to $5.50 per bushel on continuous corn land.
- Few will flex beans on corn OFA because breakevens are over $7.
- Few will elect 0-92: only special situations.
- Pay-92 with canola is worth watching:
- Learn more about production.
- Watch prices.
- Consider for 1992 crop.
- Be cautious.
- Pay-92 with sunflowers generally is not competitive.
Wheat Evaluation
The wheat program can be evaluated in a similar manner as corn. In evaluating the participation question, it is clear that incentives to participate are very high. This, of course, is because the target of $4 per bushel is sharply higher than the roughly $2.50 new crop wheat price.
Wheat farmers, who planted wheat last fall, can choose two ways of calculating deficiency payments. They can elect to be paid on 70 percent of their base, with the calculation based upon the market price in the first five months of the year. Alternatively, they can be paid on 85 percent of their base, but with the market price based upon all 12 months of the marketing year. The 12-month payment base is limited by law to be no more than 10 cents below the five-month base. Returns in the table for the 85 percent program arc based upon the 85 percent deficiency payment base, which generally will provide higher returns. However, if farmers elect the 85 percent deficiency payment base, they cannot flex their wheat NFA or OFA to other crops.
The following wheat evaluation is in two parts. The first assumes all costs of production are still to be incurred, as for the 1992 crop. However, for the already seeded 1991 crop, some of the production costs have already occurred. This analysis is covered in the latter part of this section.
First, we will evaluate returns without regard for any expense which is already sunk in a growing wheat crop. The data in the next table show that participation returns are sharply higher than staying out of the program. Those deciding to participate should consider beans on NFA. Returns are higher than the basic 85 percent wheat program (with the 85 percent deficiency payment base) only for high-quality land. Beans on wheat OFA provide lower returns yet, and would not generally be considered. However, corn on wheat NFA appears to provide competitive returns with the basic wheat program. Also note the returns to wheat and doublecrop beans, at $122 to $209 per acre, are higher than any other wheat program alternative.
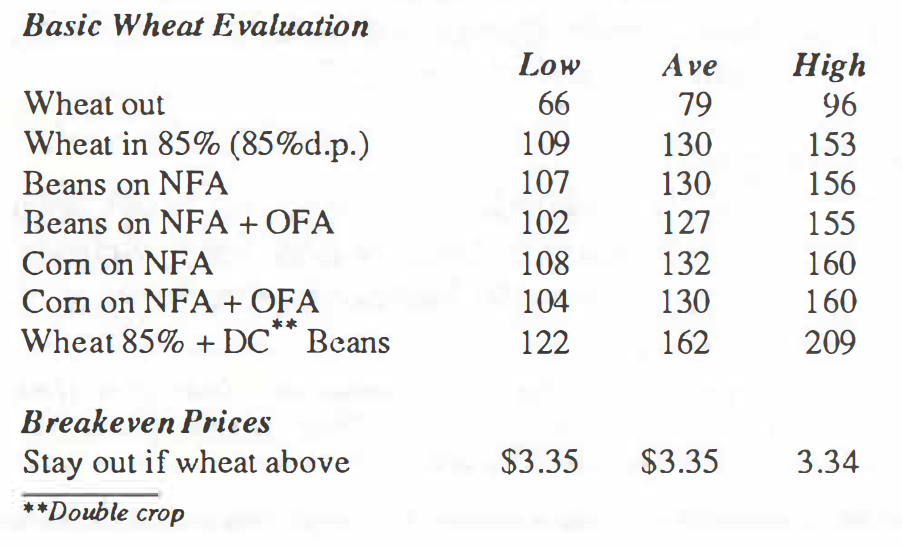
Table 1.3 Basic Wheat Evaluation
Breakeven levels are shown in the lower portion of the table. Wheat prices of about $3.35 per bushel would be needed to break even outside the program. This means that market prices need to be at or above these levels to have the same or higher returns out of the program compared with program participation, using the 85 percent deficiency payment base.
Those who have already planted wheat on 85 percent of their wheat base have a portion of the direct costs invested in the growing crop. For these individuals, the appropriate direct costs are only those which are still to be incurred. Thus, we have adjusted our budgets to reflect this. The basic question is, should the wheat NFA acres be planted to com or soybeans. This would likely involve no-tilling the com or beans into the “burned-back” wheat. The following table shows the prices at which corn or beans would break even with leaving the wheat in place and harvesting.
Breakeven prices are shown for both the 70 percent deficiency payment rate and the 85 percent deficiency payment rate. Since most people will elect the 85 percent deficiency payment, those are the relevant numbers to observe. Breakevens show that single crop wheat base flexed to beans on high-quality land would require bean prices of $5.78, and corn prices of $2.15 to give the same returns as the wheat program. Thus, on some above-average-quality land, producers may want to plant corn or beans on wheat NFA even though it was already seeded to wheat. Most of the average or lower-quality land that is seeded already will likely stay planted to wheat.
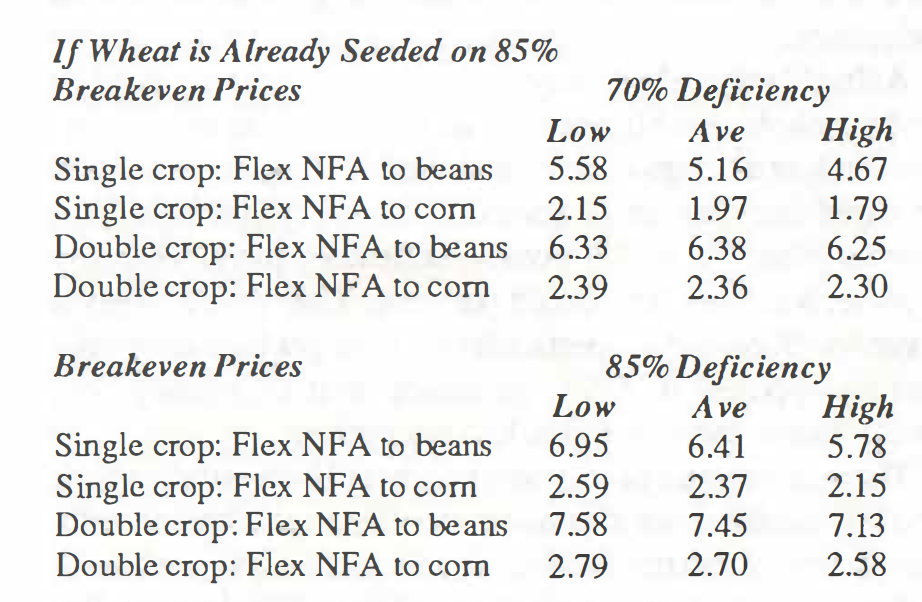
Table 1.4 Breakeven Prices if Wheat is already seeded on 85%
Returns for wheat 0-92 and Pay-92 are shown in the next table. Returns are lower than cash rent for the 0-92 alternatives. However, canola returns on Pay-92 appear to exceed returns for any other alternative in the wheat program except wheat plus double crop beans. This is because our canola returns are close to the same returns as soybeans, but in Pay-92, you also receive about $40 per base acre in deficiency payments.
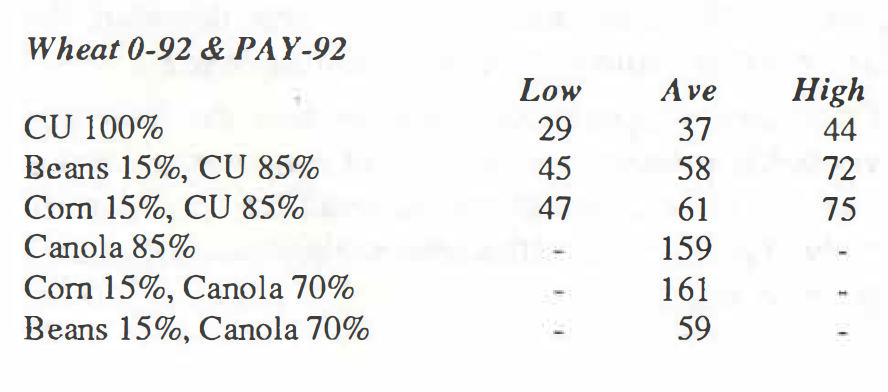
Table 1.5 Wheat 0-92 & Pay-92
Canola, of course, is a late summer-seeded crop, so the Pay-92 alternative will not be a possibility for most farmers until the 1992 crop program. Canola is a new crop, so be cautious until you can learn the necessary production practices. Watch markets closely.
Our budgets indicate that Pay-92 canola has returns somewhat under returns for wheat plus double-crop beans. This means that those with wheat and double-crop beans will have little incentive to shift to Pay-92 canola. However, the incentive for those with single-crop wheat to consider Pay-92 with canola is fairly strong.
The following are general conclusions for the wheat program:
- Returns are $43 to $57 per acre higher to participate.
- If wheat base was not planted last fall:
- Most will plant beans on base, but you could participate in the wheat program, but need 15% set-aside, and thus returns are low.
- Could elect 0-92.
- Could electPay-92, but not until 1992 to plant canola.
- Could elect Pay-92 with spring-seeded sunflowers, but these returns do not look competitive.
- If 85 percent of the base was seeded already, most will elect the 85 percent deficiency payment method, and not flex to another crop. However, those with high-quality land may elect the 70 percent deficiency payment method and flex wheat NF A to corn or beans.
- If you have seeded more than 85 percent of the wheat base, you:
- Could flex extra to corn NFA, but returns are low.
- Could consider extra as set-aside.
- Could tear-up extra acres and plant to beans.
- Those who have wheat plus double-crop beans generally won’t flex wheat NFA or OFA to an alternative crop.
- Pay-92 canola should be watched, as it has possibilities on single crop wheat base.
- Late next summer, evaluate your fall 1991 wheat planting. Indiana farmers are not likely to seed wheat NFA to wheat.
What Next
After selecting your best crop mix, you will want to evaluate how sensitive these crops are to changing prices, changing yields, and other factors. The Cooperative Extension Service office in your county has worksheets to help you budget many of these alternatives using your own farm numbers. In addition, most of the county offices will be able to provide you with computer evaluations which will help evaluate all of the program alternatives shown here, as well as evaluate any crop you want to consider in your flex decisions. As always, these Purdue budgets provide general guidelines, but using your own budgets will allow you to make the best program decisions.
![]()
![]()
![]()
![]()
![]()
