Farm Managers and Rural Appraisers’ Assessment of Indiana’s Farmland Market
May 24, 2013
PAER-2013-01
Craig Dobbins, Professor


Even with a severe drought last year, the Midwest land market continues to move higher. The May 2013 issue of the AgLetter, a Federal Reserve Bank of Chicago newsletter, indicated that farmland values in the Seventh District (Iowa, and parts of Illinois, Indiana, Michigan, and Wisconsin) had increased by 4% during the first quarter of 2013 and had risen by 15% over the last year from April 1, 2012 to April 1, 2013. The newsletter reported changes for Indiana were the same as the Chicago FED district as a whole.
To obtain greater perspectives about changes in Indiana’s farmland market, members of the Indiana Chapter of Farm Managers and Rural Appraisers were surveyed during their winter meeting in February 2013. To obtain information about Indiana’s farmland market, members were asked to estimate current farmland values in the context of the following situation:
80 acres or more, all tillable, no buildings, capable of averaging 165 bushels of corn per acre and 50 bushels of soybeans in a corn/bean rotation under typical management and not having special non-farm uses.
Thirty responses were received from professionals in 22 different Indiana counties. The average estimated price of this farmland parcel was $8,510 per acre. All of the respondents indicated their estimated price was higher than the value a year earlier. The average percentage increase from February 2012 to February 2013 was 13%, modestly less than the Chicago FED report. The range in estimated increase provided by the farm managers and rural appraisers was 5% to 25%.
Attendees estimated the cash rent for 2013 would be $278 per acre. Twenty-three of the respondents indicated that cash rent was higher than in 2012 and six respondents indicated it was the same. No one indicated a decline in cash rent. On average, the cash rent increased $29 per acre, or 12% from the previous year. There was a wide range in the estimated cash rent and cash rent change. The estimated cash rent varied from $200 to $400 per acre and the change in cash rent varied from +$10 to +$100 per acre.
The increased variability of net returns associated with leasing farmland has prompted tenants and landlords to experiment with various types of adjustable leases. To obtain a sense of the type of leases used, attendees were asked to report the percentage of their cropland leases that were crop-share, fixed cash, variable cash, and other. The percentage of respondents using each type of lease and the percentage of their leases by type is presented in Table 1.
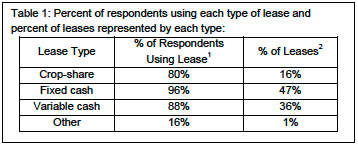
Table 1: Percent of respondents using each type of lease and percent of leases represented by each type:
Crop-share, fixed cash, and variable cash leases all had a high rate of usage among the respondents. Many of the respondents were using all three types of lease. The most commonly used lease was the fixed cash lease, averaging 47% of the leases. This was followed by the variable cash lease at 36%. Crop-share leases were 16% of the leases.
What About Future Values?
Will farmland values continue to increase? The farm managers and rural appraisers were asked to provide two forecasts of future farmland values: in one year and in five years. For the next year, 60% of the respondents felt values would be higher. The other 40% said there would be no change. The expected increase averaged 9% with a range of 5% to 20%.
There was less agreement about the change in farmland values over the next five year. Higher values were favored by 53%, but 27% indicated there would be no change, and 20% believed farmland values would be lower. For those respondents indicating that farmland values would be higher, the expected increase averaged 21% with a range from 6% to 40%. For those respondents expecting a decrease in farmland values, the decrease averaged 17% with a range from 10% to 25%.
These results indicate that in the short run Indiana’s farmland market is expected to remain strong. No one in this survey expected farmland values to decline in the coming year. But they did expect the rate of increase to slow compared to the past few years. Longer term there is less certainty in how farmland values will change. More respondents expect farmland values to be steady or higher, but some do expect a decline in five years. With these more negative opinions in mind, land owners should at least explore what management strategies they might implement if a 10% to 25% decline in farmland values was to occur.
_____________
1 These do not total 100% because a respondent often uses more than one type of lease.
2 Across the different types of leases the total will be 100%.
A special thanks is expressed to the Indiana Chapter of Farm Managers and Rural Appraisers that participated in the survey. Without their assistance it would not have been possible to take the pulse of Indiana’s farmland.