Farm Mangers and Rural Appraisers Assessment of Indiana’s Land Market
April 23, 2011
PAER-2011-03
Craig Dobbins, Professor


In recent months, the press and coffee shops have been filled with discussions about the strong upward movement in farmland values. A recent Iowa survey found a 15.9% increase from 2009 to 2010. A 2010 fourth quarter Federal Reserve Bank of Kansas City survey found an annual increase of 17.6% and 17.5% for irrigated and non-irrigated farmland in Nebraska. The annual increase of non-irrigated farmland in Kansas was even stronger at 19.5%5. The 2010 fourth quarter Chicago Federal Reserve Bank survey reported annual increases of 18%, 12% and 11% for Iowa, Indiana, and Illinois, respectively.6 To obtain a perspective of what was happening in Indiana, members of the Indiana Society of Farm Managers and Rural Appraisers were surveyed during their winter meeting on March 9, 2011.
While the number of responses was small, these individuals have a unique perspective of Indiana’s farmland market because they are involved in this market on a daily basis, managing farmland for owners, providing appraisals of farmland, or both. To obtain their perspective, members were presented with the following situation:
80 acres or more, all tillable, no buildings, capable of averaging 165 bushels of corn per year and
50 bushels of beans in a corn/bean rotation under typical management and not having special non-farm uses.
Responses were received from people in 22 different counties across the northern two-thirds of the state. The average of the responses received indicated an average farmland value of $6,028 per acre. All but one response indicated that this value was up from the value a year earlier. The average increase for the year was 13.8%. This makes the annual percentage increase a little stronger than the increase found in the fourth quarter of 2010 by the Chicago Federal Reserve Bank survey.
Attendees were also asked to specify the cash rent for 2011. The average cash rent was $208 per acre. All but one person indicated that rent in 2011 was higher than in 2010. The average amount of increase was $28 per acre, making this approximately a 15.6% increase.
The variability in grain prices has made setting a cash rent more difficult. As a result, tenants and landowners have tried various methods for creating a flexible cash lease. Others have shifted from a cash lease to a crop-share lease. To get a sense of the types of leases used, attendees were asked to specify the percent of their cropland leases that were crop-share, fixed cash, variable cash, and other. The percentage of the respondents that reported using each type of lease and the percentage of their leases of each type is presented in Table 1.
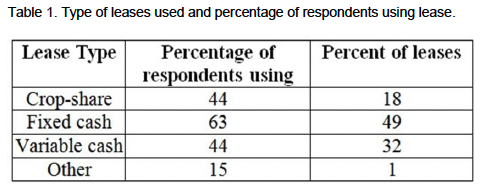
Table 1. Type of leases used and percentage of respondents using lease.
A crop-share lease was used by 44% of the respondents, but it was only a small percentage of their leases at 18%. Fixed cash leases were used by 63% of the respondents and on average 49% of their leases were of this type. The use of variable cash leases was reported by 44% of the respondents and on average 32% of their leases were this type. One percent of the leases were some other type of lease.
When asked about future farmland prices, 89% of the respondents indicated they expected farmland prices to continue upward movement. On average, respondents expected farmland values to be 8% higher in a year. Only 11% of the respondents expect no change in farmland prices. No one expected farmland prices to be less in a year.
These results indicate continued strength in Indiana’s farmland market. They also indicate that this group of individuals expect this strength to continue.