Farmland Assessment for Property Taxes in the Coming Decade
August 1, 2018
PAER-2018-12
Authors: Tamara Ogle, Extension Community Development Regional Educator and Larry DeBoer, Professor of Agricultural Economics
![]()
![]()
![]()
![]()
![]()
It’s been three years since the Indiana General Assembly passed and the Governor signed Public Law 249, changing the method used to calculate the base rate of farmland for property tax assessment. Since then the farmland base rate has fallen from $2,050 per acre for taxes in 2016 to $1,850 per acre for taxes this year. The Department of Local Government Finance (DLGF) has set the base rate for taxes in 2019 at $1,610 per acre. The base rate has dropped 21% in three years.
The base rate is a dollar value per acre calculated by the DLGF each year. It is the starting point for the assessment of farmland for property taxes. The base rate is calculated using a capitalization formula which divides the net income from an average acre of farm- land by a rate of return. This capitalized value is then averaged over 6 years with the highest value dropped.
Public Law 249 made two major changes to the base rate formula. The first required use of more recent data. Now, the base rate for 2018 taxes will use data from 2010 to 2016, instead of 2008 to 2014. A four-year da- ta lag was reduced to two years. Reducing the data lag means that the base rate will follow changes in farm prices and yields more closely, but it does make the base rate harder to predict in advance.
The second change was the most significant and a little harder to explain. The change to the formula introduced a system for adjusting the rate of return, which is also called the capitalization rate. The preliminary capitalization rates are an average of farm loan inter- est rates for operating loans and real estate, reported by the Chicago Federal Reserve. DLGF uses the same capitalization formula as in the past to calculate a preliminary base rate.
The preliminary base rate is then compared to the existing base rate for the current tax year. If the preliminary base rate is within 10% of the existing base rate, then a capitalization rate of 7% would be used for all 6 years in the final calculation. If the preliminary base rate is more than 10% lower than the existing base rate then a capitalization rate of 6% would be used. And, if the preliminary base rate is more than 10% higher than the existing base rate, a capitalization rate of 8% would be used.
The idea behind the new calculation method is to stabilize the base rate. When the preliminary base rate falls significantly, a lower capitalization rate is used in the denominator of the calculation to lessen the de- crease. When the preliminary base rate increases significantly, a higher capitalization rate is used to lessen the increase. And when the preliminary base rate is close to the existing base rate a mid-range capitalization rate is used to keep it stable.
Calculating the Base Rate
Table 1 shows the DLGF’s calculation of the base rate for taxes in 2019. The first part of the table shows the preliminary base rate calculation. Cash rent net incomes per acre are calculated from the Agricultural Economics Department’s survey published annually in the August issue of the PAER. Property taxes are subtracted. Operating net incomes per acre are calculated from prices, yields and costs for corn and soybeans. Each net income measure is divided by the capitalization rate, to get two values per acre, called the market value in use. The calculations are done for the six years, 2012 through 2017. The highest value (from 2013) is dropped and the remaining five years are averaged, to get $2,640 per acre.
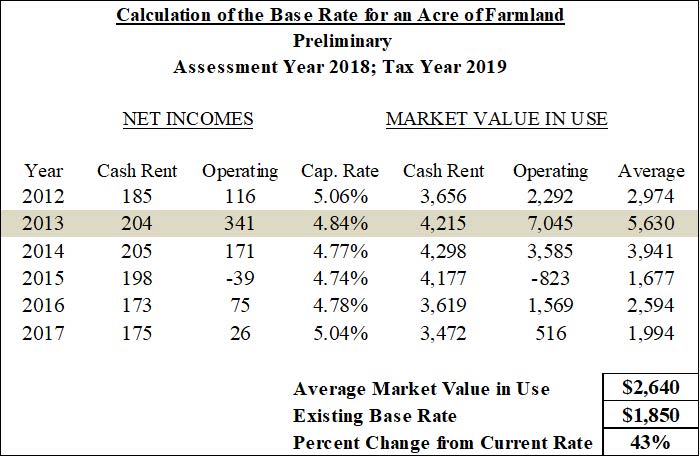
Table 1. Preliminary and Final Base Rate Calculation for Taxes in 2019.
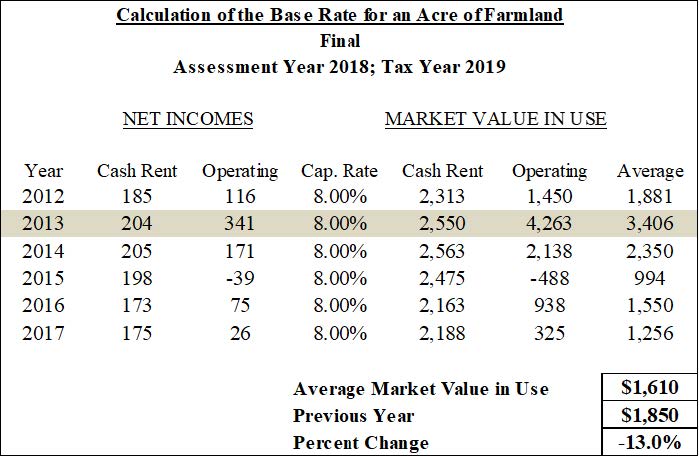
This is the 2019 preliminary base rate. It would be a 43% increase over the base rate for 2018, $1,850. Since this is more than 10%, a capitalization rate of 8% is used in the final base rate calculation, shown in the second half of Table 1. The final base rate for taxes in 2019 is $1,610 per acre, a 13% decrease from the 2018 base rate and a 39% decrease from the preliminary base rate calculation.
Base Rate Likely to Decline More
DLGF has set the base rate for 2019 property taxes at $1,610. But what about the coming decade? Where do farmland assessments go from here?
The answer is down even more, for at least another two years. Table 1 shows that the capitalized values for 2012, 2013 and 2014 are higher than those in more recent years. The base rate calculation for 2020 will drop the 2012 $1,881 value and add the value for 2018, which will surely be in the $1,000 to $1,500 range, like the values for 2015 to 2017. Replacing a bigger number with a smaller number in the average will reduce the base rate.
Then in 2021 the very high $3,406 value from 2013 will drop out of the average. This is the high value that is not counted in the calculation anyway. The new high value will be $2,350 from 2014, so it will also be eliminated from the average. The 2019 value will be included. We don’t know what that value will be, but without sharp increases in crop prices or cash rent it will be lower than $2,350. The base rate will fall again.
More precise forecasts of the base rate require forecasts of commodity prices, rents, yields, costs and interest rates. For taxes in 2020 the formula will use data from 2013 through 2018. Numbers through 2017 are known, and some of the 2018 data is already available so only part of the 2018 data need to be projected. For 2018, current corn bids and the futures were used to estimate commodity prices from June through December of 2018. DLGF will release the 2020 base rate at the end of December or in early 2019.
Plugging these estimates and the known data into the farmland base rate formula gives a preliminary 2020 value of $2,360 per acre, 47% above pay 2019’s base rate of $1,610. This triggers the use of the 8% capitalization rate in the final calculation, resulting in an estimate of $1,450 per acre for the pay-2020 farmland base rate—a 10% decrease from pay-2019. Figure 1 and Table 2 show these results.
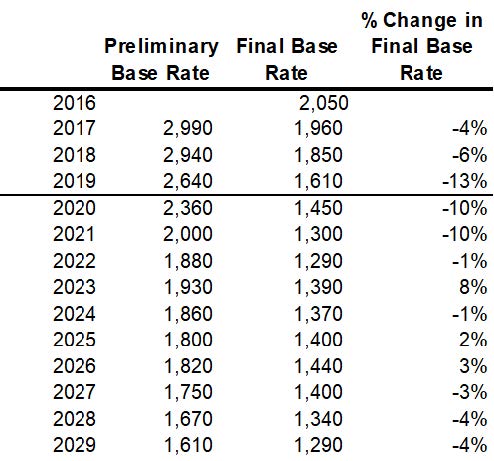
Table 2. Base Rate Projections, pay-2020-2029
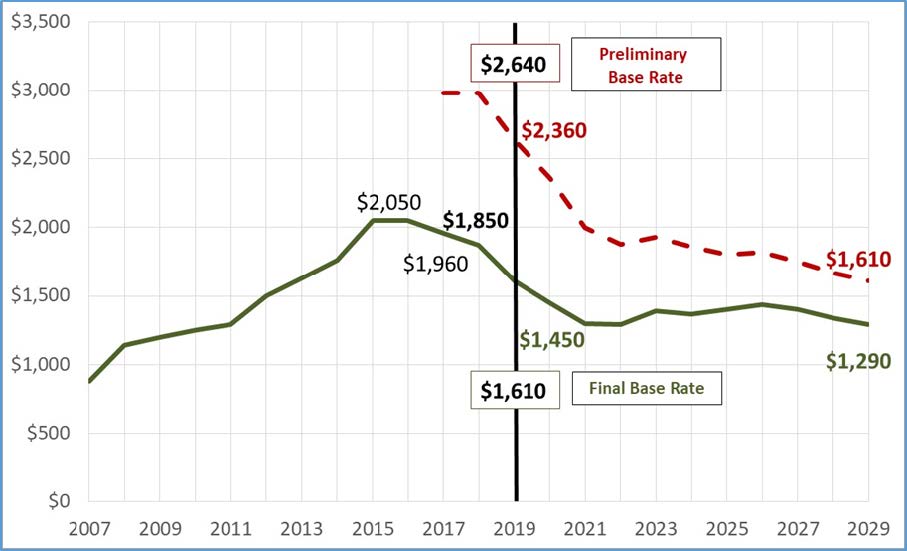
Figure 1. Base Rate per Acre of Farmland for Property Taxation Preliminary and Final Base Rate, 2007- 2019 and Projected 2020-2028
Beyond 2020 the forecast uses corn prices around $3.70 per bushel and soybean prices around $9.50 per bushel. Average cash rent is projected to fall to $189 per acre by 2020, and to remain stable after that. Projected property taxes decrease to $20 per acre by 2021 and stay in the low $20 dollar range through 2027. Other overhead costs are projected to trend upward by about 1.5% a year.
Interest rates are projected to rise through the mid-2020’s, then remain near 6.5%. This is less than the formula’s 8% capitalization rate used for the final base rate. As a result, it’s likely that the preliminary base rate will remain well above the existing base rate, so the final calculation will continue to use 8% in the denominator. This will continue until actual farm-related interest rates rise much closer to 8% or there is major increase in farm income, sustained for at least two years.
Table 2 and Figure 1 show the projections of both the preliminary and final base rates through 2029. The forecast shows a substantial decline through 2021, and then a relative stabilization of the base rate for the rest of the decade, at levels between $1,290 and $1,440. The projected 8% increase in 2023 occurs because the exceptionally low 2015 value ($994 in Table 1) drops out of the average in that year.
Of course there will be good and bad crop years and changes to the economy that will affect prices, costs and interest rates over the next decade. The trends used for these projections do not reflect these ups and downs. With the current trade issues, it’s especially difficult to forecast harvest crop prices this year.
Impact on Farmland Taxes
The base rate will fall through 2021, but farmland tax bills probably won’t fall as much. Local government property tax rates have been trending slowly upward. In rural areas where farmland is an important part of the overall tax base, a decrease in assessed values will cause an increase in tax rates, which will partly offset the drop in the base rate. Higher property tax rates mean other taxpayers will pay more. Farmland owners will still pay less.
Data Sources
Long-term projections for commodity prices, yields, variable costs and government payments came from the University of Missouri’s Food and Agricultural Policy Research Institute (FAPRI) and were adjusted for Indiana. Cash rent projections were made based on Dr. Michael Langemeier’s projected change in cash rents. For the 2018 crop year data was obtained from the sources DLGF uses in the base rate formula if available. Cash prices for June to December were estimated by Dr. Chris Hurt using current bids and future prices adjusted by historic basis. For more information on how this data is forecasted see the Purdue Agricultural Economics Report article from February 2017. https://ag.purdue.edu/agecon/Documents/PAER%20February%202017.pdf
The Department of Local Government provides documentation for its base rate calculation on its website. https://www.in.gov/dlgf/7016.htm
![]()
![]()
![]()
![]()
![]()
