Farmland Conversion in Indiana
August 9, 2024
PAER-2024-24
Todd Kuethe, Professor, Schrader Endowed Chair in Farmland Economics; and Megan Hughes, Graduate Research Assistant


Farmland conversion is once again an important topic across Indiana. A number of the respondents to the 2024 Purdue Farmland Value and Cash Rent Survey mention the influence of large public and private development projects on farmland market conditions in their area. These projects include developments related to infrastructure, manufacturing, energy, and residential land use.
For a number of years, the Purdue Farmland Value and Cash Rent Survey has asked respondents to evaluate the importance of ten market forces that may potentially influence the farmland market: (1) current net farm income, (2) expected growth rate in farm returns, (3) crop price level and outlook, (4) livestock price level and outlook, (5) current and expected interest rates, (6) returns to alternative investments, (7) outlook for U.S. agricultural export sales, (8) U.S. inflation rate, (9) cash liquidity of buyers, and (10) current U.S. agricultural policy. Respondents rate each market force on a scale of -5 to +5. A positive influence is given a value between 1 and 5, with 5 representing the strongest positive influence. Likewise, a negative influence is given a value between -1 and -5, with -5 being the strong negative influence. A score of 0 indicates the force was not influential. In 2024, an additional market force was added to the survey: the influence of farmland conversion.
As shown in Figure 1, our respondents suggest that farmland conversion is the largest positive influence on farmland prices in 2024. The effect is roughly equal to the downward pressure of current crop market prices, and it is exceeded in magnitude only by the downward pressure of interest rates.
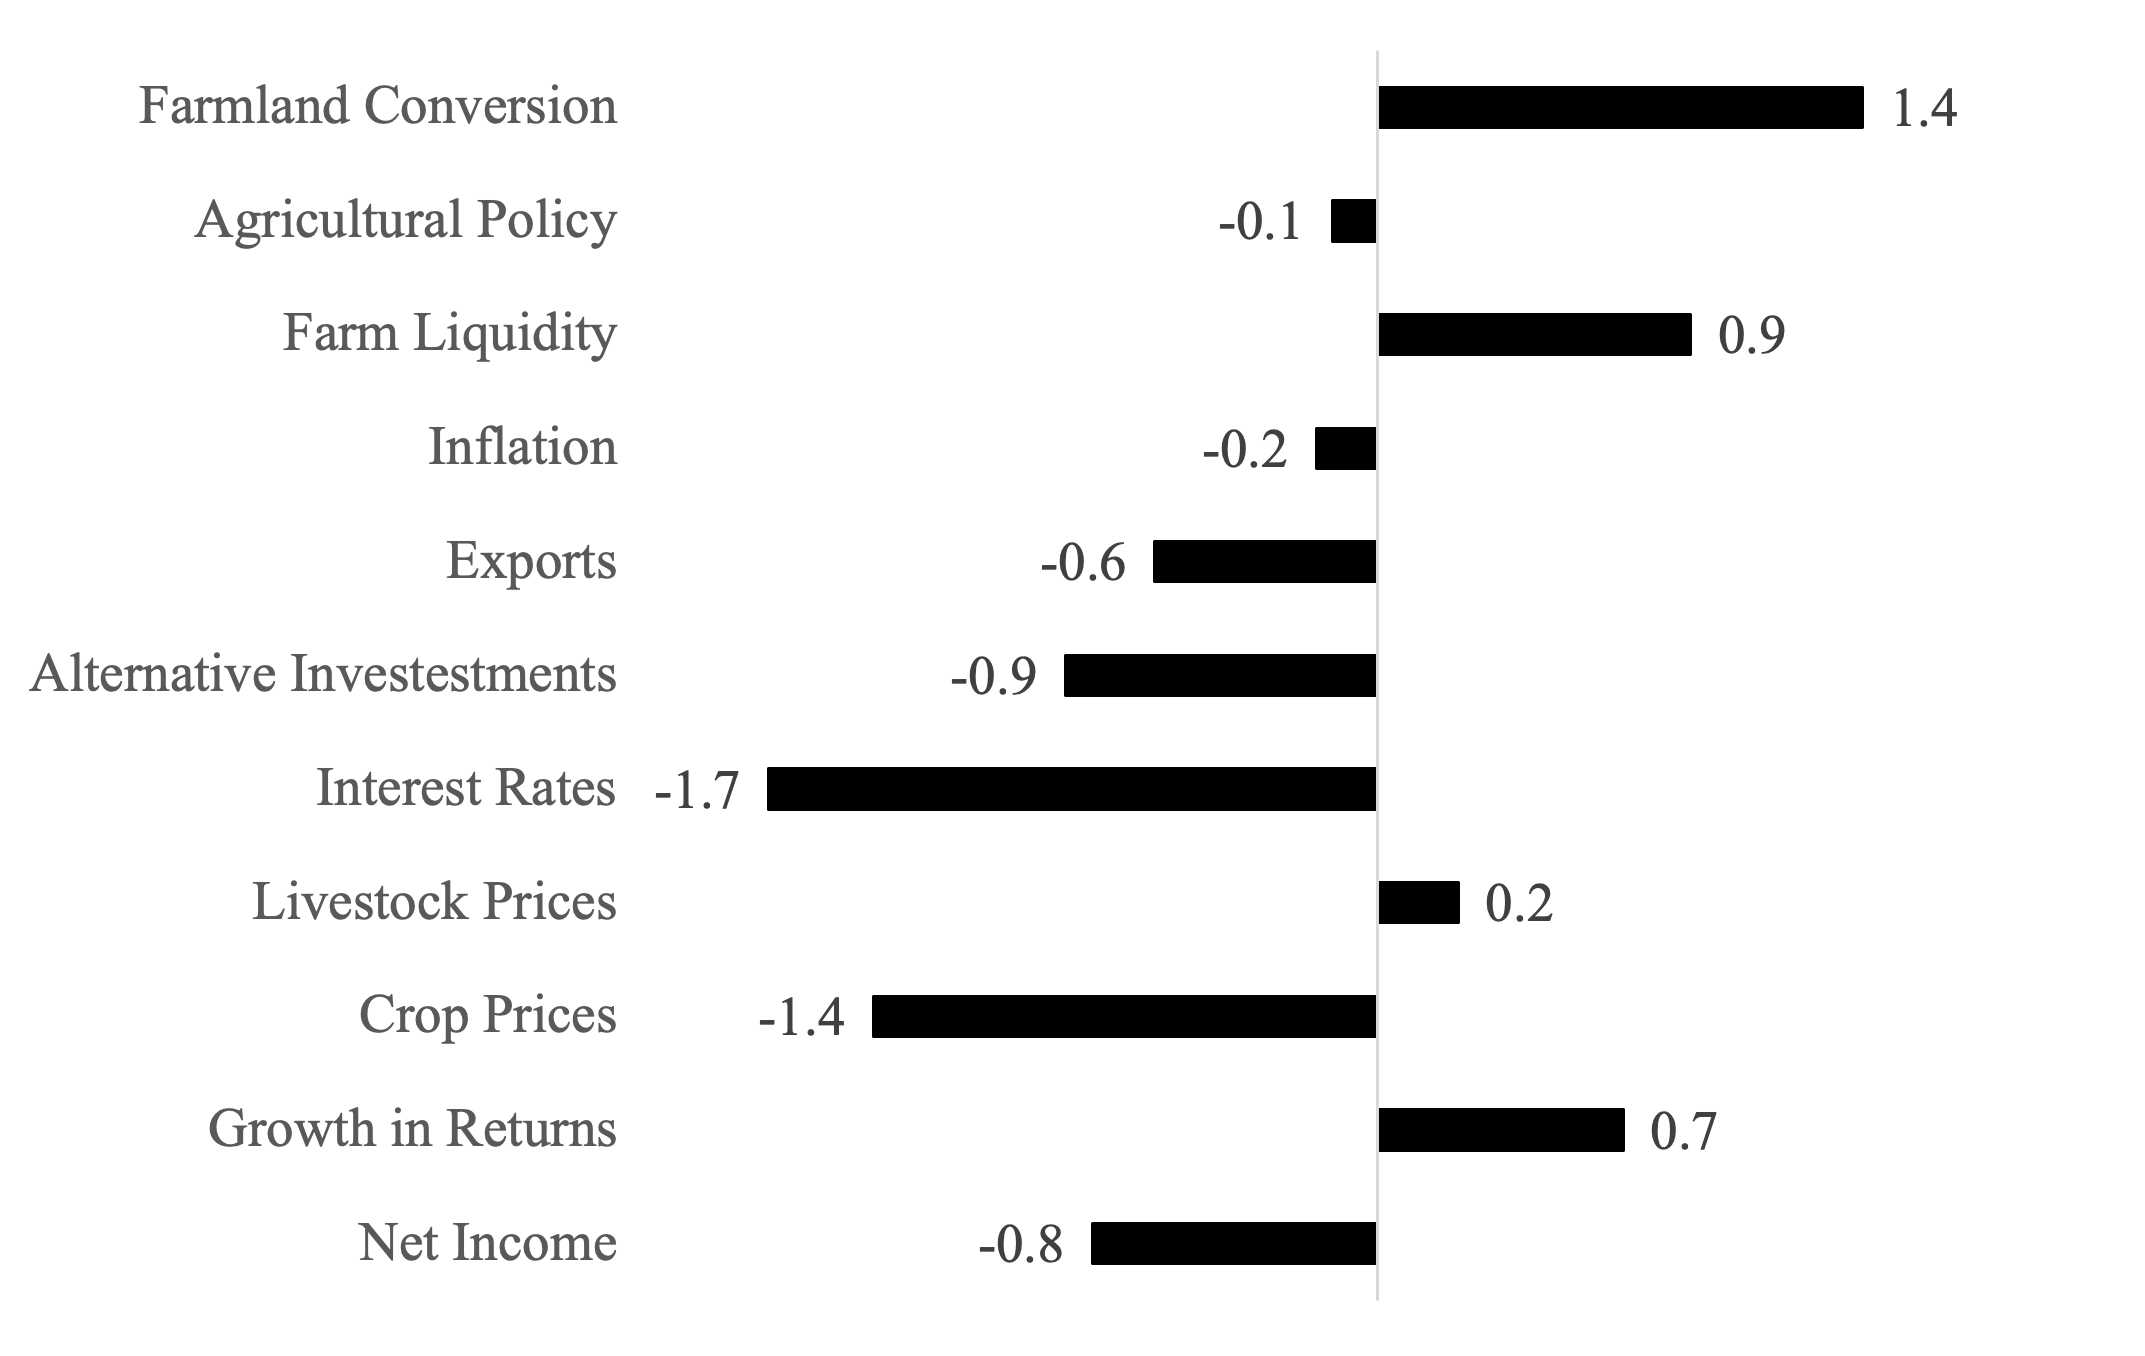
Figure 1: Influence of drivers or Indiana farmland values, 2024
As the Purdue Farmland Value and Cash Rent Survey continually shows, land that moves out of production agriculture and into other, typically higher value, uses tends to sell at a substantial premium to farmland in agricultural production, even the most productive lands. The dotted line in Figure 2 plots the percentage difference between the average price for top-quality farmland across Indiana and the value of land transitioning out of agricultural production. In 2023, farmland transitioning out of agricultural production sold at a 77% premium relative to high-quality land. This premium is driven by the demand for land for other uses. The solid line in Figure 2 represents the total number of housing construction permits in the state of Indiana (in 100s). In 2023, Indiana issued 27,055 housing construction permits.
Figure 2 shows that housing construction in Indiana fell drastically around the 2008 Financial Crisis. Between 2007 and 2009, housing construction permits fell by 47.3%, from 23,841 to 12,555. Over this same period, the premium for transitional land fell from 106% to 80%. Thus, prior to the 2008 Financial Crisis, farmland owners could effectively double their wealth by developing top-quality farmland for other uses, on average. Figure 2 further suggests that since 2011, the number of residential construction permits has generally been increasing, and the transitional premium soon followed, beginning in 2013. While housing permits and the premium have increased in recent years, both fall well below what was observed in the 1990s and early 2000s.

Figure 2: Price premium for transitional land and housing construction permits, 1990-2024
The primary concern of many across Indiana is the degree to which the increased demand for land ultimately leads to a loss in the amount of land available for agricultural production. The USDA Census of Agriculture provides one of the best measures of agricultural land in the United States once every five years. The most recent Census of Agriculture suggests that in 2022, Indiana was home to 12.5 million acres of cropland and nearly 633 acres of pastureland.
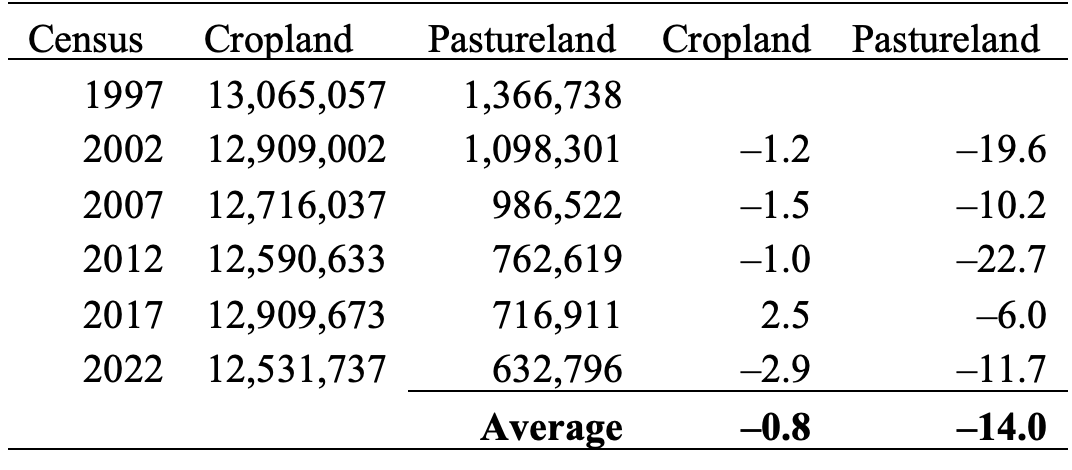
Table 1: Cropland and Pastureland Acres in Indiana, Census of Agriculture
As noted by the USDA, there are a variety of reasons that the amount of crop and pastureland can vary from Census to Census, including changes in technology, planting decisions, and changes in the methodology used in the Census of Agriculture. However, the data suggest that Indiana tends to lose a small share of cropland from Census to Census. The loss of pastureland is more pronounced, but it should be noted that some of this pastureland may have been converted to crop production. This notion is best supported by the increase in cropland acreage between the 2012 and 2017 Censuses. While there are certainly areas throughout Indiana that have experienced a large amount of farmland conversion, the Census of Agriculture suggests that, at the state level, land use change across Indiana may be considered relatively modest.
In short, farmland conversion is viewed as an important driver of farmland prices in many localized markets across Indiana. The price premium for land conversion is increasing yet remains below the highest observed almost two decades ago. At the state level, cropland conversion appears relatively modest, but there is some evidence that it has increased in the last five years.