Farmland Prices Increase Despite Downward Pressure
August 9, 2024
PAER-2024-22
Todd Kuethe, Professor, Schrader Endowed Chair in Farmland Economics
![]()
![]()
![]()
![]()
![]()
State-wide farmland prices once again hit a new record in 2024, according to the recent Purdue Farmland Value and Cash Rent Survey. The average price of top-quality farmland is $14,392, up 4.8% from June 2023 (Table 1). Average and poor-quality farmland also hit new highs at $11,630 and $9,071 per acre, with an annual increase of 3.7% and 4.4%, respectively. Survey respondents suggest that this price growth principally occurred during the second half of 2023, with prices retreating a bit in the first half of 2024.
Similar to the pattern observed in the previous year, the change in farmland prices from 2023 to 2024 varied substantially across regions and quality grades. The Southwest region experienced particularly high appreciation rates for top and average-quality land. The Southeast region, in contrast, experienced the most pronounced declines across all three quality grades. Traditionally, the Central region is home to the highest per acre prices across all three quality grades, yet, in 2024, the average price per acre for top-quality land in the Southwest now exceeds those in the Central region. The Central region still exhibits the highest value per acre for average and poor-quality land.
Respondents generally expect farmland prices to decline modestly through the remainder of 2024. At the state level, prices in December 2024 are expected to remain just above those observed in June of 2023.
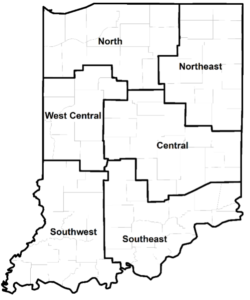
Figure 1: County clusters used in Purdue Land Values survey to create geographic regions
The value of land transitioning out of agricultural production exhibited a 21.6% gain from 2023, reaching a new high of $30,666 per acre. Several survey respondents note the influence of large-scale public or private land development projects in their area. One respondent notes that “production agriculture cannot compete with those economic forces,” and other respondents mention that farmers who sell their land to develop typically “reinvest” in farmland. In contrast, the state-wide average price for recreational land dipped slightly in 2024 to $8,089 (a 1% decline from 2023. The average price, however, likely masks the high variability of recreational land, which was characterized by one respondent as “nutty.”
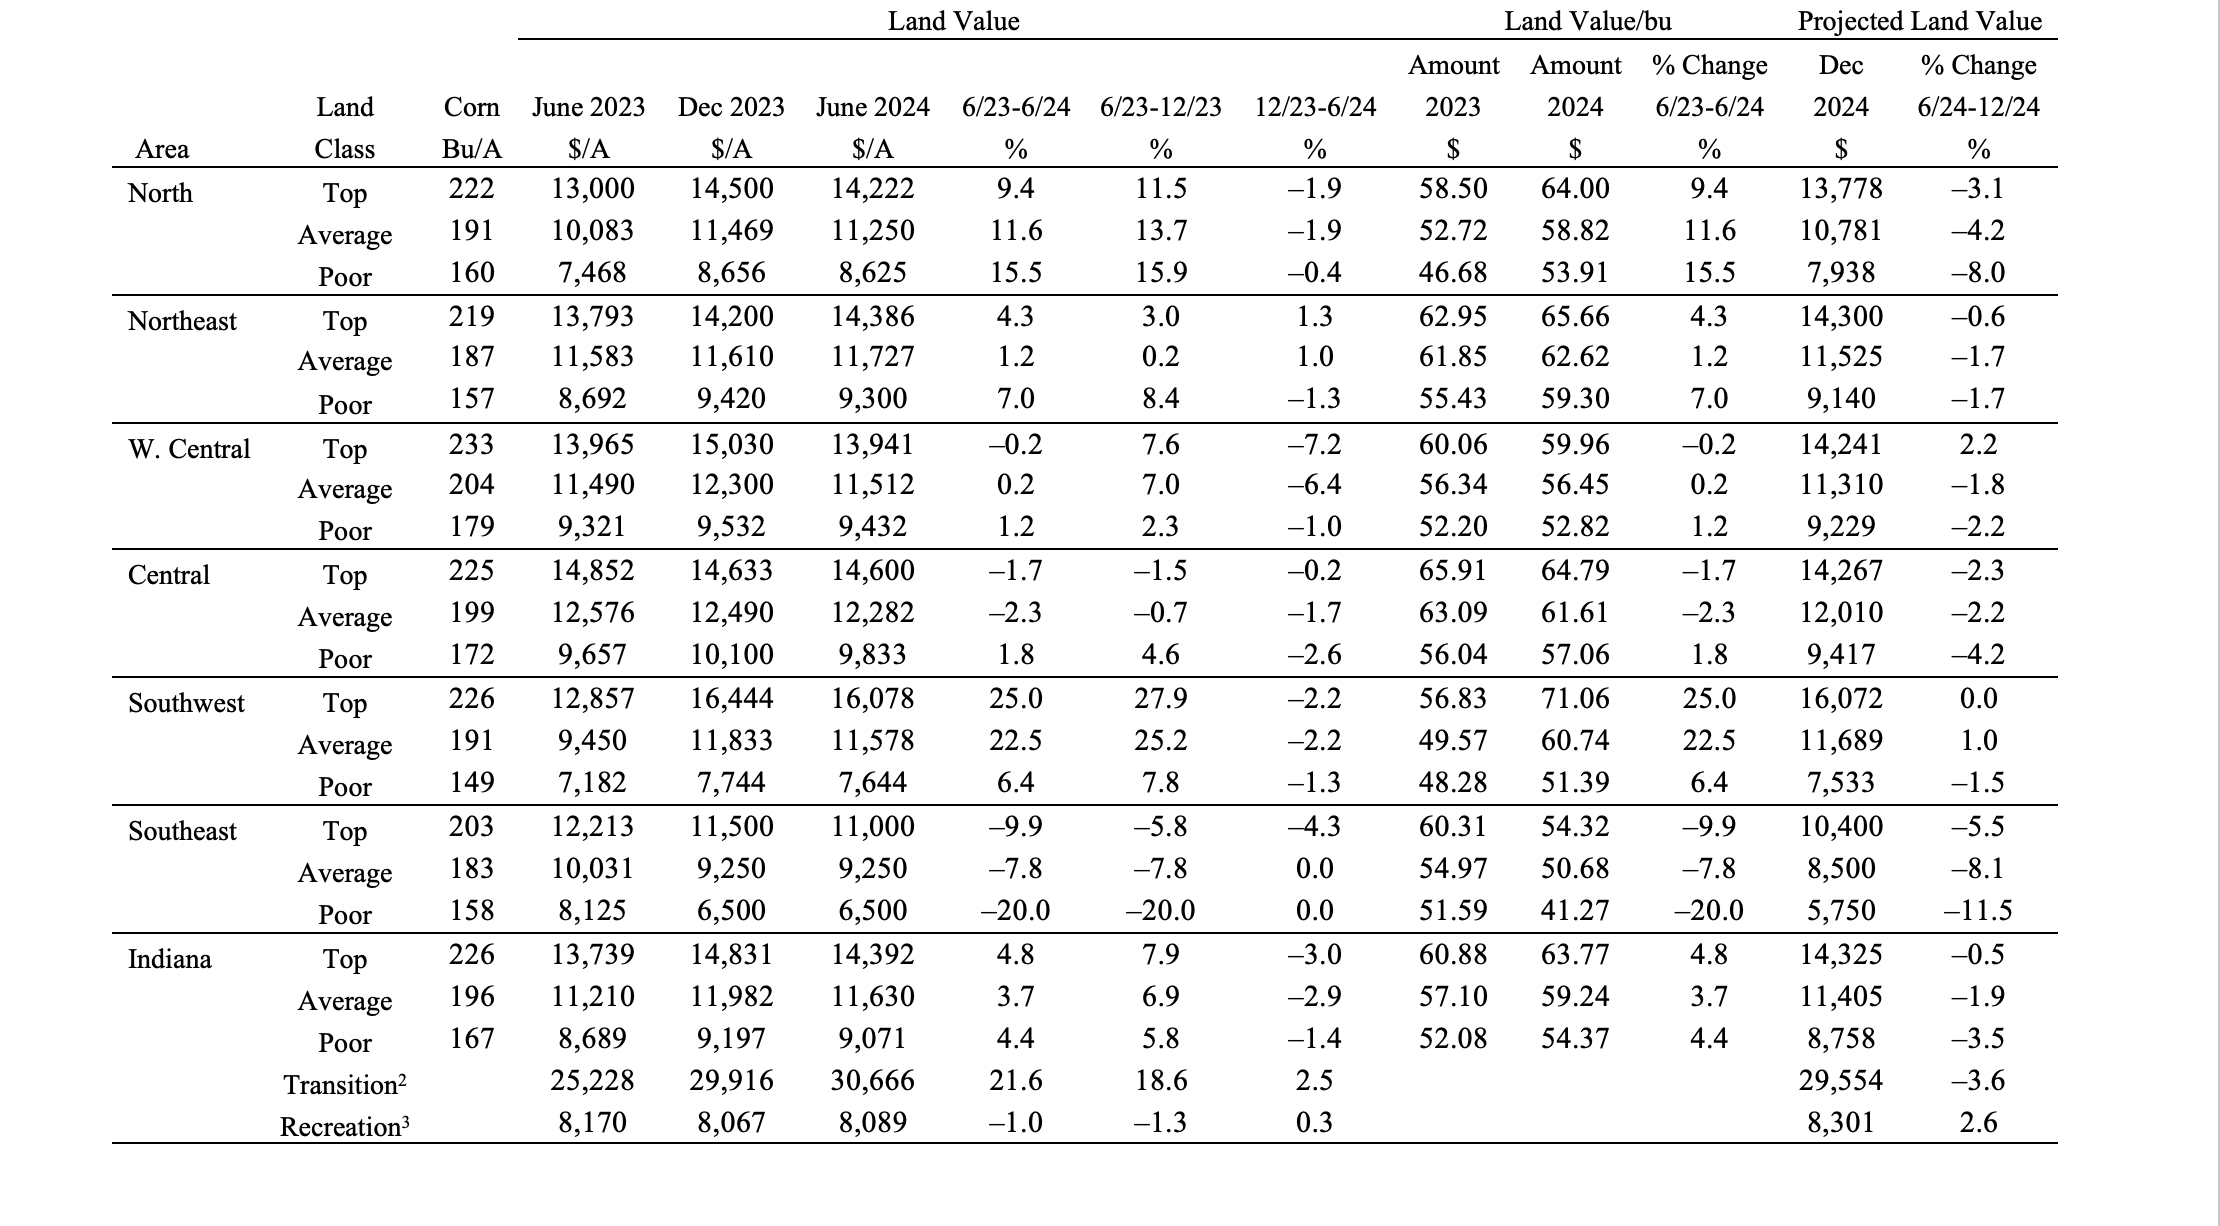
Table 1: Average estimated Indiana land value per acre (tillable, bare land), per bushel of corn yield, and percentage change by geographic area and land class, selected time periods, Purdue Land Value Survey, June 20241
1 The land values contained in this summary represent averages over several different locations and soil types. Determining the value for a specific property requires more information than is contained in this report and should include an evaluation by a professional appraiser.
2 Transition land is land moving out of production agriculture into other, typically higher value, uses.
3 Recreation land is land located in rural areas used for hunting and other recreational uses.
Farmland Market Forces
Respondents were asked to evaluate the importance of ten market forces that may potentially influence the farmland market: (1) current net farm income, (2) expected growth rate in farm returns, (3) crop price level and outlook, (4) livestock price level and outlook, (5) current and expected interest rates, (6) returns to alternative investments, (7) outlook for U.S. agricultural export sales, (8) U.S. inflation rate, (9) cash liquidity of buyers, and (10) current U.S. agricultural policy. Respondents rate each market force on a scale of –5 to +5, with –5 being the strongest negative influence. A positive influence is given a value between 1 and 5, with 5 representing the strongest positive influence. A score of 0 indicates the force was not influential. An average for each item was calculated, and averages for 2022, 2023, and 2024 are included in Figure 2. The horizontal axis shows the item from the list above.
The most notable difference between 2024 and the two preceding years is the number of market forces putting downward pressure on farmland prices. Similar to previous years, higher interest rates are putting the strongest downward pressure on farmland prices, and respondents suggest that the influence of the high interest rate environment is increasing relative to previous years. As of June 2024, farmland prices are also being negatively impacted by farm incomes, crop prices, the return to alternative investments, and exports. Both inflation and agricultural policy place modest negative pressure on farmland prices, as well. In addition, the respondents suggest that the positive influences like growth in returns and farmers’ liquidity are less impactful than in previous years.
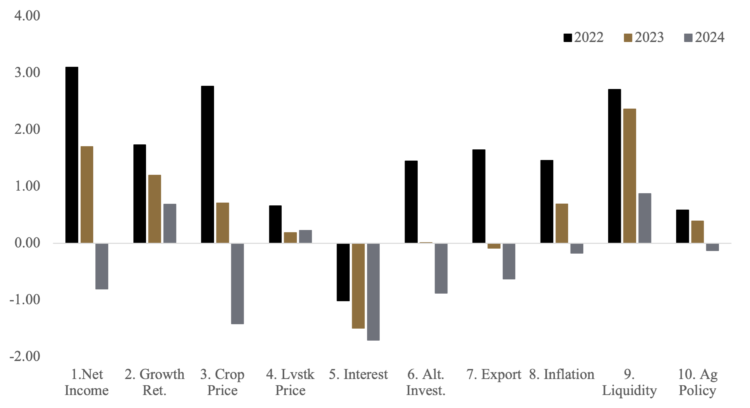
Figure 2: Influence of drivers of Indiana farmland values
As one respondent summarizes, “Lots of fundamentals pointing towards lower farmland prices, but low supply is keeping them up.” As shown in Figure 3, the majority of respondents (63%) suggest that less farmland is on the market in June of 2024, relative to June 2024. The remaining respondents see little change in farmland available for sale, and no respondents reported an increase in the amount of land for sale. As another respondent notes, “current market seems to be influenced by supply as much as crop prices and interest rates. We have a lower than average overall supply on the market, along with steady demand, so prices are firm.”
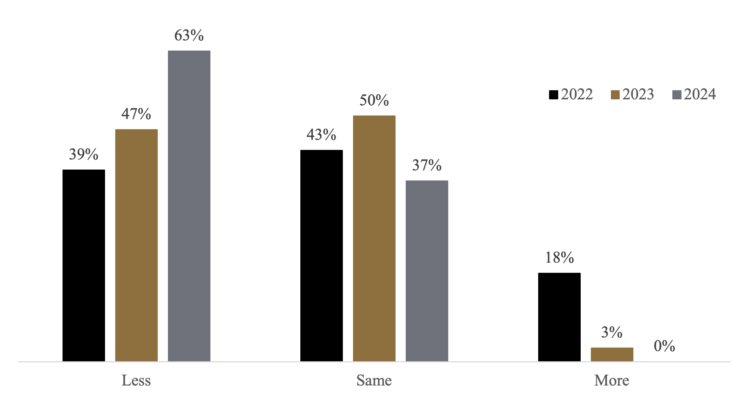
Figure 3: Percentage of respondents indicating less, same, or more farmland on the market than in the previous June
Five-Year Forecasts
Respondents’ pessimism about the remainder of 2024, however, does not appear to carry over to the medium to long term. Respondents were asked to forecast the five-year average corn price, soybean price, mortgage rate, and inflation rate (Table 2). While respondents are slightly less optimistic about corn and soybean prices relative to a year ago, their price expectations sit just above the average over the last five years. In addition, respondents expect both interest rates and inflation to moderate slightly, relative to the previous year. In addition, respondents expect both cash rents and land values to increase by around 13% by 2029. Thus, respondents likely expect conditions to improve across the agricultural sector and the broader economy over the next five years.
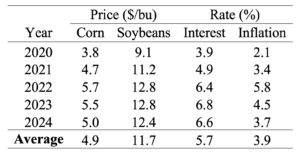
Table 2: Projected five-year average corn and soybean prices, mortgage interest, and inflation
Cash Rent
Statewide, cash rents exhibited little change from 2023 to 2024 (Table 3). Indiana per acre cash rent for top quality land increased by 2.3% to $313, and per acre cash rent for average quality land increased by less than one percent to $260. The statewide average per acre cash rent for poor-quality land, however, fell by 3.7% to $204. These statewide averages, however, mask some of the variation across Indiana. Rental rates for all quality grades declined in both the Central and Southeast regions but exhibited modest increases across various quality grades in other regions. These changes largely follow what was observed in land values, as represented by rental rate as a share of land values, which held relatively steady from 2023 to 2024. In addition, rental rates per bushel of corn held relatively stable as well.
Looking Ahead
While farmland prices increased between the 2023 and 2024 Purdue Farmland Value and Cash Rent Surveys, much of the growth appears to have taken place in the later half of 2023. A number of forces are placing downward pressure on farmland prices, most notably interest rates and crop prices, yet respondents suggest that current prices are being supported by the relatively small amount of land available for sale. Survey respondents are generally pessimistic about the remainder of 2024, but their longer-term expectations for economic conditions are not as gloomy.
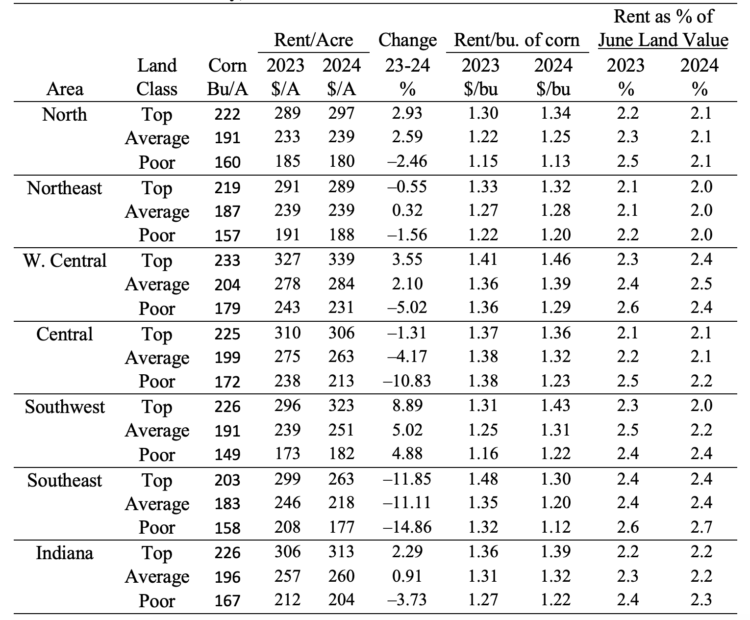
Table 3: Average estimated Indiana cash rent per acre, (tillable, bare land) 2023 and 2024, Purdue
Land Value Survey, June 2024
Purdue Farmland Value and Cash Rent Survey
The Purdue Farmland Value and Cash Rent Survey is conducted each June. The survey is possible through the cooperation and contribution of numerous professionals knowledgeable of Indiana’s farmland market. These professionals include farm managers, rural appraisers, land brokers, agricultural loan officers, farmers, and Farm Service Agency (FSA) county office directors.
These professionals were selected because their daily work requires they stay well-informed about farmland values and cash rents. These professionals provide an estimate of the market value for bare poor, average, and top-quality farmland in December 2023, June 2024, and a forecast for December 2024. To assess productivity of the farmland, respondents provide an estimate of long-term corn yield for top, average, and poor productivity farmland. Respondents also provide a market value estimate for land transitioning out of agriculture and recreational land.
The data reported here provide general guidelines regarding farmland values and cash rent. To obtain a more precise value of an individual tract, contact a professional appraiser or farm manager who has a good understanding of the local market.
Prior reports are located at: https://purdue.ag/paer_archive
![]()
![]()
![]()
![]()
![]()