Farmland Value Outlook
December 16, 2017
PAER-2017-26
Author: Craig Dobbins, Professor of Agricultural Economics


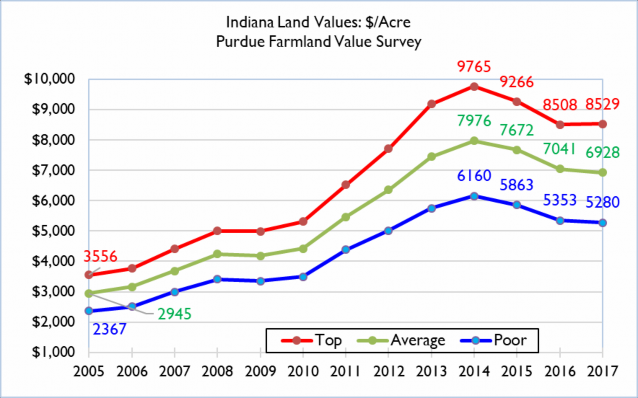
Average quality Indiana farmland reached a peak of $7,976 per acres in 2014. The 2017 Purdue Farmland Value Survey indicated average quality farmland was valued at $6,928 per acre, 13% less than the peak value and 1.6% less than the June 2016 value. The primary force behind the decline of farmland value has been the decline in cropping profitability. In 2014, the Purdue Crop Guide indicated a contribution margin of $345 for corn and $395 for soybeans or $370 for a corn-soybean rotation. The contribution margin represents the amount of revenue remaining to pay the overhead or fixed costs of unpaid owner labor, machinery and facilities overhead.
As Indiana farmers move into 2018, higher than expected 2017 yields surprised many producers, but grain prices remain at low levels. While there have been some down-ward adjustments in the cost of inputs, input prices have been slow to reflect the lower grain prices. With abundant corn harvests of 2016 and 2017 corn stocks have been rising. Barring an unexpected supply disruption in 2018, it seems unlikely corn and soybean prices will be significantly higher. The 2018 Purdue Crop Cost & Return Guide projects the corn contribution margin to be $208 per acre while the soybean contribution margin is $264 per acre or for a corn soybean rotation $236 per acre. Over the years from 2014-2018, the contribution margin has declined 33%. If the percentage of the contribution margin allotted to land remains the same as 2014, the amount going to farmland today would be 33% less. Capital asset pricing theory indicates a 33% reduction in long- term income generated by farmland results in a 33% decline in farmland value.
While the decline in income generated by farmland is a strong negative influence on farmland values, other factors influence farmland values. Low long-run interest rates continue to be supportive but the Fed has begun to raise interest rates. As these higher rates spread through the economy, this will create resistance to higher farmland values.
Farmland is still viewed by many as a good long-term investment. There are a number of potential buyers both inside and outside agriculture. The supply of land being brought to market continues to be in balance with the demand; both have declined. One of the important dynamics of the farmland market decline in the 1980s was the excess supply of farmland on the market because of the high foreclosure rate. The presence of an excess supply of farmland is not present in this period of farmland value decline. Producers continue to look for ways to lower the per bushel direct and fixed costs of producing corn and soybeans. Increasing the acres farmed (farm consolidation) through purchase is a common occurrence. Finally, there are still buyers in a strong cash position, but fewer are likely to be farmers.
Some state surveys are finding small increases in farmland values, perhaps indicating the downward adjustment is slowing or even ending. The 2017 Purdue Land Value Survey indicated a bit of stabilization in farmland values but there were still significant reductions in areas of the state. The continued tight margins in crop farming combined with slowly rising long-term interest rates is expected to favor a continuation of the downward price movement. For 2018, it seems Indiana farmland values are likely to decline another 5% to 10% from 2017 levels.