Financial Performance: Measurement and Analysis
March 13, 2000
PAER-2000-05
![]()
![]()
![]()
![]()
![]()
One task of a farm business manager is measuring and analyzing financial performance. To success-fully accomplish this task, the farm business manager must decide how the evaluation will be conducted, collect data that accurately reflects actual performance of the business, and develop a set of standards or benchmarks for measuring performance. If performance is not satisfactory, the manager must make adjustments that will lead to improved performance.
What is the financial position of my farm business? Do I have the financial capacity to weather a period of low prices? Am I headed for financial trouble or have I made good financial progress? How does my financial position compare with others? These are questions that many farm business managers are asking today.
This article provides worksheets that will be helpful aids for identifying and organizing data for the measurement of financial performance. To conduct a financial assessment of your business you will need data that measure annual receipts and expenses (Internal Revenue Service Schedule F and Form 4797), and balance sheets that correspond to the beginning and ending of your tax year. Using these items, it is possible to complete the financial assessment with very little additional work.
What should I look for?
In assessing the financial position of a farm business many analysts begin with a brief financial description. This financial description includes six items:
- Total assets
Total assets represent the market value of all financial and capital resources owned by the business at the time of balance sheet preparation. Total assets indicate the size of the business’ financial resources in terms of overall capacity.
- Total liabilities
Total liabilities measure the value of total debt obligations at the time of balance sheet preparation. Total liabilities indicate the financial claims of lenders, input suppliers, and others on the business.
- Owner equity
Owner equity measures the value of the owners’ claims on total assets. It is determined by subtracting total liabilities from total assets and often is referred to as net worth. Owner equity indicates the owners’ financial stake in the business—their financial commitment to the business.
- Gross revenues
Gross revenues measure the total value of products produced by the business. To improve the accuracy of this measure, it is best that gross revenues for the year be expressed on an accrual or accrual-adjusted basis (i.e., whether sold for cash or held in inventory). Gross revenue indicates the income from sales and other farm income sources available annually to cover expenses, principal payments, family living, income taxes, expansion, etc.
5.Total expenses
Total expenses measure the total of fixed and variable expenses incurred during the year as measured by the accrual-adjusted income statement. Total expenses indicate the total costs incurred in producing gross revenues.
- Net farm income
Net farm income measures the net income available on an
accrual-adjusted basis after fixed and variable expenses have been deducted. This is a basic measure of the profitability for the farm operation. For the sole proprietor form of business, net farm income indicates the amount of income available for family living, income taxes, capital investments, etc. In order to make financial progress from business operations, net income must exceed the owner withdrawals for family living and income taxes.
Table 1 summarizes common financial performance measures used by analysts and lenders, indicates what they mean, and provides values that can be used in benchmarking.
What is benchmarking, and what are benchmarks? Benchmarking refers to the practice of looking for those businesses that are the best at doing something and learning how they do it in order to emulate that performance. Financial benchmarking involves looking for actual performance data from farms that are comparable to your own. Financial benchmarking oftentimes provides crucial evidence for answering the question, “How should my farm be doing if it is going to be competitive in the farming industry?”
Ratios rather than absolute financial measures are often used for benchmarking. Ratios present financial information in the form of a relative relationship between two absolute measures of performance. This removes the influence that business size has on the measure, making ratios easier to compare and interpret than absolute measures.
For example, liquidity can be measured by working capital (cur-rent assets minus current liabilities), but in order to know if the amount of working capital is adequate, the size of the farm must be known. It is difficult to make comparisons among farms because of the differences in size. In Table 1, we suggest measuring liquidity using the current ratio (current assets÷current liabilities). Because these two measures are now compared in the form of a relative relationship, adjustments for size are not necessary, and more meaningful comparisons across farms of different sizes can be made. The use of relative relationships also allows comparisons to be made for the same farm for several different years.
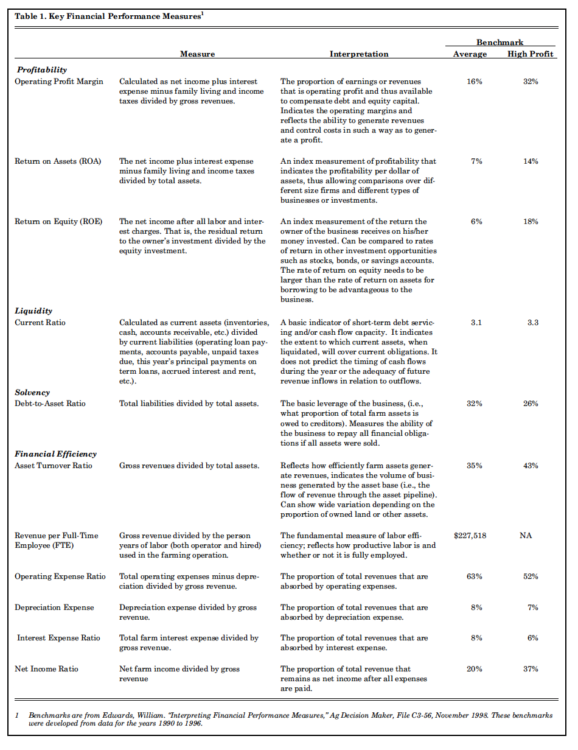
Table 1. Key Financial Performance Measures
What calculations are needed?
Assessing the financial condition of a farm business requires information from a balance sheet and an income statement. Most farmers have a balance sheet, particularly if they borrow money since this document is a standard requirement of the credit transaction. Some farmers will have quite complete income statements based on an accrual accounting system, but many will only have a Schedule F tax return to provide evidence of their income generating capacity. Even with this limited information, you can complete a relatively accurate financial analysis including the key performance measures identified in Table 1.
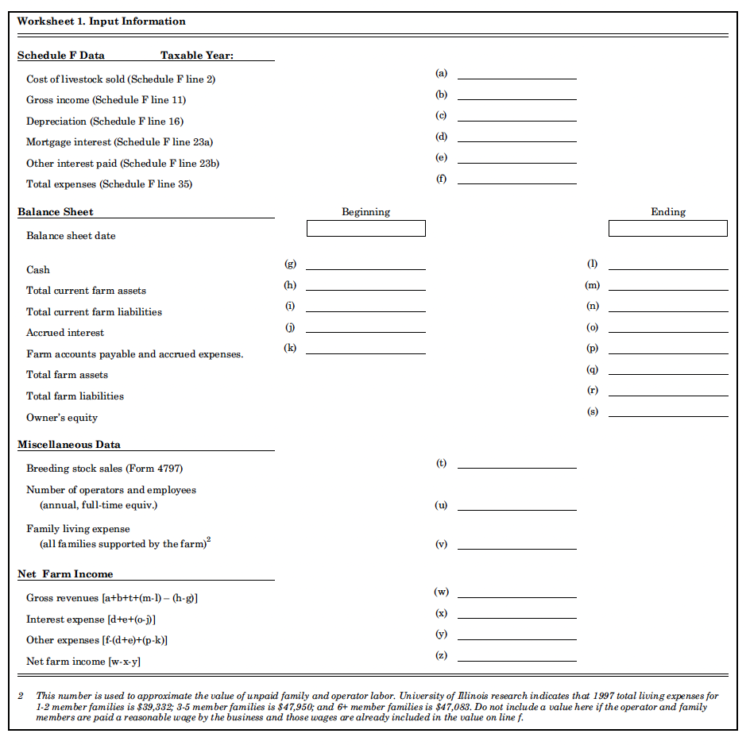
Worksheet 1. Input Information
You can use Worksheet 1 to organize the appropriate input information. One of the virtues of this worksheet is that you should already have most of the required data, once you have filed your income tax return. This worksheet will help you obtain the best estimates possible of key financial performance ratios with a limited amount of readily available data.
In order for the worksheets to generate accurate accrual-adjusted financial measures, the beginning and ending balance sheet dates should fall within a few days of the beginning and ending dates, respectively, for a farmer’s taxable year. For example, March 1 balance sheets would produce unreliable measures when combined with a calendar year Schedule F.
Worksheet 1 identifies where specifically to look for the necessary information in the federal income tax return and what type of information to input from beginning and ending year balance sheets. Worksheet 2 guides you through a series of specific computations using the data from Worksheet 1. The computations required by Worksheet 2 produce values for the key financial measures outlined in Table 1. Once these measures have been computed, you can transfer the high-profit benchmarks from Table 1 to the benchmark column on Worksheet 2. Finally, you should compare the values for each of the financial measures to the corresponding benchmark in order to assess the financial performance and financial position of your farm.
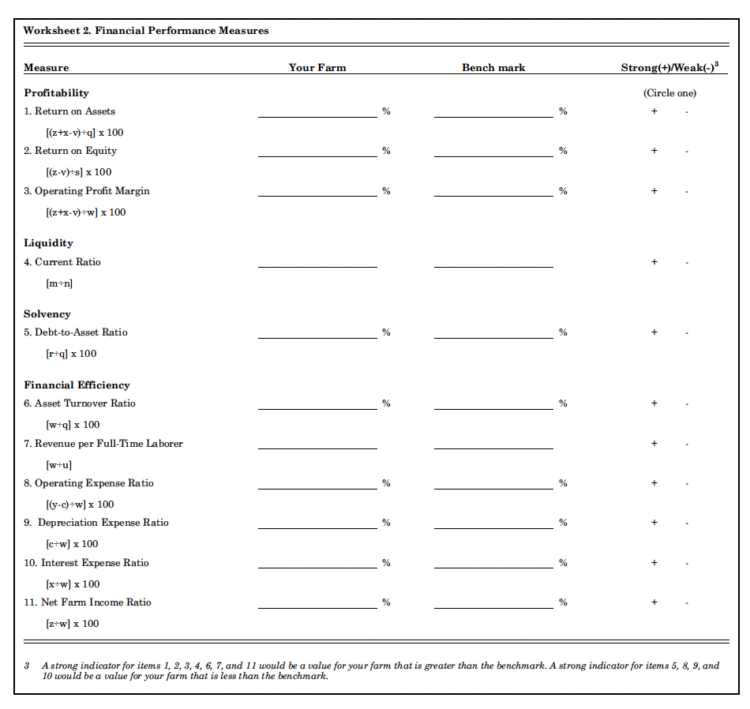
Worksheet 2. Financial Performance Measures
How do you measure up?
Indications of financial strength will depend on the measure being considered. In some cases, a measure with a value greater than the benchmark will indicate financial strength. In other cases, a value smaller than the benchmark will indicate financial strength. Table 2 indicates which measures fall into which categories.
At a very minimum, your farm needs to perform better than the average of farms that are similar to your own. The average benchmark provides a reference point for recognizing better-than-average performance. More likely than not, that level of performance will not be good enough long term, and so producers should benchmark against the top performing or so-called “high-profit” farms, whenever they are establishing performance standards or targets for their farms. Benchmarks of this type should at least be in your sights, even if your own measures indicate that you are currently falling short of the mark.
Farm business managers have several alternatives available for set-ting performance standards or benchmarks. Generally, it is important to assess your current performance relative to performance in prior years. This can often lead to valuable insights into trends in business performance. It is also important to try to control financial performance by projecting expected values for the key performance measures for your farm. These projections can then be used to systematically evaluate variations between planned performance and actual performance. The reasons for differences between actual and expected performance need to be determined. In some cases, the differences will indicate adjustments are needed. While both of these inward-looking approaches to assessing business performance are useful, neither tells management much about farm competitiveness. In order to feel comfortable that the farm is competitive, you need to look at how other similar farms in the farming industry are performing.
Financial benchmarks for farms are almost always derived by aver-aging the actual performance data from a large group of farms. The high-profit benchmarks are typically derived by selecting the one-fourth or one-third of the farms in that large group that are the most profitable and averaging the financial performance measures from those farms. Farm Business Associations in Illinois, Iowa, and other midwestern states are important sources of such data. Often, these associations work with enough farms that they can sort farms into different groups based on differences in size, major enterprises, etc. This allows the producer who is looking for appropriate financial benchmarks to choose benchmarks from farms that are very similar to his or her own farm.
Make an effort to know as much as possible about the source of the benchmarks against which you plan to measure your farm’s performance. Some benchmarks are highly variable in terms of what constitutes top performance based on factors such as the type of farm commodities produced. For example, gross revenue per person on a high-profit dairy or swine farrow-to-finish operation typically will be lower than for high-profit cash-grain farms.
Also, other factors, such as the time period over which the performance information was gathered, will influence the values for certain measures. Even methods used to summarize income, expenses, assets, and liabilities can have a big impact on the reliability, consistency, and comparability of the resulting measures. For example, the value of farm production is a popular alternative to gross farm income for computing financial efficiency measures in some areas of the country. These two alter-native measures of farm revenues can produce significantly different values for financial efficiency measures on a farm with significant feed and/or feeder livestock purchases. Furthermore, the value of farm pro-duction tends to be computed in several different ways. It’s essential to know where the benchmarks come from, how the raw farm data was summarized, and how the benchmarks were calculated before you rely on them.
A web site that provides links to benchmark data from selected farm business associations is available at www.agecon.purdue.edu/extensio/finance. The benchmarks provided in Table 1 provide representative benchmarks for general farm types for the period of 1990-1996. Data available through the web site provide benchmarks for specific types of farms and for specific years.
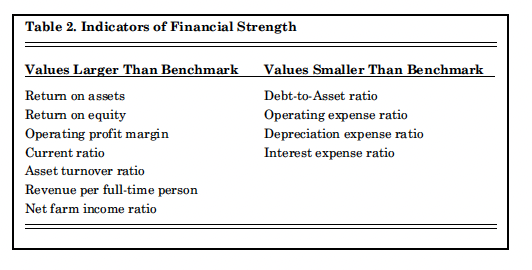
Table 2. Indicators of Financial Strength
Assessing strengths and weaknesses is the first step in the analysis process. Next, consider why particular measures turned out the way they did. That is, make sure you can identify and understand the causes of better than average as well as poorer than average performance measures. Finally, think about how to build on strengths and correct weaknesses.
In the last column of Worksheet 2, circle the plus or minus, as appropriate, to assess the financial strengths and weaknesses of your farm relative to the benchmark farms.
A Final Comment
The information and worksheets in this article will help you measure and analyze the financial position of your farm business. We encourage you to make copies of the worksheets and use them annually. While analysis for any one year can provide you with useful insights, the trends that you will uncover through annual use of the worksheets will provide you with increasingly valuable information.
![]()
![]()
![]()
![]()
![]()
