Give Your Farm a Business Performance Checkup
March 16, 1992
PAER-1992-2
Don Pershing, Extension Economist
![]()
![]()
![]()
![]()
![]()
How do you measure your farm business performance? There is a big difference in income between the top half and the lower half of the 94 Indiana fa1ms that participated in the Comparative Farm Business Summary for 1990. While these farms did not represent all farms in Indiana, the income difference shows variations in production, marketing, and financial performance among farms.
Compared to other farms, some managers did a much better job of doing the right things at the right time. These include:
- selecting the right crops and livestock
- selecting the right machinery and facilities
- using the right kind and amount of seed, fertilizer. and crop chemicals
- carrying out the crop and livestock jobs in the right way
We identify these people as being better managers.
Farm profit was $88.532 for the high-profit group compared to $37,717 for the low-profit group. After figuring a 6% return on their equity, the highprofit group had labor and management earnings of $63,564 compared to $6,086 for the low-profit group. After figuring a labor and management charge, the high-profit group made a 12% return on their total investment compared to 4% for the low profit group. The high-profit group had 26 cents from each dollar of returns to pay interest on borrowed money, reduce debt, and build up investments compared to 13 cents for the low-profit group.
You can use the results to give your farm a business performance checkup. Just as tests for blood pressure and cholesterol indicate your physical health, these analysis factors indicate the “health” of your farm business. You will learn what these factors mean and how to apply them to your farn1 situation. The 1990 Farm Business Summary, publication EC-658, is available at your local Extension Office. Your local Extension Agricultural Agent can help you learn to use FINAN or FINANX to analyze your farm business.
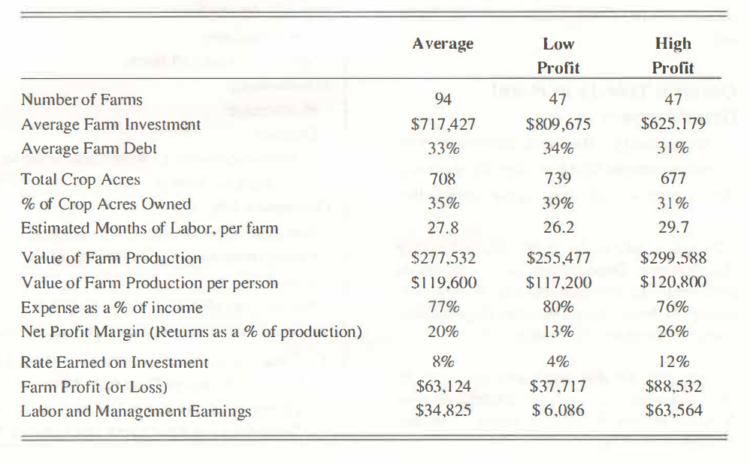
Figure 1.
![]()
![]()
![]()
![]()
![]()
