Government Program Decisions For 1992
March 16, 1992
PAER-1992-4
Chris Hurt, Extension Economist; Don Pershing, Extension Economist; Lee Schrader, Professor; and Bob Jones, Professor
![]()
![]()
![]()
![]()
![]()
The 1992 government program is the second year under the 1990 Farm Act. Since it is a continuation of the same act, the mechanism of the program is similar, but several key parameters have changed, which may alter some farmers’ decisions from last year.
Parameters which have changed from last year include the set-aside levels required for program participants, loan levels, and anticipated new crop prices of corn, soybeans, and wheat. Set-aside levels this year are 5% for both wheat and corn. This is down from 15% for wheat last year and 7.5% for corn. Loan levels are higher this year with wheat set at $2.21 per bushel and corn at $1.72. Target prices are frozen for the duration of the Act at $4.00 per bushel for wheat and $2.75 for corn.
Relative new crop prices are expected to be important in guiding decisions of which crops to plant on flex acres this spring. As of this writing, anticipated new com prices are higher than they were a year ago, but new crop beans are lower. This implies that farmers will have greater incentives to plant corn rather than beans. New crop wheat prices are sharply higher than last year’s, and damage to the winter wheat will likely result in shifting some wheat acres to corn and beans. Relative prices of lndiana’s three major crops may vary into spring and alter final planting decisions.
Best Crop Without Government Payments
Again for 1992, corn and wheat bases have 15% Norn1al Flex Acres (NFA) and 10% Optional Flex Acres (OFA). Crops on NFA do not receive deficiency payments, and farmers are free to plant whatever crop they elect (with the exception of fruits, vegetables, and specialty crops). The OFA can also be planted to any qualifying crop; however, it is only eligible for deficiency payments if planted to the program crop. For example, if a farmer plants soybeans on the com OFA, he will not receive deficiency payments on the portion of the OFA seeded to beans. However, if he plants corn on the corn OFA, he will receive corn deficiency payments on the portion of the OF A planted to com. These provisions are the same as last year.
Since the 15% com and wheat NF As do not receive any government deficiency payments, the most economic crop on these acres is the one which provides the highest anticipated economic returns without government payments.
The calculations in this paper are based on returns per acre above direct costs for average quality [ndiana soils. Yields in bushels per acre on these soils are 122 for corn; 39 for soybeans; 61 for wheat; 42 for canola; and 23 for double crop soybeans. Harvest-time prices were as follows in dollars per bushel: corn $2.40; soybeans $5.80; wheat $3.60; and canola $4.75 (50 pound bushel). Direct costs per acre are from Purdue 1992 crop budgets available at Purdue Extension Service offices.
The following figure shows anticipated returns per acre above direct costs. lt is clear that wheat plus double crop soybeans provides the highest anticipated returns. However, most Indiana farms will not have wheat plus double crop beans in 1992 either because they are too far north to double crop, or because they did not seed wheat in the fall of 1991. In addition, canola is a late summer seeded crop, and since it was seeded on few acres last fall, it is not a viable crop on most farms for 1992. Thus, the decision for the vast majority of Indiana’s crop acres comes down to either corn or soybeans. Corn returns are currently in the range of $25-35 per acre higher than soybeans. Thus, many farmers will find the best crop on NFA acres will be corn.
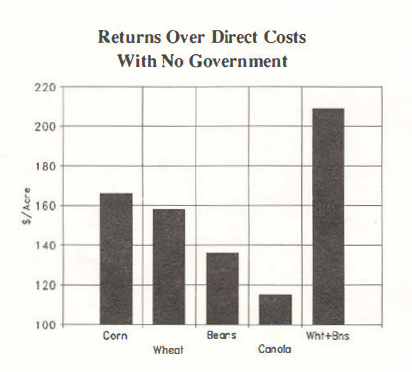
Figure 1. Returns Over Direct Costs With No Government
Key Questions On Corn Base
- Should I Participate or Stay Out? Each year farmers ask the question, “Can I achieve higher returns by staying out of the program and thus avoiding idle acres in the set-aside?” One of the most critical comparisons is to evaluate potential returns in and out of the program at various corn price levels. This evaluation is shown in the next figure.
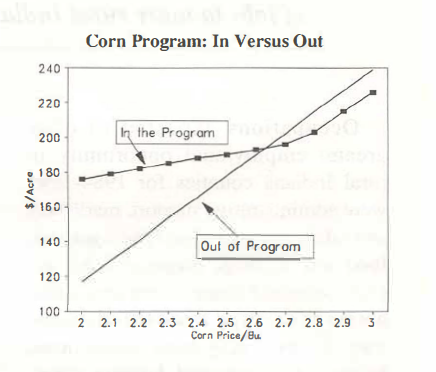
Figure 2. Corn Programs: In Versus Out
Returns in the program are higher than out of the program when price levels are under $2.60 for new crop harvest prices. As prices move above the $2.60 range, anticipated returns are generally better outside the program. While this is an average range for Indiana, those farmers who expect to receive a higher price than the U.S. average, such as those in strong basis areas near the Ohio River, may require a $2.80 level to be better off outside the program. It is also important to remember that the program provides enormous protection from the effects of lower prices, but only modest gains if prices are high. This can be seen on the figure by observing the large potential loss from being out of the program if prices are $2.30, versus the modest potential gain of being out of the program if prices are $2.90.
It is expected that about two-thirds of Indiana’s com base will be in the corn program this year. This is somewhat lower than last year when participation was 70.5% of the state’s base. The modestly lower participation is related to higher new crop corn prices this year.
- Should Beans Be Planted on Corn NFA/OFA? Given the assumptions for our analysis, soybean prices would need to be around $6.50 or higher to favor beans on com NF A, and around $7 .50 or higher to encourage beans on corn OFA. These lofty levels would suggest that many farmers should not consider beans flexed to corn. However, most farmers will want to do some further evaluation on this question. For many, added bean acres would mean a reduction of corn-on-corn acres. Purdue agronomists find that continuous corn requires more insecticides, and that yields are about 7% lower than a cornsoybean rotation.
The next figure takes these adjustment factors into account. If corn is planted on last year’s corn acres, and corn direct costs are $11 per acre higher, the lines show the soybean price required to provide the same returns as planting corn on the corn NFA and OFA. For example, if yield losses are about 6% for planting corn-on-corn, beans would give returns as high as corn on the com NFA at bean prices of $5.80 or higher. With the same 6% yield loss from corn-on-corn, soybeans would need to be $6.80 or higher for beans to compete on corn OFA.
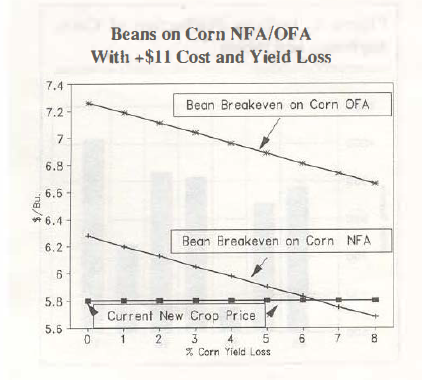
Figure 3. Beans on Corm NFA/OFA With +$11 Cost and Yield Loss
In 1991, Indiana farmers flexed 193,000 acres of beans onto com NFA and OFA. This year, there is less incentive to do so. However, if farmers consider the consequences of com-on-corn, and if the new crop bean price rallies somewhat in relation to new crop corn, it may still provide superior returns.
Key Questions on Wheat Base
- Should I Participate or Not? New crop wheat prices need to be around$3.80 before staying out of the program provides superior returns compared to being in the program. For those expecting a higher market price than d1e U.S. average, such as those with strong basis levels near the Ohio River, the breakeven levels are closer to $4 per bushel. In a manner similar to corn, participation in the wheat program provides strong protection against the negative financial consequences of lower prices, and only moderately restricts potential financial gains if prices increase as shown in the following figure.
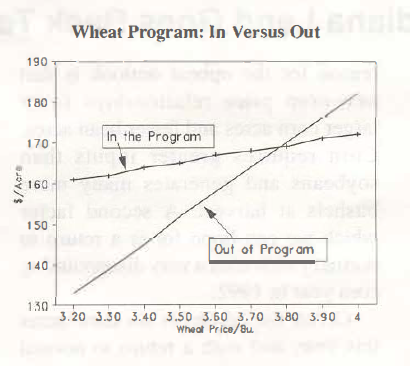
Figure 4. What Program: In Versus Out
- I Have Seeded Single Crop Wheat, But Should I Consider Either Corn or Beans on Wheat NF A/OFA?
Given the assumptions in the basic case, with wheat prices at $3.60, corn prices would need to be above $2.60 to consider tearing up wheat and seeding wheat NFA to corn. Soybean prices would need to be above $7 to consider beans on wheat NFA.
- I Have Single Crop Wheat, But Disease or Winter Kill Has Reduced Yield Potential on a Portion of It. How Much Yield Loss Should I Have Before Considering Planting the NFA or OFA to Corn? Many farms with wheat may have damage from disease or from winter kill. Potential yield losses on single crop wheat need to be surprisingly sma)l before farmers should consider tearing up the wheat and planting corn on the wheat NFA or OFA.
The corn price required to provide similar returns as staying with the wheat for various wheat yield losses are shown in the following figure. If single crop wheat yield losses are as small as 10%, com should be considered on the wheat NFA. On the OFA, farmers with potential yield losses of 20% or greater should consider corn on the wheat OFA. If the ASCS office determines the wheat OFA to be “failed acres”, the OFA will receive the wheat deficiency payments. In this case, the OFA breakeven is the same as the wheat NFA.
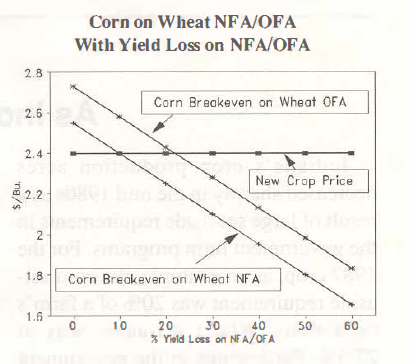
Figure 5. Corn on Wheat NFA/OFA With Yield Loss on NFA/OFA
- I Have the Same Problem as Above, But Am In the Wheat-Double Crop Beans Area. The opportunity to get a crop of beans from wheat acreage means that wheat yield losses will need to be higher before considering tearing up wheat and planting com on wheat NFA or OFA.
These yield losses need to be around 40% or greater to consider planting corn on wheat NFA, and about 60% or greater to consider planting com on wheat OFA. Again, if the Of A is determined to be “failed acres,” the OFA breakeven is the same as the wheat NFA. This is shown in the following figure.
Your Best 1992 Program Decisions
The major questions farmers should ask this year on their corn base involve the questions of whether to participate and whether to flex soybeans onto corn NFA. Our evaluation suggests that participation in the government corn program will be down moderately this year, and that fewer acres of beans will be flexed on corn NF A.
Reports from around the state suggest much concern about disease or winter kill in wheat. Farmers with damaged wheat will need to examine the potential for lost yield, and evaluate the economic prospects of flexing corn or soybeans onto their wheat NFA, or even OFA, if yield losses are severe. Wheat producers also need to work with their ASCS office regarding the provisions for “failed acres” if wheat losses are apparent.
New crop prices are more volatile this year than last year. Both the level and the relative prices of corn, soybeans, and wheat are important in making 1992 program decisions.
More than in any recent year, farmers will need to keep these relative price levels in mind as they make planting decisions, remembering that planting intentions given to the ASCS at sign-up time do not have to be followed. For this reason, it is important to keep some flexibility in mind as spring approaches.
Your agricultural agent at the Purdue University Cooperative Extension Service office has worksheets to help evaluate your basic corn and soybean program decisions. In addition, a computerized economic evaluation using your farm’s input data is available to help evaluate important program decisions, including relative price levels required to plant alternative crops on com or wheat flex acres. Please use these free Purdue services to make your best program decisions for 1992.
A Billion Bushel Year as Indiana Land Goes Back to Work
Indiana’s crop production acres decreased sharply in the mid I 980s as a result of large set-aside requirements in the government farm programs. For the 1987 crop, as an example, the corn setaside requirement was 20% of a farm’s corn base. Wheat set-aside was at 27.5%. Participants in the government program that year put over two million of Indiana’s 12 million acres of crop base into set-aside.
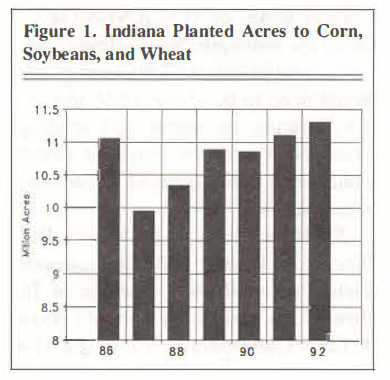
Since that time, set-asides have been decreasing with more land being returned to crop production. With the 1992 com and wheat set-aside levels at only 5%, Indiana farmers will continue to plant more acres, as shown in Figure I. Early unofficial estimates suggest that planted acres to the three primary crops of corn, soybeans, and wheat will reach about l l .3 million acres this year. The USDA will officially release Planting Intentions in late March.
At this early point in the year, input suppliers and grain elevator managers can anticipate a favorable demand for their products and services in 1992. One reason for the upbeat outlook is that new-crop price relationships favor larger com acres and fewer bean acres. Corn requires greater inputs than soybeans and generates many more bushels at harvest. A second factor which we can hope for is a return to normal yields after a very disappointing com year in 1992.
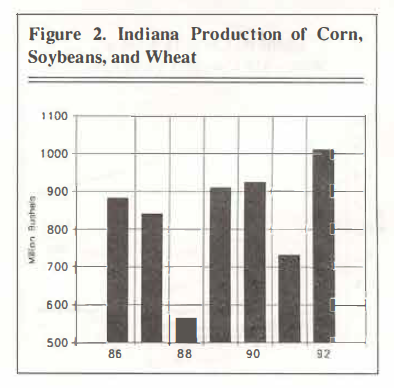
Given the emphasis on com acres this year, and with a return to normal yields, production of corn, soybeans, and wheat in Indiana could be near one billion bushels. as shown in Figure 2. This volume of production would be nearly 40% higher than last year and could exceed the previous record in 1982. Production of this magnitude would return the grain storage and grain handling industry to near full utilization.
Indiana Planted Acres to Corn, Soybeans, and Wheat
Indiana Production of Corn, Soybeans, and Wheat
![]()
![]()
![]()
![]()
![]()
