Higher Farmland Values and Cash Rents in 2013
December 23, 2012
PAER-2012-19
Craig Dobbins, Professor


Over the past several years, farmland values have been on a double-time march upward. Based on the Purdue Farmland Value Survey from June 2012, Indiana farmland values increased 67% to 75% from 2007 to 2012. This upward march has been propelled by large crop production net returns, the limited supply of farmland for sale, record low interest rates, the cash position of borrowers, and the attractiveness of farmland investments.
At the beginning of this year’s growing season, many speculated that the corn and soybean supply was beginning to catch up with demand and that prices and net returns would decline. Because of a drought across the Midwest, crop yields were sharply lower. Rather than a decline in corn and soybean prices, they went sharply higher. Compared to 2011, USDA expects 2012 net farm income to decline by 6.5%, but will still be the second highest.
The forces that pushed farmland values to levels that were unthinkable five years ago are still in place. Budget estimates for 2013 indicate there are possibilities for strong net returns from corn and soybean production (Table 1). With help from the Federal Reserve’s quantitative easing, interest rates are expected to remain low. The drought has likely reduced the liquidity position of some potential buyers, but reports from farmland auctions indicate buyers are still in financially strong positions. The demand for farmland continues to exceed the supply. If dry weather continues to linger, buyers may become more cautious, but at this time farmland values are expected to continue to march upward.
For 2013, an increase of 10% to 20% in farmland values is a possibility. This is an increase similar to the last several years. Longer term the demand increases for corn and soybeans are expected to slow and supplies are expected to catch up, causing corn and soybeans prices to decline. The speed at which this adjustment takes place will determine if the increase in farmland simply slows down or whether there will be a downward correction.
The factors influencing farmland values are also influencing cash rents. Using the 2013 Purdue Crop Cost and Return Guide, it is estimated that a corn and soybean rotation could generate a return to land of $307 (Table 1). This estimate used a corn price of $5.80 and a soybean price of $12.40. Yields for corn and soybeans were 163 and 54 bushels per acre, respectively. The Purdue Land Value Survey indicates that the estimated 2012 cash rent for farmland capable of consistently producing 163 bu. per acre corn would be $214 per acre. These estimates indicate there will be an economic profit of $93 per acre. In a competitive industry, economics stipulates that economic profits will be zero over time. While there will be many changes in expected prices and yields between now and next fall, this estimate indicates there will continue to be upward pressure on cash rents in the market.
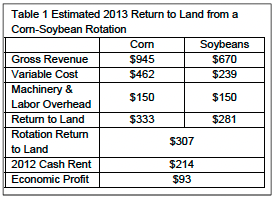
Table 1. Estimated 2013 Return to Land from a Corn-Soybean Rotation
Adjustments in cash rent will be influenced primarily by expectations about 2013 including national yields (drought concerns for the western Corn Belt and Great Plains) and new crop prices. Cash rents are expected to increase 7% to 11%, a bit less than the 12% to 15% increase from the previous year. The amount of change will vary with the situation. For cash rents that have been adjusted annually, there may be less change. For cash rents associated with leases that have not had a change or several years, the adjustment could be higher.