How Accurate are USDA’s Corn and Soybean Supply and Use Estimates?
January 18, 1995
PAER-1995-05
Lee F. Schrader, Professor and Beth Brechbill, Research Assistant
![]()
![]()
![]()
![]()
![]()
Farmers often ask “Why do USDA estimates of crop supply and use often seem to favor lower prices? Others seem to believe that USDA’s estimates are biased. These are concerns which can be answered. To do so, we have analyzed estimates published by USDA’s World Agricultural Outlook Board (WAOB) covering the 11 years from the 1983/84 through the 1993/94 crop years for corn and soybeans.
WAOB estimates the supply and use of these crops each month at the time the National Agricultural Statistics Service (NASS) issues its crop reports. The cycle of 19 estimates begins in May, about planting time, and ends in November after the end of the crop year. For example, the first estimates of supply and use for the 1993 crop were issued in May of 1993 (when very little could be known about the crop) and the last was issued in November of 1994 (more than two months after the completion of the 1993/94 crop year). The crop year for corn and soybeans begins September 1 and ends August 31 of the following year.
Estimates analyzed include 19 estimates for each component of supply and use for each of the crops. While there are additional small revisions after the November report following the end of the crop year, we use that estimate as the final figure and measure deviations of the earlier estimates from the November estimate for analysis.
Measures of Accuracy
Two measures of the accuracy of these estimates are relevant; bias and overall accuracy. Bias measures whether, over a period of years, the over and underestimates cancel such that the average of the estimates is equal to the average actual values. Overall error measures how far the estimates miss the final number without regard to direction of the error.
Performance of Estimates
Generally, as you would expect, there is an improvement in the accuracy of the estimates as the sea-son progresses. For example, the average error of the May estimate of soybean production is 171 million bushels and 26 million bushels for the January estimate. Accuracy of the corn production estimate changes from an error of 958 million bushels for the May estimate to 29 million bushels for the January estimate, (Figures 1 and 2).
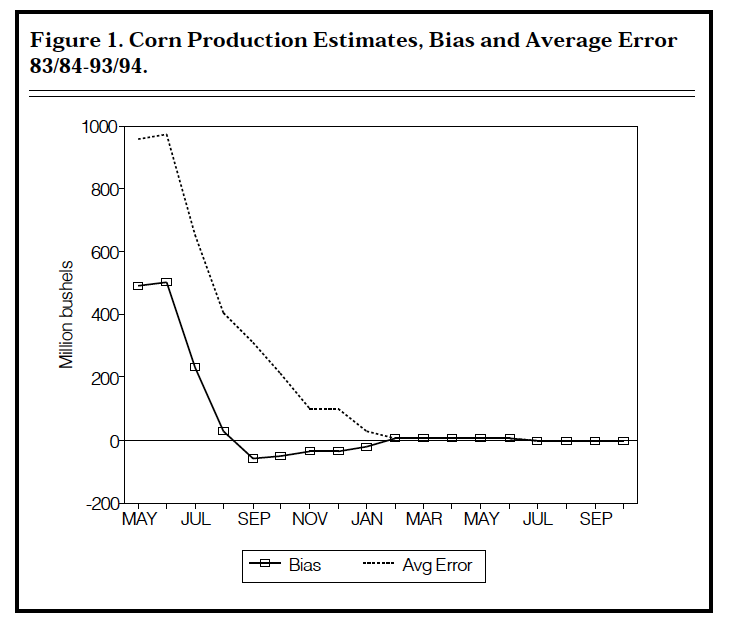
Figure 1. Corn Production Estimates, Bias and Average Error 83/84 – 93/94
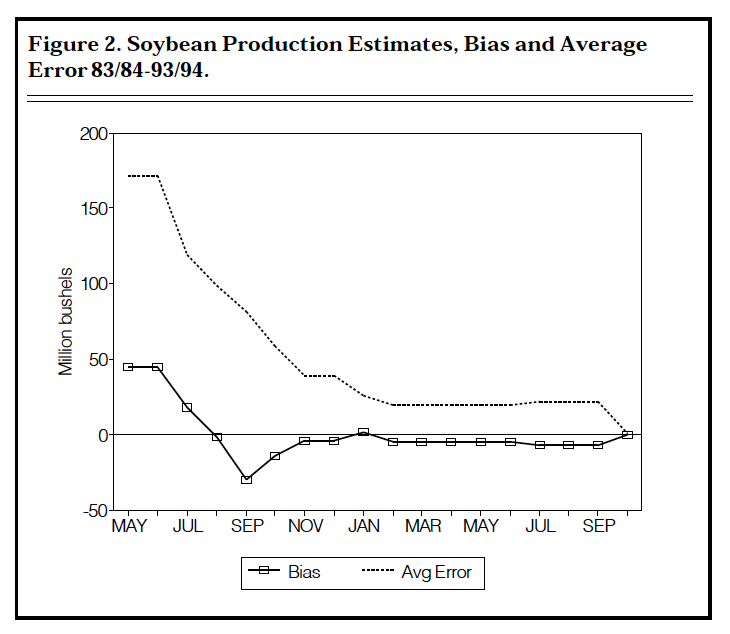
Figure 2. Soybean Production Estimates, Bias and Average Error 83/84 – 93/94
Production for both the corn and soybean crops tends to be overestimated in the May, June, and July estimates. This upward bias in production estimates in the early months is understandable. At that stage production estimates are based on projected yields given nor-mal weather. The August soybean estimate showed a very small negative bias whereas the August corn estimate appears to have a small positive bias. Subsequent estimates for both corn and soybeans tended to be on the low side or very near the final figure, (Figures 1 and 2). Estimates of total use tended to follow a pattern similar to that of the production estimates.
We looked at each category of use and carryover and make some of the following observations. Soybeans used for crushing tended to be under-estimated whereas exports have some tendency to be overestimated. Overall accuracy of the crushing estimates appears to be somewhat better than for export estimates.
There appears to be a small positive bias in estimates of total use of corn. This is because there has been a tendency to overestimate corn used for feed and for export, but a negative bias for estimated food and industrial uses of corn.
Ending stocks are regarded as being closely related to price. During the period examined, soybean ending stocks had a bias to be overestimated by a small amount whereas corn ending stocks were biased toward overestimation in the early months, but tended to show a negative bias later in the season. With the exception of the earliest months in the estimate cycle, there was a tendency to underestimate corn ending stocks from 20 to 75 million bushels, (Figures 3 and 4).
Errors of soybean ending stocks estimates ranged from 88 million bushels in May to 26 million bushels for the August estimate at the end of the crop year. Average corn stock errors ranged from 870 million bushels in May to 55 mil-lion bushels by the August estimate.
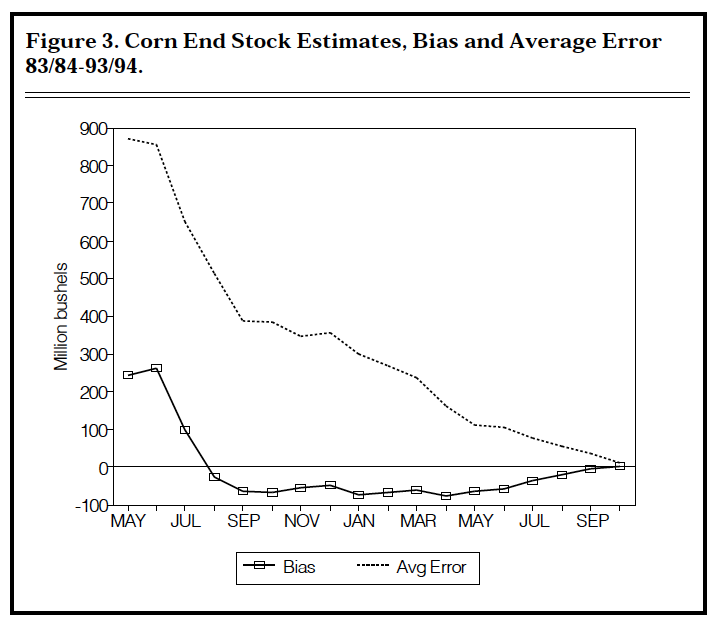
Figure 3. Corn End Stock Estimates, Bias and Average Error 83/84 – 93/94
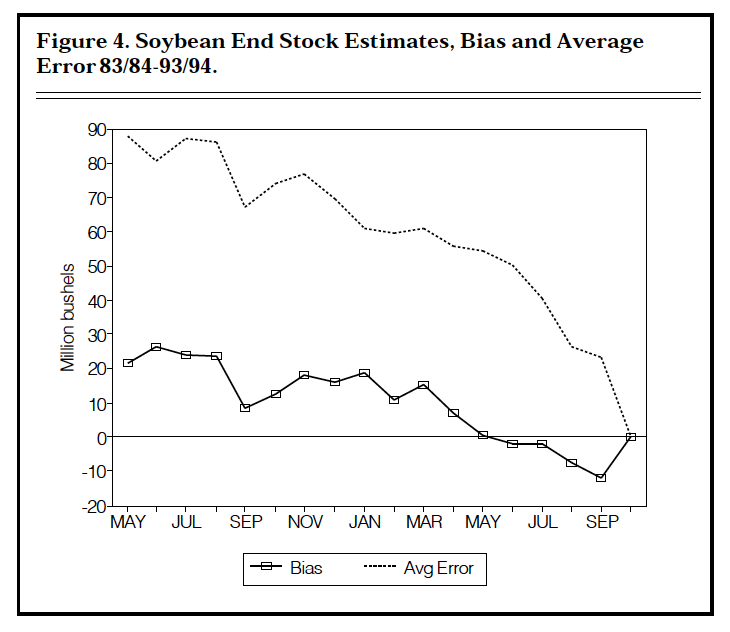
Figure 4. Soybean End Stock Estimates, Bias and Average Error 83/84 – 93/94
Little Price Bias
WAOB also provides estimates of season average price. Their price estimates are published as a range and we have, somewhat unfairly, used the midpoint of the range for analysis. There is some evidence of a low bias in early season price estimates using this criteria (Figure 5 and 6). Errors decrease as the estimate cycle proceeds reflecting, at least in part, that a shorter period remains unknown.
You will want to note how inaccurate price predictions can be at planting time. The average error of soybean prices was 61 cents per bushel in May. The May corn price estimate was, on average, off by 33 cents over those years. Price prediction errors remained relatively large even at harvest time. In October as an example they were 48 cents for soybeans and 16 cents for corn.
Comment
The reader must recognize that the results of this analysis depend to some degree on the years chosen. The years 1983, 1988 and 1993 were unusual crop years with major weather problems during the growing season. Accuracy of the estimates does increase as the season progresses. However, the early estimates are subject to large errors and this fact must be recognized by farmers and others who use this information. These errors are likely to be highly related to the uncertainty of the growing season. None the less, price forecasts made before harvest should be taken with a grain of salt.
Price estimates appear to be on the low side for both crops in the early estimates but the biases, even in those months, are not statistically significant. Soybean price estimates were on the high side for August through December. Corn price estimates were high for all months except for May and June prior to har-vest. Recall that the price estimates are issued as a range, not as a point estimate as used here. Price range estimates are often correct in the sense that the range covers the actual value.
Do these estimates favor lower prices and thus the buyer of agricultural products? Early estimates of production and ending stocks do appear to be biased on the high side which is consistent with the early price estimates being on the low side. However, by September, both corn and soybean production tend to be underestimated which one would expect to favor producer prices. Ending stocks of corn tend to be underestimated, a plus for price, whereas soybean ending stocks estimates have been on the high side. In both cases the bias, even in the early months, is not statistically significantly different from zero.
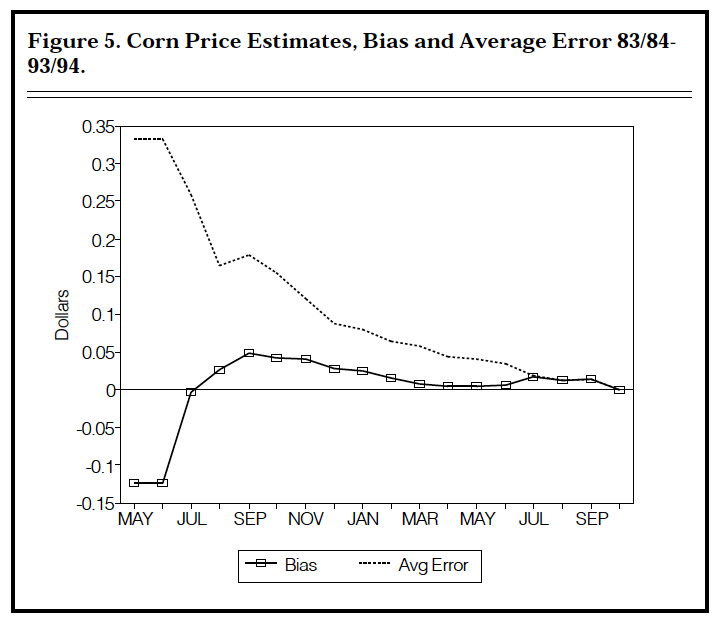
Figure 5. Corn Price Estimates, Bias and Average Error 83/84 – 93/94
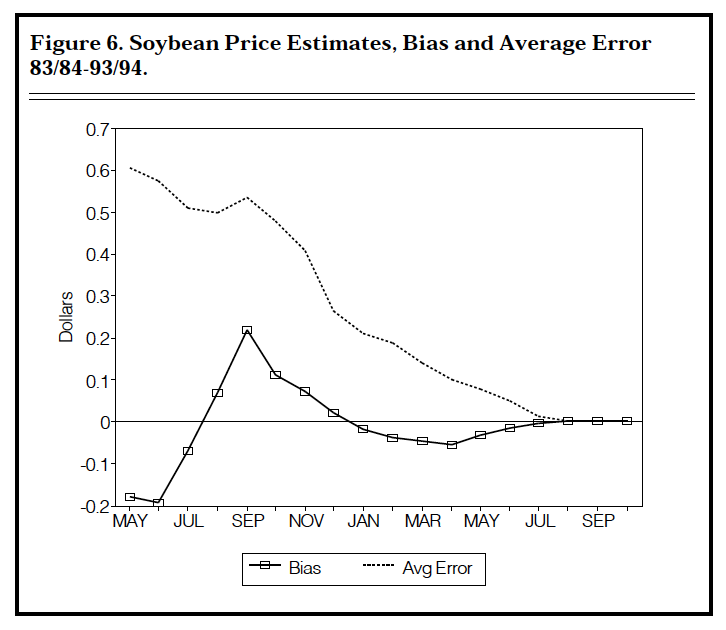
Figure 6. Soybean Price Estimates, Bias and Average Error 83/84 – 93/93
Our analysis indicates that USDA estimates of supply, use, and price are not biased toward lower prices. The very early estimates must be recognized as subject to large errors.
The availability of WAOB estimates that are generally in line with estimates of other analysts serve to level the playing field for farmers and small buyers who could not afford to do comparable analyses on their own. The advantage of large traders and large grain users would probably be greater without the WAOB analysis.
![]()
![]()
![]()
![]()
![]()
