How Producers View Risk and Consultants: 2001 Top Farmer Crop Workshop Survey Results
February 13, 2003
PAER-2003-2
George F. Patrick, Professor
![]()
![]()
![]()
![]()
![]()
Participants in the 2001 Top Farmer Crop Workshop were asked to complete a questionnaire about the sources of risk they face in their farming operation and about their responses to these risks.
Producers were asked to indicate the importance of the sources of and responses to risk on a scale of 1 (not important) to 5 (very important) and also to indicate whether they used the response to risk in their operation. Tables 1 and 2 summarize the responses of participants in the 1993, 1997, 1999, and 2001 surveys. The 2001 questionnaire also asked about producers’ expenditures on various sources of information, including a variety of consultants, and the value of this information for their management decisions. The scale of 1 to 5 was also used for producers to rate the value of information. Tables 3 and 4 summarize responses from surveys of Top Farmer Crop Work-shop participants in the 1991 and 2001 workshops.
A total of 39 responses were obtained in 2001. The average respondent was 48.1 years of age, had completed 15.5 years of education, and had 2,283 acres of cropland (24.7% owned, 26.9% share leased, 39.9% cash rented, and 5.8% custom farmed). All of the respondents had gross farm income of over $100,000, less than half produced any specialty crops under contract, and less than 10% were debt-free. The age and educational level of respondents to earlier surveys were similar to the 2001 levels, but the average farm had only 1,820 acres in 1991.
Risk and Risk Responses
In 2001, the most important source of risk for respondents was changes in the government commodity program, at 4.38. This was much higher than the 3.20 this source rated in 1997. Crop price variability (4.31) and crop yield variability (4.08), traditionally the most highly rated sources of risk, continued to rank near the top, although the rating for crop price variability was significantly lower than in 1997 and 1999. Because of the variation in producers’ opinions (the larger numbers in the standard deviation columns indicate greater variation in opinions), many of the changes in Table 1 are not statistically significant. For example, input costs (4.13) moved up between 1999 and 2001, while rents (3.71) and costs of capital items (3.66) both dropped in their ratings, but the changes are not statistically significant.
Participation in the government commodity program (4.50) was the highest rated response to risk in 2001, much higher than the 3.49 this response rated in 1997, although the percentage of producers actually participating was similar. Being a low-cost producer, maintaining financial/credit reserves, and using production practices that work under a variety of conditions were responses to risk that all declined significantly in importance (Table 2). There were also declines in the percentages of producers who practiced these responses. In some instances, producers indicated that they were unable to practice a response because of economic conditions. Forward contracting continued to be the highest rated marketing response, although the percentage of producers forward contracting in 1999 and 2001 was lower than in earlier surveys (Table 2), perhaps because of lower prices being offered by the market.
Some responses to risk, such as off-farm employment and producing some specialty crops under contract, have large standard deviations.
This indicates more diversity in producers’ ratings than smaller standard deviations.
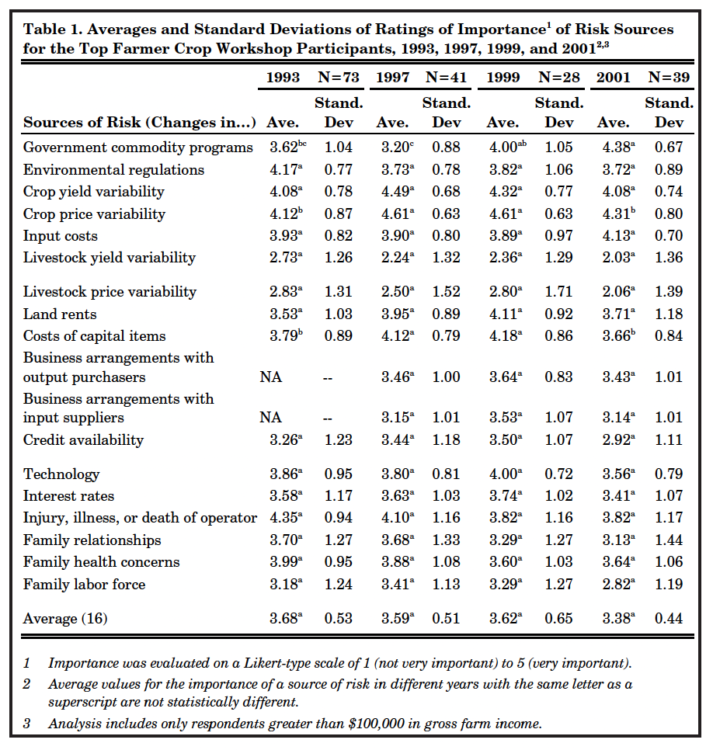
Table 1. Averages and Standard Deviations of Ratings of Importance of Risk Sources for the Top Farmer Crop Workshop Participants, 1993, 1997, 1999, and 2001
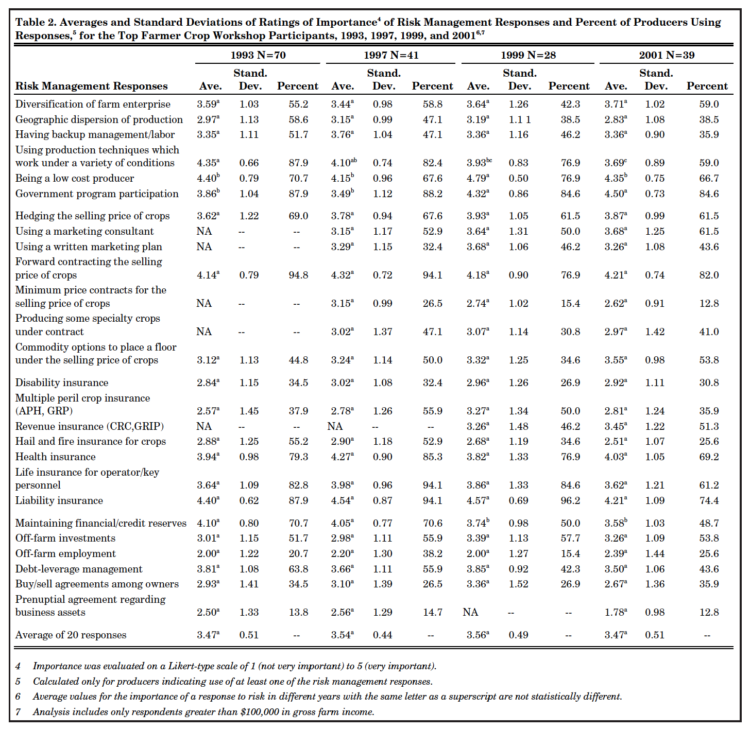
Table 2. Averages and Standard Deviations of Ratings of Importance of Risk Management Responses and Percent of Producers Using Responses, for the Top Farmer Crop Workshop Participants, 1993, 1997, 1999, and 2001
Sources of Information
In general, the value of sources of information for management decisions declined from 1991 to 2001 (Table 3). The rating of county educators and university specialists as a source of information declined, while the rating assigned to sales and support personnel was sharply higher. Producers considered their own records and consultants, especially in the tax and accounting area, as having the greatest value for management decisions in both 1991 and 2001. Almost all of the respondents, 37 of 38 completing that part of the questionnaire, hired consult-ants. The average 2001 expenditure on consultants was $6,204. This was up sharply from 1991, in contrast to the expenditures on more general sources of information in the upper part of Table 3. Excluding the costs of recordkeeping, expenditures on information increased from about $1.19 per crop acre in 1991 (about
$1.55 in 2001 dollars) to $3.96 per crop acre in 2001. The most common consultants were in tax preparation, marketing advice, and crop fertility areas (Table 4).
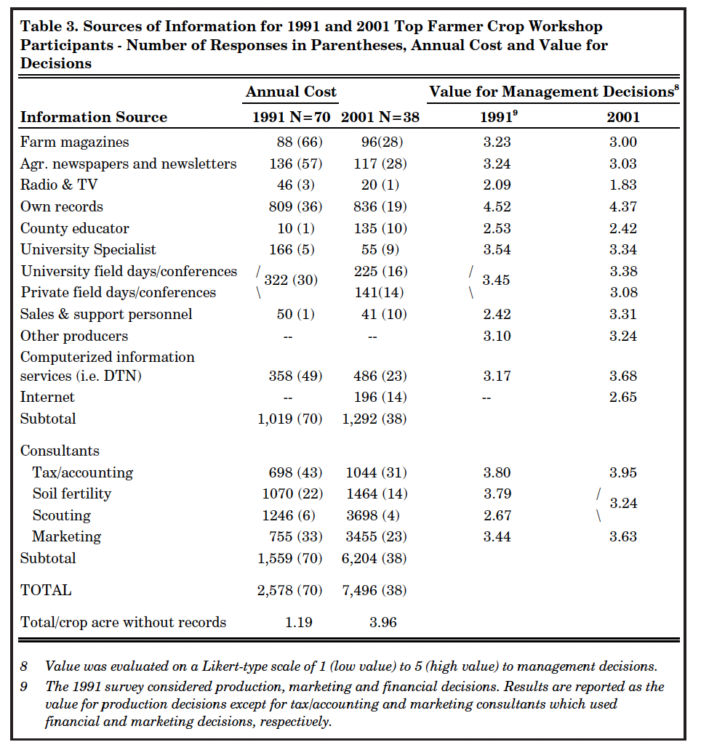
Table 3. Sources of Information for 1991 and 2001 Top Farmer Crop Workshop Participants – Number of Responses in Parentheses, Annual Cost and Value for Decisions
Role of Consultants
Producers were also asked to indicate the primary role of consultants in the business. Are they a complement or a substitute for management skills of the operator? Is it a cost consideration or concern for liability? Most production-and marketing-related consultants were considered as complementary to the producers’ management skills. The majority of respondents also considered financial and legal consultants as complementary, but protection from legal liability was also mentioned as a reason for using consultants. Producers did not generally indicate lower costs as a reason for using consultants.
Participants in the Top Farmer Crop Workshops are not a statistically representative sample of farmers in the eastern Corn Belt. Most participants are full-time, commercial farmers, and their farm operations may involve multiple operators. However, to the extent that these producers have characteristics that will be typical of commercial producers in the future, their views and behavior provide useful information both to other producers and to those serving the agricultural sector.
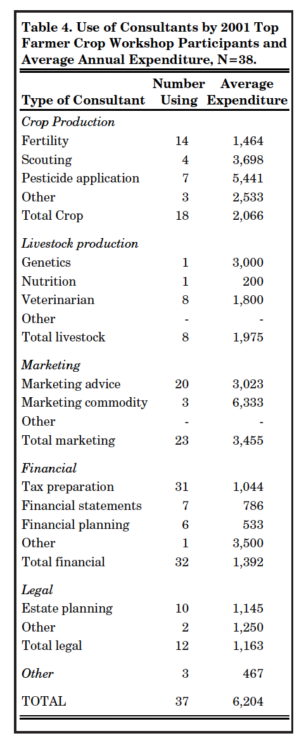
Table 4. Use of Consultants by 2001 Top Farmer Crop Workshop Participants and Average Annual Expenditure, N=38.
![]()
![]()
![]()
![]()
![]()
