Immigrants in Indiana: Where They Live, Who They Are, and What They Do
February 18, 2009
PAER-2009-2
Uris Baldos, Graduate Student, Tani Lee, Graduate Student, Delphine Simon, Graduate Student and Brigitte Waldorf, Professor
![]()
![]()
![]()
![]()
![]()
Just a couple of decades ago, immigration was not on the radar screen in Indiana. Compared to the rest of the nation − and especially compared to the so‑called gateway states with their large immigrant concentrations such as in New York, Los Angeles, Miami, and Chicago – immigrants in Indiana have always been under-represented. More recently, however, Indiana’s immigrant population has steadily increased (Figure 1).
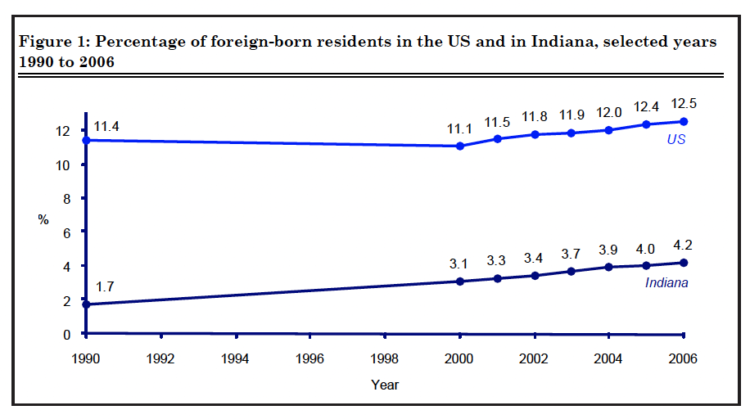
Figure 1: Percentage of foreign-born residents in the US and in Indiana, selected years 1990 to 2006
In 1990, Indiana’s population included 94,263 immigrants, accounting for less than two percent (1.7%) of the total population. Ten years later, the number of immigrants had almost doubled to 186,534, making up three percent (3.1%) of all Indiana residents. The more recent figures (2006) of the US Census Bureau suggest a further increase to 263,607 immigrants or 4.2% of Indiana’s population. Moreover, compared to 1990, the characteristics of Indiana’s immigrant population have changed substantially.
This report provides a profile of Indiana’s growing immigrant population. Where in Indiana do immigrants settle? What are the characteristics of the newcomers? What kind of jobs do they have? This research is based on data from the 1990 and 2000 US Census and the 2006 American Community Survey.
Not Every County Gets its Fair Share of Newcomers
The enormous growth of Indiana’s immigrant population is unevenly distributed across Indiana’s 92 counties. Almost three quarters of the growth is concentrated in just ten counties. Table 1 shows the ten counties with the largest net increase of immigrants between 1990 and 2000.* Marion County tops the list with a net gain of 24,095 immigrants during the 10‑year period. Interestingly, although immigrants in Marion County only made up 1.9% of the total population in 1990, they contributed 38% to the county’s total population growth. Tippecanoe and Marion counties, home to Purdue and Indiana University, respectively, already had a diverse population in 1990 and, by 2000, Tippecanoe County strengthened its position as the top county with the most diverse population in Indiana. Among the counties listed in Table 1, Elkhart County stands out because it almost quadrupled its immigrant population. In fact, by 2000 Elkhart’s percentage of immigrants surpassed Monroe County. Lake County is exceptional because immigrants made up almost three‑quarters of its total population growth. Finally, it is interesting to note that only two counties in the top‑ten list − Monroe and Bartholomew – are located South of Indianapolis.
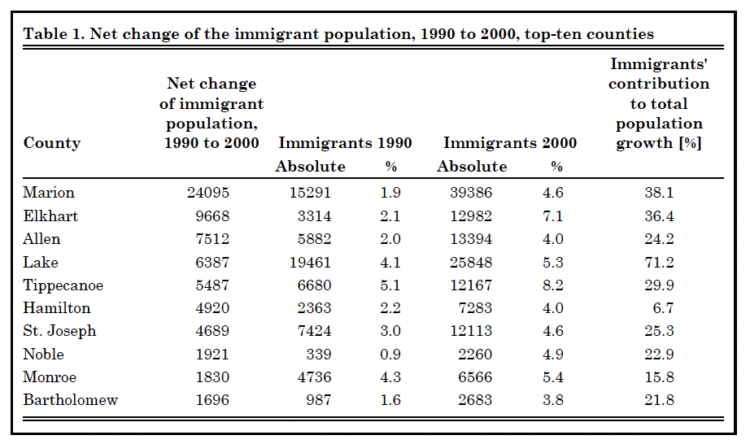
Table 1. Net change of the immigrant population, 1990 to 2000, top-ten counties
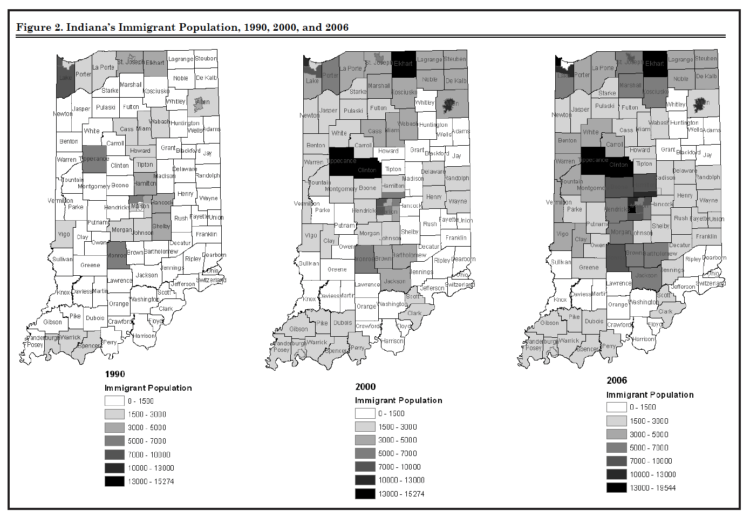
Figure 2. Indiana’s Immigrant Population, 1990, 2000, and 2006
Figure 2 shows the distribution of immigrants across Indiana in 1990, 2000, and 2006.** The most remarkable features are the concentration of immigrants in urban areas, their gradual spread into non‑urban areas, and their increasing presence in the southern portions of the state.
In fact, in some nonmetropolitan counties (Table 2) the influx of immigrants dampened the loss of the native‑born population. The situation is most extreme in Wayne County at the Indiana‑Ohio border. Wayne County had a net loss of 1,490 of its native‑born residents. A net gain of 636 foreign‑born residents could compensate for 43% of the loss so that the overall population was only reduced by 854 persons.
Rising Numbers of Immigrants from Mexico and Asia
Up until the mid‑1960s, US immigration policies favored immigration from European countries. The Hart‑Cellar Act of 1965 made US immigration more accessible to persons from non‑European countries. Ever since then, the influx of immigrants originating from Latin America, the Caribbean, and Asia grew. At first, immigrants from these new origins mainly settled in the traditional immigrant‑receiving states along the East and West coasts. However, more recently immigrants from non‑European countries also settled elsewhere, including in the Midwestern states.
What happened in Indiana is in line with these nationwide developments. Two decades ago, immigrants of European descent accounted for the largest share of Indiana’s immigrant population. Today, their share has been dwarfed as the number of immigrants from Latin America and Asia have rapidly increased. The number of immigrants from Mexico grew more than ten‑fold, from less than 10,000 in 1990 to over 100,000 in 2006. Mexicans now make up almost half of all immigrants in Indiana (46% in 2006). Although the Asian population had a less dramatic expansion, Asian immigrants more than doubled and now constitute over 30% of Indiana’s immigrant population. Figure 3 shows the differential growth of immigrants by place‑of‑birth. Every group increased in size between 1990 and 2006, but the rapid increase of immigrants from Mexico and Asia constitutes a major shift in the composition of Indiana’s immigrant population.
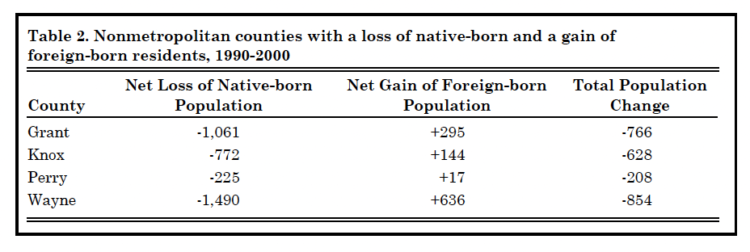
Table 2. Nonmetropolitan counties with a loss of native born and a gain of foreign-born residents, 1990-2000
The Immigrant Population Is Young
People who choose to move to a new place typically do so when they are young. This is particularly the case when the move involves crossing an international border. International moves require much more than transporting one’s belongings from place to place, finding new employment and housing at the destination. International migrants also need to deal with visa issues, adjust to a different culture and, very often, learn a new language. It is a huge investment involving both monetary and psychological costs. The possible returns on such an investment are much higher for young people than for older persons. Thus, it is not surprising that the vast majority of Indiana’s immigrants are of working‑age, and that the recent growth of the immigrant population involves primarily young people between the ages 20 to 40. As such, immigrants are an asset for Indiana by rejuvenating the State’s aging labor force.
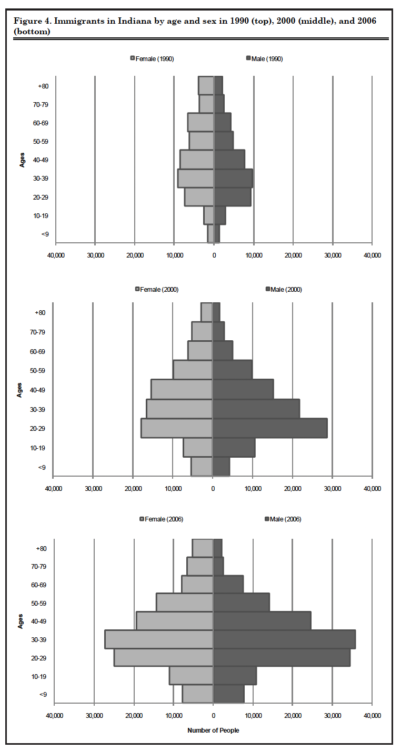
Figure 4. Immigrants in Indiana by age and sex in 1990 (top), 2000 (middle), and 2006 (bottom)
Figure 4 shows population pyramids of Indiana’s immigrant population in 1990, 2000 and 2006. The pyramids are a break‑down of the population by age and sex. The bars represent the number of immigrants in each 10‑year age cohort shown on the vertical axis. The bars extending to the right represent the number of male immigrants and the bars extending to the left represent the number of female immigrants. The pyramids show that: Over time, the number of immigrants at all ages increased. The increase is highest for the working age cohorts (20 to 60).
- Among the working age cohorts, men outnumber women.
- The share of children and the share of the elderly are very small compared to the share of working‑age immigrants.
- The last issue is particularly important. For example, the percentage of school‑aged children in Indiana’s immigrant population is exceptionally low with only 11% compared to over 25% among Indiana’s nonimmigrant population. This unusual age composition suggests a beneficial role of immigrants because the working‑age population – compared to children and elderly – draws substantially less on services and resources in the form of education, social security, and Medicare.
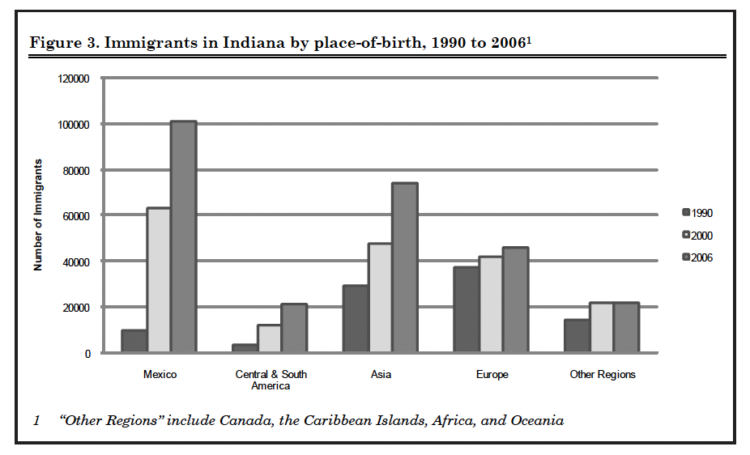
Figure 3. Immigrants in Indiana by place-of-birth, 1990-2006
Half of Indiana’s Immigrant Population Migrated to the U.S. Within the past 10 Years
As immigrants settle in a foreign country, they learn about and adjust to the new culture, norms and values of the host society. In general, the most recent immigrants are the ones who need a good deal of assistance. The federal government only regulates who may enter the country, under what conditions and for how long immigrants may stay. But there is no federal policy that addresses the integration of immigrants once they are in the US. Thus, immigrants are by and large on their own and receive assistance from their own immigrant community as well as from individuals, groups, and civic organizations dedicated to serving the immigrant community.

Figure 4. Immigrants in Indiana by age and sex in 1990 (top), 2000 (middle), and 2006 (bottom)
The recent growth of the immigrant population suggests a growing demand for such assistance in Indiana. In 1990, almost half of Indiana’s immigrants had lived in America for more than 20 years. It is safe to assume, that they were well established and no longer needed assimilation aid. More recently, however, long‑term immigrants no longer make up the largest group. In fact, according to the 2006 data from the American Community Survey, almost 45% of Indiana’s immigrant population has lived in the US for five or fewer years (see Figure 5).
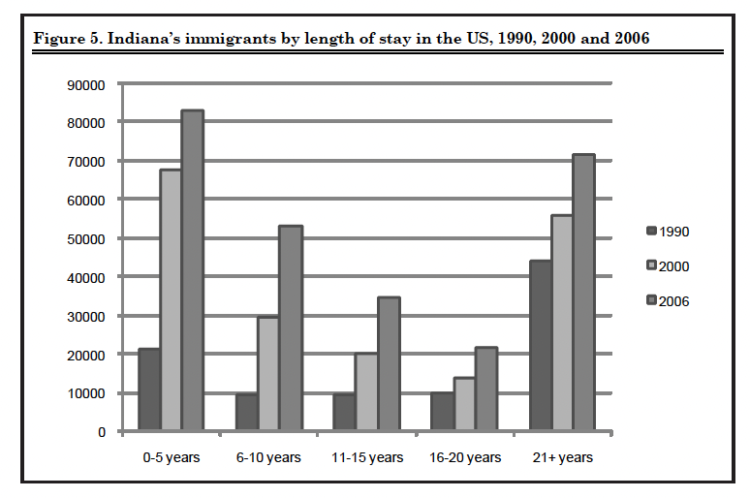
Figure 5. Indiana’s immigrants by length of stay in the US, 1990, 2000 and 2006
English Proficiency Has Been Declining among Immigrants from 1990 to 2006
Many of Indiana’s newcomers did not originally come from an English‑speaking country. Thus, in order to communicate, to perform certain basic tasks (driving, for example, or reading the newspapers), and to improve employment opportunities, immigrants often invest in learning English. In 1990, when most immigrants living in Indiana had been in the US for many years already and when a good deal of them originated in English‑speaking countries (e.g., Canada, Ireland, UK), the share of those immigrants who did not speak English very well was quite small, slightly over 10% (see Figure 6). That has changed quite dramatically in recent years. Today, many immigrants entered the US only recently, and about one third of Indiana’s immigrants do not speak English well or do not speak English at all. Language acquisition is just one step of a successful integration into the US, but many see it as the most essential step. The large share of Indiana’s immigrants who are not fluent in English suggests a growing need for instruction in English as a second language.
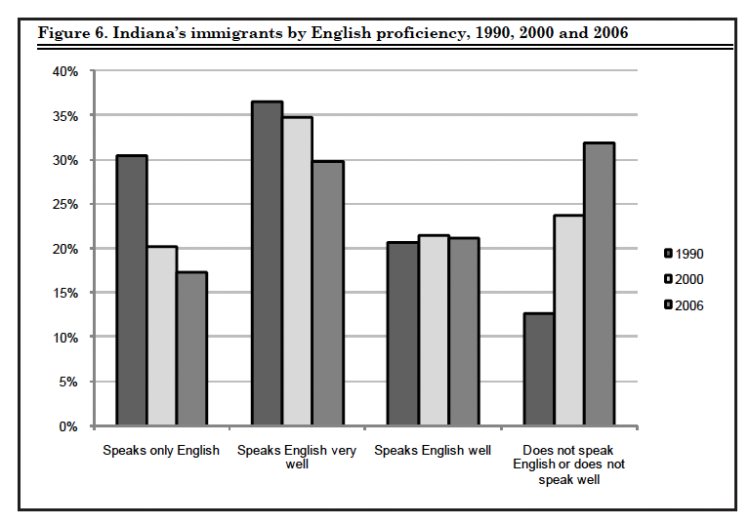
Figure 6. Indiana’s immigrants by English proficiency, 1990, 2000 and 2006
Naturalization: Becoming a US Citizen
The integration of immigrants is formally completed when they become US citizens. There are certain requirements attached to becoming a US citizen, most notably a minimum length of residence in the US and passing a test of English, US civics and history. In Indiana, only about one‑third of the immigrants are US citizens. Figure 7 shows that the pool of non‑citizens has increased drastically since 1990 and, as of 2006, included about 200,000 immigrants. Clearly, many of Indiana’s immigrants do not yet meet the minimum length of residency requirement.
Immigrants’ Human Capital
Immigrants’ human capital is of particular importance for the impact of immigration on local economies. Compared to the nonimmigrant population of Indiana, migrants from abroad have a larger share of persons without a high school degree (32.2% vs. 13.9% in 2006). But, as shown at the bottom of Table 3, Indiana’s immigrants also have a larger share of persons with a graduate or professional degree than the nonimmigrant population (28.4% vs. 21.3% in 2006). This unusual distribution can be attributed to US immigration policies that provide for special visas for highly‑skilled, temporary workers, the H‑1B nonimmigrant visas. At the local level, however, the immigrant composition by educational level can be quite different. In some northern counties (Lake, LaPorte, Elkhart) that specialize in manufacturing, the poorly educated are over‑represented whereas the share of highly educated immigrants is exceptionally low. In contrast, in counties specializing in knowledge, such as Monroe and Tippecanoe counties, the share of highly educated immigrants is remarkably high, exceeding 60% in Tippecanoe County and exceeding 70% in Monroe County. Other counties in which more than 50% of the immigrants have a bachelor’s, graduate or professional degree include Bartholomew, Delaware, Grant, Hamilton, Hendricks, Morgan and Vigo counties.
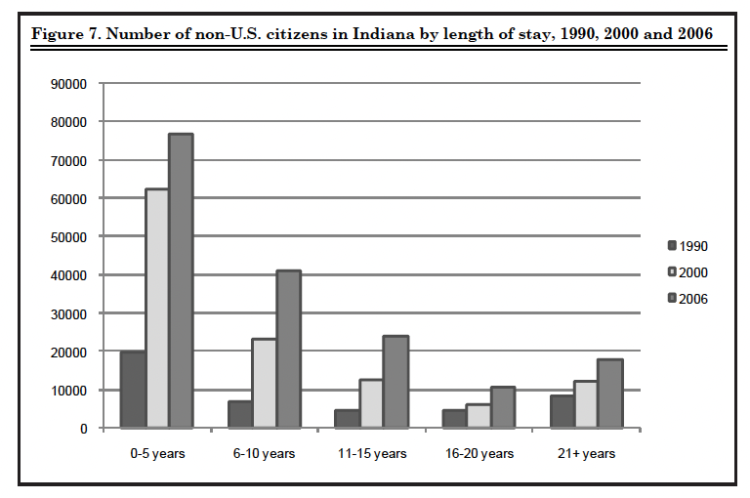
Figure 7. Number of non-U.S. citizens in Indiana by length of stay, 1990, 2000 and 2006
The Majority of Indiana’s Immigrants Work in Manufacturing
Many immigrants move into rural counties where they work in agriculture or in meat processing plants. For example, in Daviess County there is a large immigrant community working for the Perdue Farms, Inc. turkey processing plant. Given that Daviess County is small in size, the immigrants are very visible. But they certainly do not represent the vast majority of immigrants in Indiana. In fact, most immigrants in Indiana work in industries connected to manufacturing as well as in the professional and related services sector (Table 4). In 2006, around three out of ten immigrants were employed in the manufacturing sector and most of them work in industries related to motor vehicles and equipment as well as metal processing. From 1990 to 2006, the percentage of immigrants employed in the motor vehicles and equipment industries grew from 3% to 7%. On the other hand, roughly two out of ten immigrants work in the professional and related services sector in 2006. This sector generally includes colleges and universities as well as hospitals. However, from 1990 to 2006, the percentage of immigrants working in colleges and universities has dropped from 11% to 6%. In addition to these sectors, the retail trade sector – mainly eating and drinking establishments – has also been a major employer of immigrants during 1990 to 2006. Only a few immigrants find work in construction and agricultural sectors. Within the agricultural sector, immigrants are typically employed in the crop and livestock sectors.
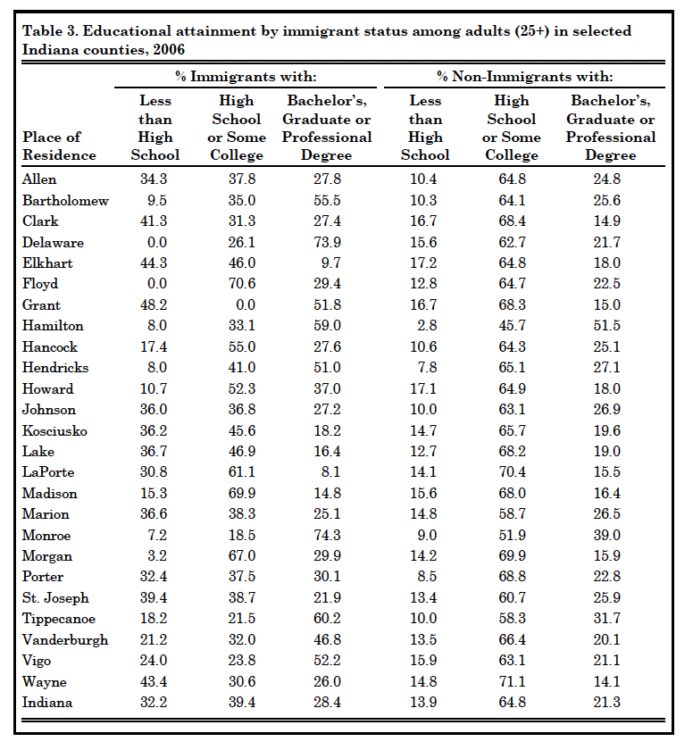
Table 3. Educational attainment by immigrant status among adults (25+) in selected Indiana counties, 2006
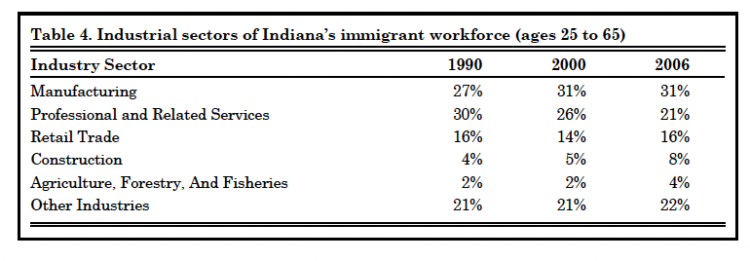
Table 4. Industrial sectors of Indiana’s immigrant workforce (ages 25 to 65)
The Diverse Occupations of Indiana’s Immigrants
In 2006, roughly five out of 20 immigrants in Indiana were employed as operators, fabricators or laborers (Table 5). Occupations under this category typically include machine operators and packers in the manufacturing sector. From 1990 to 2006, the percentage of immigrants working as operators, fabricators or laborers has increased. On the other hand, five out of 20 immigrants were employed in managerial or professional positions in 2006 and most of these positions are teaching and managerial positions. How‑ ever, the percentage of immigrants employed in these positions has been declining. For example, the percentage of immigrants who are employed as instructors and teachers has declined from 10% to 6% from 1990 to 2006.The percentage of immigrants employed in the services sector has been steady and most of them work in food preparation and services occupations.
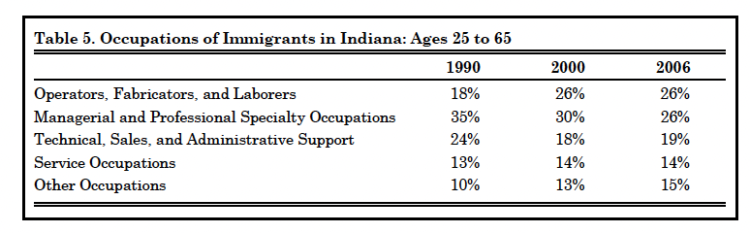
Table 5. Occupations of Immigrants in Indiana: Ages 25 to 65
Implications
The immigrant population is increasingly important for the State of Indiana where some rural communities struggle with the outmigration of the younger population, leaving the aging baby boomers behind. Immigrants can compensate for the losses and rejuvenate the community. In fact, immigrants and their children can contribute to healthy communities, increase the productivity and ensure continued demand for goods, education and health services.
This report has shown that Indiana’s immigrant population is quite diverse and “the” immigrant most certainly does not exist. There are, however, a few trends that should be noted by policy makers and planners at the state and local levels. First, the immigrant population has been growing in absolute size and as a percentage of the total population. Second, the immigrant population has become more diverse with immigrants from Mexico and various Asian countries increasing at a faster rate than, for example, immigrants from Europe and Canada. Third, many newcomers entered the country only recently and are not as established as those who came decades ago. Increasing the number of English‑as‑a‑second‑language classes seems a worthwhile investment as many of the newcomers are not yet proficient in the English language. Speaking and understanding English is the key to immigrants’ upward mobility. It also enhances immigrants’ integration into the US civic context and provides opportunities for multi‑cultural activities. As such, local and state initiatives that help immigrants’ assimilation and integration also foster the social coherence of local communities. This is particularly important in small communities where a sudden influx of immigrants can lead to misunderstandings, tensions, prejudice, and even discrimination.
* The US Census Bureau has not provided detailed data for small counties since 2000. Therefore, the county rankings only consider changes between 1990 and 2000.
** The maps are based on so‑called PUMAs, the spatial reference used by the US Census Bureau. PUMAs are portions of counties (as in Marion County), or groups of counties that have at least 100,000 residents. The county names are shown to provide a better orientation.
*** Typically, an immigrant is eligible to apply for citizenship five years after being granted permanent residency, i.e., five years after obtaining a “green card”.
![]()
![]()
![]()
![]()
![]()
