Impact of Depopulation, Changing Customer Preferences and Increased Banking Regulations on Agricultural Banks
February 15, 2017
PAER-2017-02
ELIZABETH A. YEAGER, ASSISTANT PROFESSOR OF AGRICULTURAL ECONOMICS, KANSAS STATE UNIVERSITY AND FREDDIE L. BARNARD, PROFESSOR OF AGRICULTURAL ECONOMICS
![]()
![]()
![]()
![]()
![]()
Rural banks have been under a lot of pressures. As a new administration comes into power, with a mandate from voters to review the need for increased government regulations, information will be needed on the impact of recently enacted regulations. One of those laws that has had a profound impact on community banks is Dodd- Frank. This article will report on the impact of that law, as well as the impact of declining population in many rural counties and changing customer preferences on agricultural banks.
Imagine a local community, or even an entire county, without a full-service bank or even a bank branch. Although such a situation might be difficult for many rural residents to imagine, it is a distinct possibility. In fact, that possibility has already become a reality in some counties in rural America. Approximately forty percent of low- population, completely rural counties in the United States do not have a bank branch located in the county (Ellinger, 2012).
In addition, social changes are occurring that have resulted in an increasing number of bank products and services being preferred, and even demanded, via mobile devices or online. The implication is an increasing number of future transactions will likely occur outside a brick and mortar bank facility. The economic reality is that keeping a bank, or bank branch, open in a rural county with a stagnant or declining population has become increasingly difficult to justify (Barnard and Yeager, 2013).
The increased regulatory burden placed on commercial banks resulting from Dodd-Frank legislation has increased operating costs (Dodd-Frank Progress Report, Various Dates). These additional costs are particularly burdensome for smaller banks that do not have increasing deposit volume over which to spread those additional fixed costs.
This article discusses the number of agricultural banks in rural counties with a declining or stagnant population located in the top 20 agricultural producing states.
Agricultural banks with less than $250 million in total assets are analyzed, since they are most vulnerable to the adverse effects resulting from depopulation, changing consumer preferences, and the higher costs associated with increased regulatory requirements.
Background
Historically, many of the depository and lending needs in rural communities have been satisfied by locally-owned, full-service community banks or savings institutions, a branch of a larger bank headquartered in an urban area, or both. However, a full-service, brick and mortar facility brings with it fixed costs (i.e., depreciation on buildings, real estate taxes, equipment, salaries, etc.) that need to be spread over a large volume of business to be cost- effective and profitable.
Rural depopulation and its implications on delivering financial services was addressed in a 2014 study that came to the conclusion “…despite the adverse effects of depopulation, rural community banks have tended to perform well, but achieving growth remains a challenge” (Anderlik and Cofer, 2014). Depopulation in rural counties has an obvious negative impact on maintaining a bank in a local community, but what may be more pressing are the social changes underway.
Younger customers prefer to use technology due to convenience and 24-hour accessibility. Their financial needs are satisfied by mobile or online banking and the need for a brick and mortar facility is almost nonexistent. Although more mature and affluent rural residents may desire that a community bank or the branch of a larger bank be located in their county, the numbers of those locations are decreasing and the trend is definitely toward fewer brick and mortar facilities.
A 2012 survey conducted by the Board of Governors of the Federal Reserve found many younger, technology- oriented residents can satisfy their needs for financial services through online or mobile banking technology. Ninety-five percent of individuals age 18 to 24 had a mobile phone and 49% had a smartphone, with nearly 21% of mobile phone owners using mobile banking during the past 12 months and an additional 11% planning to use it in the next 12 months (Gross, Hogarth, and Schmeiser, 2012)1.
The added costs to meet new government regulations is costly and impacts smaller banks more than larger banks. A paper published in 2013 by officials at the Federal Reserve Bank of Minneapolis projected that 6.5% of community banks with total assets less than $100 million would be unprofitable if one additional full-time person was added to meet new regulations at an assumed annual compensation of $70,000. For bigger community banks between $100 and $250 million in total assets, 1.9% of these would become unprofitable when two FTEs were added to meet regulations. For community banks between $250-500 million and $500 million-$1 billion, only 0.7% and 0.2% would become unprofitable when adding appropriate staff to meet regulations, respectively (Feldman, Heinecke, and Schmidt, 2013).
Data
This study uses Federal Deposit Insurance Corporation (FDIC) Call Report data for agricultural banks located in the top twenty agricultural producing states. The top twenty states are determined by the value added to the U.S. economy by the agricultural sector via the production of goods and services for 2012 (Value Added to the U.S. Economy, 2014).
The 2000 and 2010 U.S. Census county data was used to identify counties with a stagnant or declining population. Those counties with declining or zero population growth were used in the study. The number and size of the agricultural banks located in those counties can be determined using the FDIC Call Report Data, with the size of banks reported in terms of total assets.
The classification system that appears to be most applicable for evaluating rural counties that depend primarily on agricultural production was used in a 2013 study conducted by Ayres, Waldorf and McKendree. The criteria used in the 2013 study is used in this analysis to determine rural counties and is provided in Table 1.
According to the FDIC, an agricultural bank is defined as a bank whose agricultural production loans plus real estate loans secured by farmland exceed 25% of its total loans and leases (FDIC Glossary). From 12/31/2002 through 12/31/2012, the number of agricultural banks in the U.S. declined by 16.9%; from 1,823 to 1,515 (FDIC Call Report Data, Various Dates).
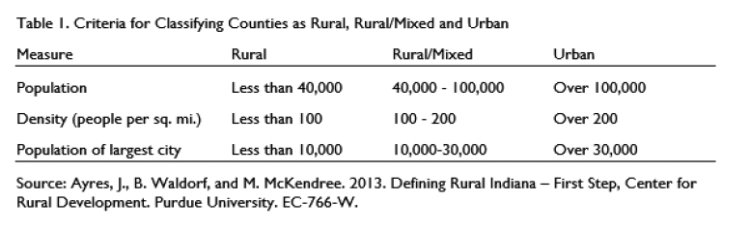
Table 1: Criteria for Classifying Counties as Rural, Rural/Mixed and Urban
Results
The top twenty agricultural states are listed in Table 2 along with the number of agricultural banks located in counties with declining population in those respective states, as of the March 31, 2014 FDIC Call Report. Of the 1,505 agricultural banks in the U.S. on that date, 1,407 (93.5%) are located in those twenty states. The five states with the most agricultural banks are Iowa, Illinois, Nebraska, Kansas and Minnesota.
The number of agricultural banks located in counties with decreasing population from 2000 to 2010 is 731, which is 52% of the agricultural banks in those twenty states. Although there is concern about the long-term financial viability of all banks located in counties with decreasing population, those that are particularly vulnerable are the smaller banks. As reported in Table 2, 648 (88.6%) of the 731 agricultural banks located in counties with declining population are smaller than $250 million in total assets.
Of the 648 agricultural banks located in counties with decreasing population and less than $250 million in total assets, 430 (66.4%) are less than $100 million and 218 (33.6%) are between $100 and $250 million in total assets. Of the 648 banks with less than $250 million in total assets, 432 (66.7%) or two-thirds are located in five states: Iowa, Illinois, Kansas, Minnesota and Nebraska,
The average size in terms of total assets for the 648 banks is $85.9 million, ranging from $63.7 million in Oklahoma to $134.3 million in Arkansas. As can be seen from Table 3, average total assets for banks less than $100 million is only $52.6 million, with average size per state ranging from $40.6 million in Minnesota to $74.9 million in Wisconsin.
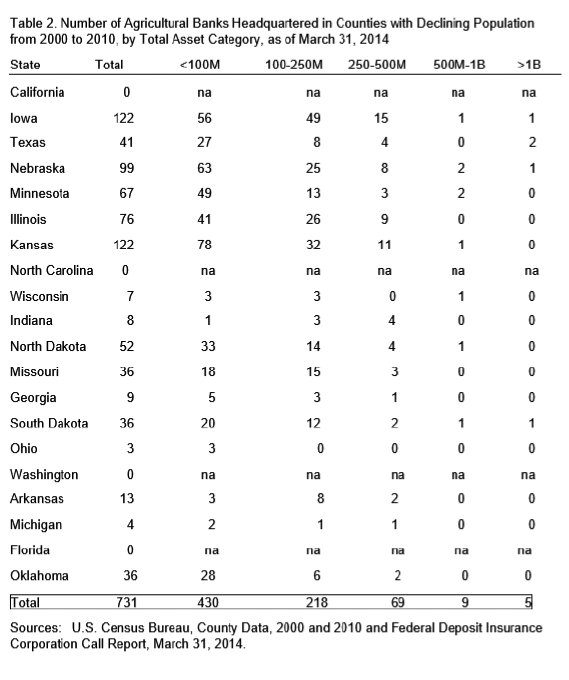
Table 2. Number of Agricultural Banks Headquartered in Counties with Declining Population from 2000 to 2010, by Total Asset Category, as of March 31, 2014
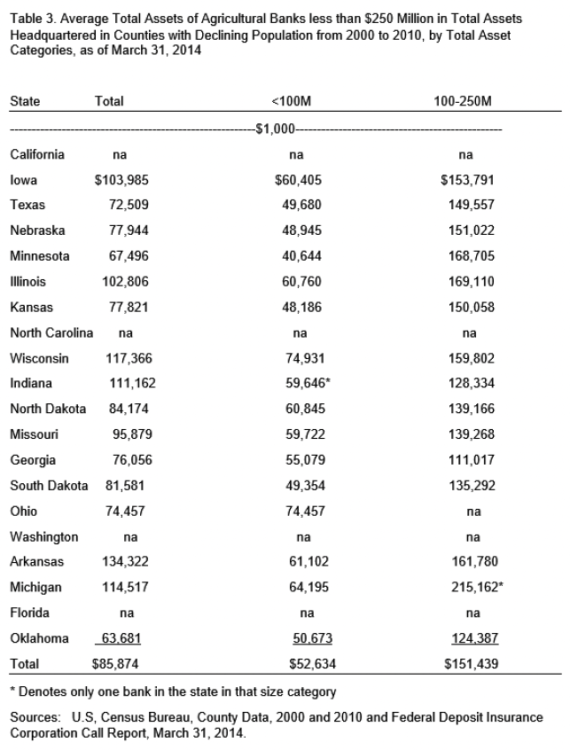
Table 3. Average total Assets of Agricultural Banks less than $250 Million in Total Assets Headquartered in Counties with Declining Population from 2000 to 2010, by Total Asset Categories, as of March 31, 2014
Impact of Additional Regulatory Costs
A study conducted by the Federal Reserve Bank of Minneapolis staff analyzed the impact on community banks of increased regulatory costs. They assumed additional costs would result from hiring additional staff to comply with increased regulations and extra audit and consulting services. They assumed compensation costs for one additional FTE would be $70,000 and would apply to all banks less than $100 million in total assets. The added compensation is subtracted from net income to determine the impact on profitability. For banks $100-250 million in total assets, it was assumed two additional employees would be hired at a total compensation of $140,000 (Feldman, Heinecke, and Schmidt, 2013).
The authors applied two tests to evaluate the impact of additional costs due to increased regulation. The first subtracted the additional costs from net income and recalculated the return on assets (ROA). The number of banks that fell below the “minimum required ROA” of the Minneapolis Federal Reserve Bank of 40 basis points (bp) before and after applying the additional regulatory costs were counted and compared. The second test also applied the additional costs of $70,000 per FTE and counted the number of banks that shifted from profitable to unprofitable to determine the impact of the additional compensation costs (Feldman, Heinecke, and Schmidt, 2013).
The same approach is used in this study using 2013 income data and balance sheet data from the December 31, 2012 and 2013 Call Reports. In the current study, the number of banks less than $250 million and below a ROA of 40 bp increased by 43 (46.2%), from 93 to 136 as a result of increased regulatory costs. Most of the increase, 39 banks or 90.7%, is for banks with less than $100 million in total assets. Only 4 of the additional banks are in the $100-250 million size category.
Also, thirty of the 633 agricultural banks with less than $100 million in total assets who experienced positive earnings during 2013 would experience negative earnings if earnings are reduced by $70,000 for regulatory compliance. Net income was reduced $140,000 for banks with $100-250 million in total assets and none of the 217 banks who experienced positive earnings in 2013 became unprofitable.
All thirty banks that became unprofitable due to increased regulatory costs are located in eight states. All of the states are located in either the Great Plains or the Corn Belt, with only Illinois located east of the Mississippi River. Again, 18 of the 30 banks (60%) are located in Kansas and Nebraska.
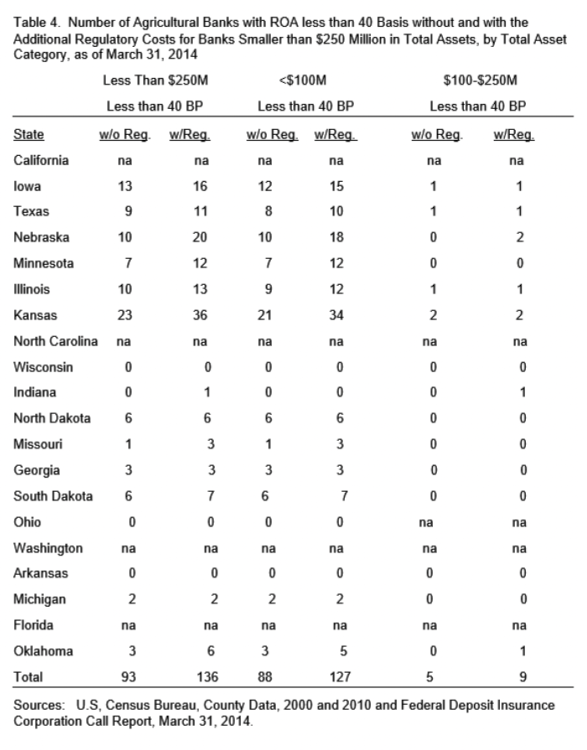
Table 4. Number of Agricultural Banks with ROA less than 40 Basis without and with the Additional Regulatory Costs for Banks Smaller than $250 Million in Total Assets, by Total Asset Category, as of March 31, 2014.
Summary
As members of the new administration assess the need for recently enacted regulations, information will be needed on the impact of those regulations. The impact of Dodd-Frank was discussed in this article, along with the impact of a declining population in many rural counties and changing customer desires and preferences on agricultural banks. The ability of agricultural banks in rural counties with declining populations to address the challenges that lie ahead will determine which banks survive those challenges. The key findings from this study are listed below.
Of the 1,505 agricultural banks on March 31, 2014, 1,407 (93.5%) are located in the top 20 agricultural producing states;
Of the 1,407 agricultural banks in the top 20 agricultural producing states, 731 (52%) are located in counties in which the population decreased from 2000 to 2010;
Of those 731 agricultural banks in counties with declining population, 648 (88.6%) are smaller than $250 million in total assets;
The average size in terms of total assets for those 648 banks is $85.9 million, ranging from $63.7 million in Oklahoma to $134.3 million in Arkansas;
Average total assets for banks less than $100 million is only $52.6 million, with average size per state ranging from $40.6 million in Minnesota to $74.9 million in Wisconsin;
The number of banks that would have a ROA below 40 bp in the less than $250 million total assets category would increase from 93 to 136 due to increased regulatory costs, with 39 of the 43 additional banks in the less than $100 million total asset category;
Thirty-two of those 39 banks (82%) are located in five states: Illinois, Iowa, Kansas, Nebraska and Minnesota;
The total agricultural loan volume outstanding for the 97 total agricultural banks in those five states with a ROA less than 40 bp is $847.9 million with $532.8 million (62.8%) in two states, Kansas and Nebraska; and
Thirty (4.7%) of the 633 agricultural banks less than $100 million in total assets, who experienced positive 2013 earnings would experience negative earnings if costs increased by $70,000 to hire one additional compliance officer, with 18 (60%) located in Kansas and Nebraska.
The likely decrease in the number of agricultural banks and reluctance of larger commercial banks to open a branch in rural counties with stagnant or declining population growth will likely result in the loss of an identifying institution for those local communities and an inconvenience for the agricultural loan customers. However, the total amount of agricultural debt affected will be less than 1% of the total agricultural debt in the country.
Consequently, such a transition will provide opportunities for other lending institutions located in those, or adjacent, counties. The identification of such opportunities will enable the financial institutions that remain to better focus resources and project future lending opportunities. Furthermore, the financial product and service needs of residents in those rural counties will likely be satisfied increasingly through electronic delivery means.
Footnotes
1 The denominator varies for each question regarding mobile banking; therefore, the potential adoption rate is less than the sum of the percentages (Gross, Hogarth, and Schmeiser, 2012).
Reference.
Anderlik, J. M. and R.D. Cofer, Jr. 2014. Long-term Trends in Rural Depopulation and Their Impact for Community Banks, FDIC Quarterly, Vol. 8, No. 2.
American Bankers Association, Listing of 100 Largest Agricultural Banks. 2013. http://www.agrimarketing.com/s/85852.
Ayres, J., B. Waldorf, and M. McKendree. 2013. Defining Rural Indiana – First Step, Center for Rural Development. EC-766-W.
Barnard, F. and E. Yeager. 2013. The Role of Community Banks in Rural Indiana, Center for Rural Development. EC-768-W.
Cromartie, J. and S. Bucholtz. 2008. Defining the “Rural” in Rural America. Amber Waves, June. http://www.ers.usda.gov/AmberWaves/June08/features/ruralamerica. htm.
Dodd-Frank Progress Report. Various Dates. www.davispolk.com/Dodd-Frank-Rulemakding-Progress-Report/
Ellinger, Paul. 2012. Bank Branch Expansion in Rural Areas. FarmDoc Daily, University of Illinois (May 25, 2012).
Federal Deposit Insurance Company (FDIC) Call Report Data. Various Dates. https://cdr.ffiec.gov/public/
FDIC Glossary. No Date. http://www2.fdic.gov/qbp/Glossary.asp?menuitem=Glossary
Feldman, R. J., K. Heinecke and J. Schmidt. 2013. Quantifying the Cost of Additional Regulation on Community Banks. Minneapolis Federal Reserve Bank, Economic Policy Paper. May 30, 2013. www.minneapolisfed.org/publications_papers/pub_display
Gross, Matthew, Jeanne Hogarth and Maximilian Schmeiser. 2012. Customers and Mobile Financial Services, Board of Governors of the Federal Reserve System. Washington, D. C. (March 2012).
United States Census Bureau. County Intercensal Estimates (2000- 2010).
http://www.census.gov/popest/data/intercensal/county/county2010.ht mlUSDA/ERS Farm Income and Wealth Statistics, March 17, 2014.
Value Added to the U.S. Economy by the Agricultural Sector via the Production of Goods and Services, 2010-2014. ERS USDA. 2014. www.ers.usda.gov/data-products/farm-income-and-wealth-statistics
Waldorf, B. S. 2007. What is Rural and what is Urban in Indiana? Purdue Center for Regional Development. PCRD-R-4.
http://www.pcrd.purdue.edu/Communicaitons/Publications/default.as px.
![]()
![]()
![]()
![]()
![]()
