Impact of Ractopamine Use on Hog Slaughter Weights, Feeding Period, and Returns with a Lean-Value Pricing System
June 16, 1990
PAER-1990-6
Authors: Todd W. Millar, Research Assistant; Marshall A. Martin, Professor; Paul V. Preckel, Associate Professor, Department of Agricultural Economics; and Allan P. Schinckel, Associate Professor, Department of Animal Sciences
![]()
![]()
![]()
![]()
![]()
Introduction of the feed additive ractopamine into the swine industry offers the potential for increased efficiency and improved sector performance. Ractopamine affects swine growth by redirecting nutrients away from the production of fat tissue to the production of lean muscle. Results of some live animal ractopamine trials show improvements in average daily gain of 8 to 13 percent. Feed efficiency improves 10 to 20 percent, and backfat reductions of 12 to 20 percent have also been observed.
What changes in management strategies may be necessary for the successful integration of ractopamine into the hog production system? This study determined economically optimal slaughter weights, days on feed, and average daily profits for low, medium, and high genetic potential animals produced with and without ractopamine. In addition, the economic impacts of a lean value pricing system were analyzed.
Procedure
A swine growth simulation model originally developed by North Central Region Research Committee NC-179 was adapted for use in this study. The model was modified to incorporate ractopamine use. In addition, an accounting system for costs and revenues, and an adjusted lean growth curve to better reflect the genetic characteristics of U.S. hogs was added. The model determined economically optimal slaughter weights based on the goal of maximizing average daily profits.
Costs were designed to reflect high-investment Indiana feeder pig finishing operations. Control and ractopamine fed pigs were simulated with three different genetic potentials; low, medium, and high lean growth. The genetic potential of an animal is defined as the animal’s maximum protein deposition when protein and energy intake are not limiting factors. These protein deposition rates correspond to 0.57, 0 .69, and 0 .81 pounds of lean growth per day from 66 to 235 pounds and were drawn from different breeds and crosses representing the industry standard, plus and minus one standard deviation.
To model the addition of ractopamine in the diet, the maximum protein deposition per animal was increased by 25 grams per day during the last 90 pounds of live weight gain (the recommended ractopamine feeding period), regardless of genetic potential. As a result, hogs with a lower genetic potential show a greater percentage response to ractopamine than hogs with a higher initial genetic potential.
Current animal science research suggests that as the animal is fed ractopamine, daily protein requirements of the animal will increase. For this study, the control group received a 16 percent crude protein diet up to 110 pounds and then a 14 percent diet until slaughter. The ractopamine fed pigs, however, were given a 16 percent diet throughout the feeding period.
The average live weight market price in Indiana for pigs ranging from 235 to 270 pounds was near $45.00 per hundred weight for 1989. This base price of $45.00 per hundred weight was adjusted according to a discount schedule to obtain prices for hogs in alternative weight ranges. When determining the discount schedule, Heinold, Hoosier Stockyard, and the Indianapolis Stockyard were consulted. Based on their recommendations, the discount schedule presented in Table 1 was used in this analysis.
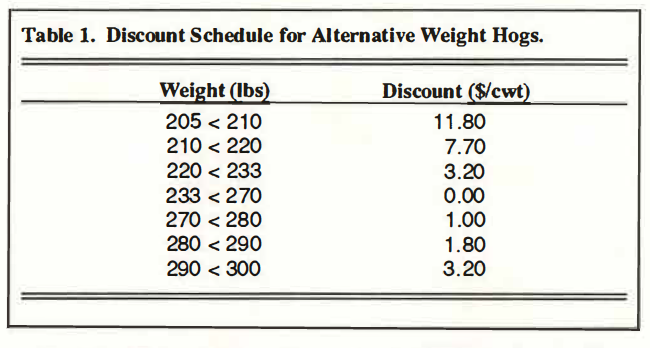
Table 1. Discount Schedule for Alternative Weight Hogs.
Cost coefficients, based on average 1989 Purdue Budgets (Schulte et al.), were broken down into four categories: fixed, facilities, labor, and feed. Per animal fixed costs included: (1) the purchase price of the feeder pig ($31.90) (assumed constant across all genetic lines), (2) a one-time medication charge ($1.30), (3) marketing charges ($1.00), and (4) miscellaneous charges ($1.88; $1.02 of which accounts for a 3 percent death loss charge). Summing these gave a total fixed cost of $36.08 per animal.
Facilities costs, based on Purdue ID-173 (Bache et al.), included: (1) fuel, electricity, and equipment repair charges of $0.0152 per pig per day, (2) an equipment charge of $0.0441 per pig per day, (3) building construction and repair charges of $0.0272 per pig per day, and (5) a production inventory charge of $0.0195 per pig per day. Total facilities costs per animal per day were $0.106. Finally, a labor cost of $0.0246 per pig per day was included (Bache et al.).
Feed costs were based on a standard com-soybean meal diet consisting of 8.5 percent crude protein com, 44 percent crude protein soybean meal, and a base-mix consisting of vitamins and minerals. In Indiana the 1989 price estimates for com and soybean meal were $2.60 per bushel and $250 per ton, respectively. The base-mix price was $17.75 per hundred weight. Based on these values, the cost of 16 percent crude protein feed was $0.0705 per pound ($141 per ton) and the cost of 14 percent crude protein feed was $0.0661 per pound ($132.20 per ton).
The actual cost of ractopamine is not known since the manufacturer has yet to establish a price. Studies of similar biotechnological products such as bovine somatotropin (bST) in the dairy sector suggest that farmers will not likely adopt the technology unless they can obtain a $2 net return for each $1 in cost. The same assumption was employed in this analysis.
Using the $2 to $1 average net return pricing rule, the estimated cost to producers of ractopamine per pound of feed was calculated. Assuming $45 live weight pricing with no charge for ractopamine, the additional return for ractopamine averages 3.5 cents per day during the entire feed period for all genetic potentials. If one-third of this benefit represented the cost of ractopamine, this would be 1.17 cents per day over the entire feeding period. Assuming that ractopamine is fed approximately the last half of the feeding period, the daily charge for ractopamine would average 2.34 cents. The average daily feed intake across all genetic potentials for the entire feeding period is 4.87 pounds. Therefore, the estimated price of ractopamine to hog producers is assumed to be 2.34/4.87, or an additional 0.48 cents per pound of feed containing ractopamine.
Consequences of Ractopamine Introduction for Three Genetic Lines
Six model simulations were conducted using low, medium, and high genetic potential lines with and without ractopamine. The following discussion centers around the biological and economic changes that occur when ractopamine is added to the diet (Table 2).
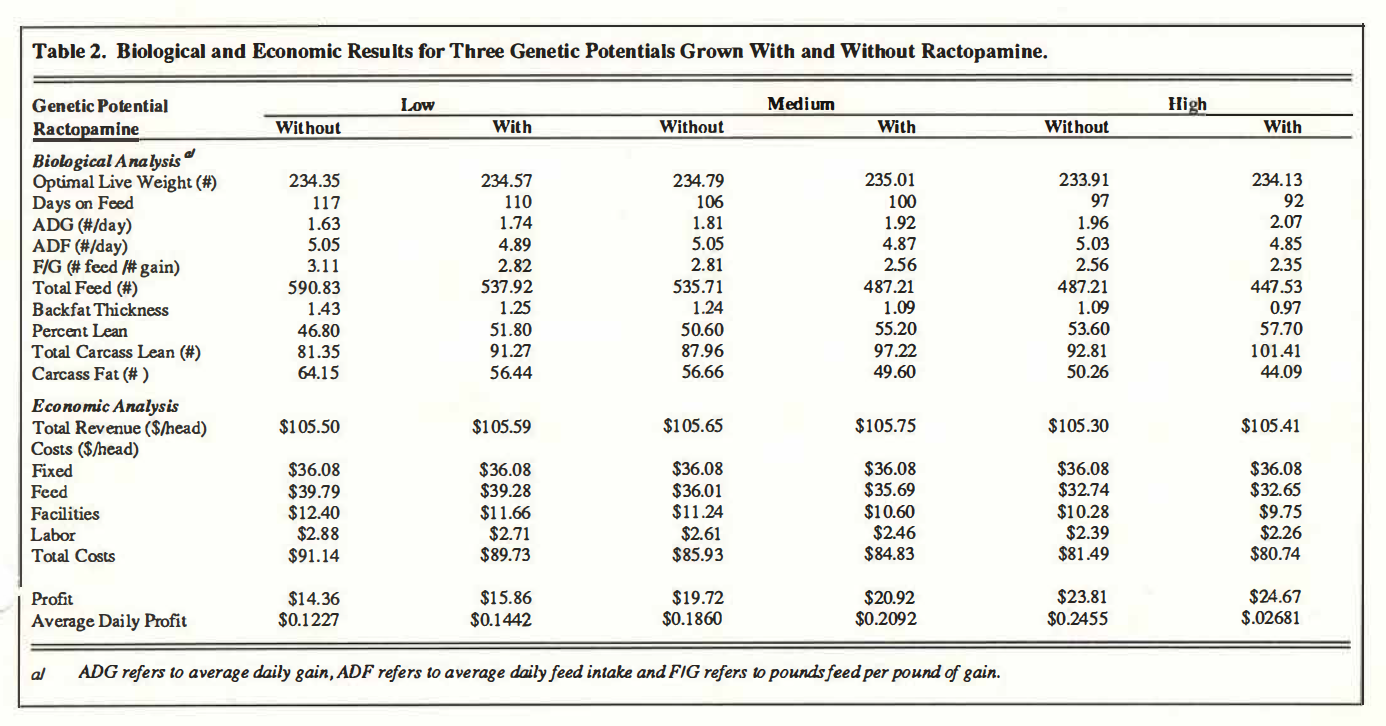
Table 2. Biological and Economic Results for Three Genetic Potentials Grown With and Without Ractopamine.
Biological Analysis
It is a common belief in the industry that market weights will rise with the use of ractopamine. How do optimal slaughter weights change with the use of ractopamine? Based on the model simulations, with the stated hog price and production cost assumptions, the optimal slaughter weights remain constant across all three genetic lines, regardless of whether or not ractopamine is fed. These results are discount driven. Once the animal can be sold without a heavy penalty, 233 pounds, the model suggests selling the pig and bringing in a new feeder pig that can transform feed into live weight more efficiently than feeding a 233 pound animal to even heavier weights. * Analysis was conducted to determine the sensitivity of optimal slaughter weights to fixed and feed costs. Slaughter weights were only found to be sensitive to high fixed costs.
Ractopamine use can reduce days on feed, increase feed efficiency, and increase the percent carcass lean. Reductions of 7, 6, and 5 days can be realized for low, medium, and high genetic potential animals, respectively. The reductions in days on feed is the result of an improvement in average daily gain of 0.11 pounds per day across all genetic lines.
The reduction in average daily feed consumption with ractopamine was 0.16, 0.18, and 0.18 pounds per day for low, medium, and high genetic potential animals, respectively. Improvements in the feed to gain ratio of 9 .3, 8. 9, and 8.2 percent also were realized for low, medium, and high genetic potential animals, respectively.
Improvements in the percent lean ranged from 5.0 percentage points for low genetic potential pigs to 4.1 percentage points for high genetic potential pigs. With the feeding of ractopamine, total carcass lean was increased by 9.9, 9.3, and 8.6 pounds while fat content was decreased by 7.7, 7.1, and 6.2 pounds, respectively, for low, medium, and high genetic lines. Moreover, backfat was reduced by 0.18, 0.15, and 0.12 inches for low, medium, and high genetic lines.
Economic Analysis
The primary economic impacts of ractopamine use are reductions in variable costs for feed, facilities, and labor due to the reduction in days on feed. Feed costs declined slightly when animals were fed ractopamine. Reductions in feed costs of 1.3, 0.9, and 0.2 percent were observed for low, medium, and high genetic lines, respectively.
The greatest savings came in the form of reduced facilities costs. As the time on feed was reduced, the cost of facilities per animal declined 6.0 percent for low, 5.7 percent for medium, and 5.2 percent for high genetic potential pigs.
Finally, since the pigs were kept fewer days, feeding ractopamine helped lower total labor costs per animal, assuming negligible additional labor requirements to administer the compound. Labor costs declined 5.9, 5.7, and 5.4 percent for low, medium, and high genetic potential animals, respectively.
Increases in net revenue per pig were $1.50, $1.20, and $0.86 for low, medium, and high genetic potential animals, respectively. Likewise, average daily profit increased with the use of ractopamine. Increases of 2.15, 2.32, and 2.26 cents per day for low, medium, and high genetic potential animals, respectively, were observed.
Lean Value Marketing Analysis
An issue of considerable interest in the swine industry in recent years is the potential for conversion from live weight pricing of market hogs to lean value pricing. This would involve paying producers different prices for lean and fat, rather than a single price for overall body mass, thus rewarding producers of leaner animals.
This study examined a lean value pricing system which included a price for lean, a price for fat, and a price for byprducts. The price of lean and fat is on a per pound basis while the byproduct price is a fixed dollar amount per pig. According to Whipker and Akridge, the average 1989 yellow sheet price for byproducts was $8.72 per pig. The lean-to-fat price ratios (3/1, 4/1, 5/1, 6/1) found in Table 3, based on a live weight price of $0.45 per pound, were calculated so that producers of non-ractopamine fed medium genetic potential animals would remain indifferent between the live weight and lean value pricing for animals sold at an optimal weight based on maximum average daily profit.
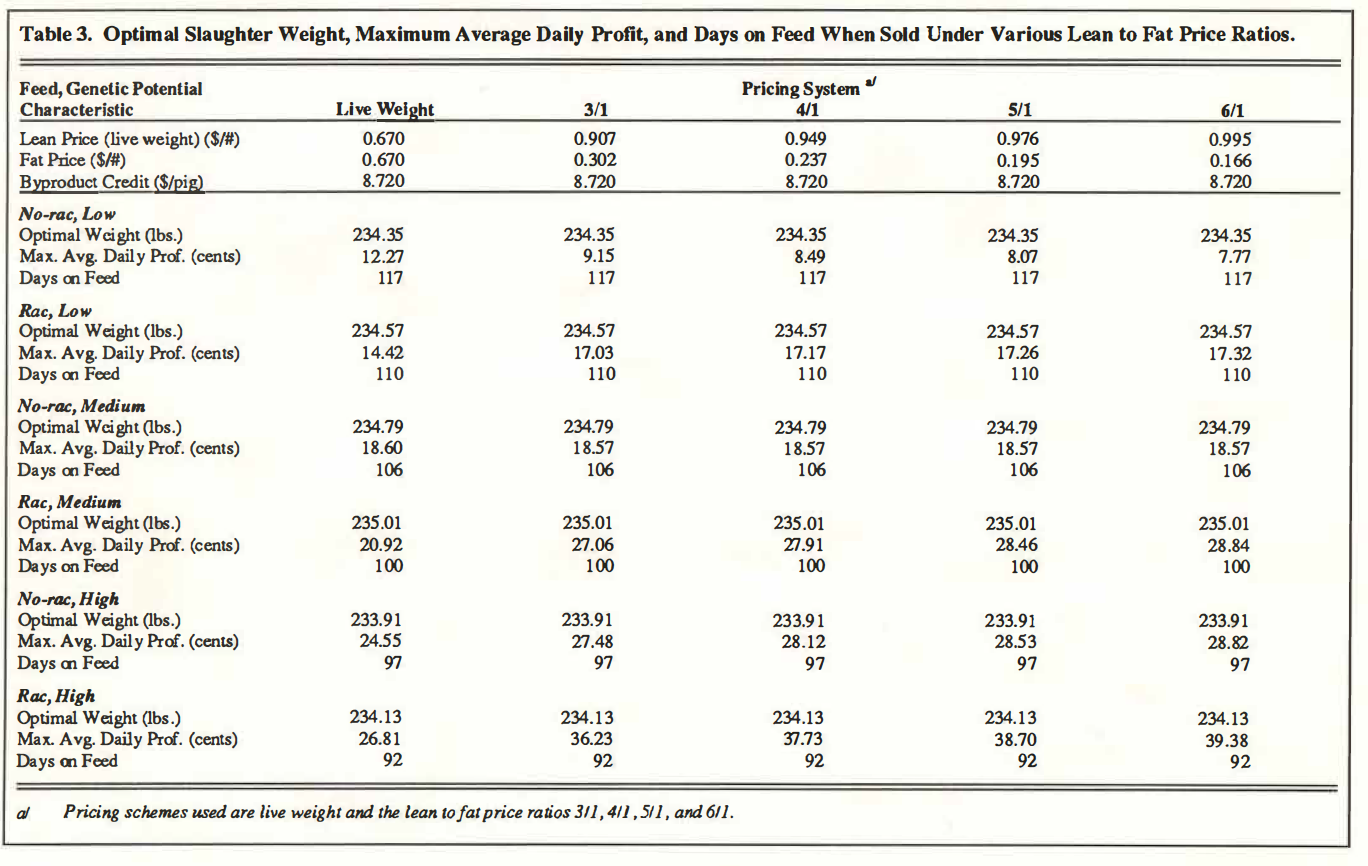
Table 3. Optimal Slaughter Weight, Maximum Average Daily Profit, and Days on Feed When Sold Under Various Lean to Fat Price Ratios.
According to this analysis, optimal slaughter weights and the number of days on feed are insensitive to the different pricing systems. Maximum average daily profits, however, changed rather drastically depending on the ratio selected. Research conducted by Whipker and Akridge at Purdue University indicates that the ratio that processors most likely will use lies between 4: 1 and 5: 1. Therefore, even though the 3: 1 and 6: 1 price ratios are presented in Table 3, the following discussion focuses on the 4: 1 and 5: 1 price ratios.
As expected, a producer of low genetic potential pigs who is not feeding ractopamine would lose revenues by switching to the lean value pricing system (Table 3). Due to insufficient lean, producers of these pigs would experience a drop in average daily profits of 3.78 cents with the 4: 1 price ratio and 4.20 cents with the 5:1 price ratio. Producers adding ractopamine to the diet of low genetic potential pigs would experience a much different outcome, however. Instead of a 3.78 cent loss in average daily profits with the 4:1 price ratio, these producers would realize a 2.75 cent increase. Likewise, with the 5: 1 price ratio, producers using ractopamine would realize a 2.84 cent increase in average daily profits.
By assumption, the non-ractopamine fed medium genetic potential pigs would experience no change in average daily profits with a lean value pricing system. However, producers feeding ractopamine to these animals would realize a 6.99 and 7.54 cent increase in average daily profits with 4:1 and 5:1 price ratios, respectively.
Producers of high genetic potential pigs would benefit from the lean value pricing system regardless of whether or not they feed ractopamine. Producers not feeding ractopamine would experience an increase in average daily profits of 3.57 cents for a 4: 1 price ratio and 3.98 cents for a 5: 1 price ratio. Producers feeding ractopamine to these high genetic potential pigs, however, would realize a 10.92 cent and 11.89 cent increase in average daily profits per animal for 4: 1 and 5: 1 price ratios, respectively.
Under the live weight pricing system, the returns to ractopamine use (the difference in maximum average daily profit of the non-ractopamine fed animal and the ractopamine fed animal) was 2.15 cents for low, 2.32 cents for medium, and 2.26 cents per day for high genetic potential animals at 235 pounds, respectively. Assuming a constant cost for ractopamine, returns to ractopamine increase dramatically as the lean value price ratio increased (Figure 1).
A shift from a live weight price to a 2: 1 lean value pricing system resulted in the greatest increase in maximum average daily profits and the greatest returns to ractopamine. Compared to a live weight pricing system, the 4: 1 price ratio resulted in increased returns to ractopamine of 6.53 cents per day for low, 7.02 cents per day for medium, and 7.35 cents per day for high genetic potential pigs, respectively. Compared to a 4:1 lean to fat price ratio, the 5:1 price ratio added an additional 0.51 cents per day for low, 0.55 cents per day for medium, and 0.56 cents per day for high genetic lines (Figure 1).
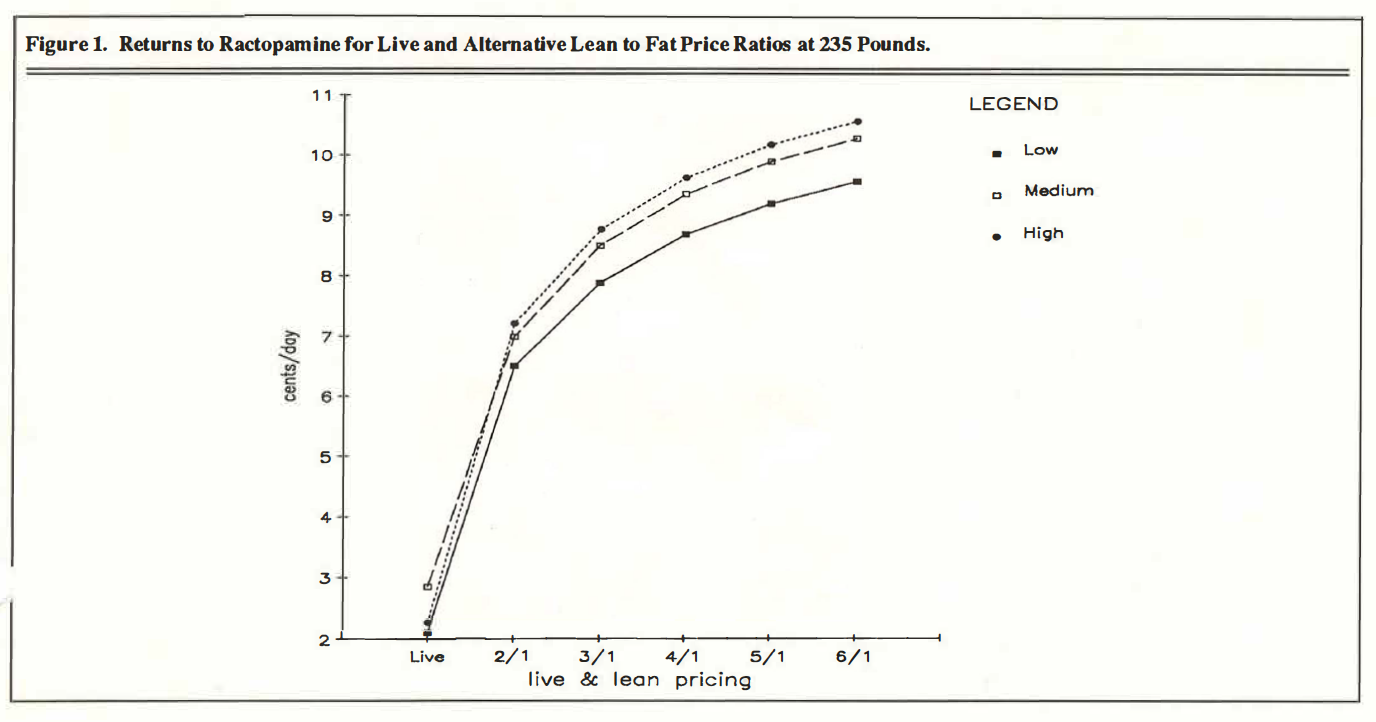
Figure 1. Returns to Ractopamine for Live and Alternative Lean to Fat Price Ratios at 235 Pounds.
Summary
Simulation methods were used to evaluate changes in economically optimum management strategies with the use of ractopamine for alternative genetic lines. The principal effect of ractopamine use is to reduce the number of days on feed required to bring a hog to market weight. Given this, and an improved feed to gain ratio which helps reduce feed costs, producers (with live weight pricing and the assumed price for ractopamine) can realize an increase in net returns of approximately 2.3 cents per pig per day, on average, across all genetic lines analyzed.
A lean value pricing system was analyzed using a range of lean-to fat price ratios. Producers of low genetic potential animals not fed ractopamine would prefer the live weight pricing system because their animals are not lean enough to benefit from the lean value pricing system. All other producers would either prefer, or be indifferent to, the lean value pricing system. Assuming that the lean-to fat price ratio selected by the packing industry is in the 4:1 to 5:1 range, producers feeding ractopamine could realize a 2.75 to 10.92 cent increase in average daily profits for a 4: 1 price ratio and a 2.84 to 11.89 cent profit increase with a 5: 1 price ratio for low and high genetic potential lines, respectively. Compared to live weight pricing, the lean value pricing system would increase net returns to ractopamine by an average (across all genetic lines) of 6.97 cents per day with a 4 to 1 lean to fat price ratio and 7.51 cents per day with the 5 to 1 price ratio.
Ractopamine can provide hog producers with a new means to more efficiently produce lean hogs and increase profits. However, success will depend on careful selection of genetics, economically optimal rations, and the introduction of a lean value pricing system by packers.
Bibliography
Bache, David H., Craig L. Dobbins, and Vernon B. Mayrose. 1987 Production Cost Estimates for Swine Enterprises. Purdue University Cooperative Extension Service, ID-173.
Schulte, Aaron, Craig L. Dobbins, and David C. Petritz. 1989 Cost and Return Estimates for Livestock Enterprises. Department of Agricultural Economics, Purdue University.
Whipker, Linda D., and Jay T. Akridge. Pricing Lean: A Lotus Template For Determining The Price of Lean Pork. Ver. 2.0, Purdue University, 25 Feb. 1990.
![]()
![]()
![]()
![]()
![]()
