Impact of Risk and Other Factors on Grain Marketing Behavior
January 18, 1995
PAER-1995-02
David T. Eckman, Graduate Research Assistant; George F. Patrick, Professor; and Wesley N. Musser, Visiting Professor from Department of Agricultural Economics and Resource Economics, University of Maryland
![]()
![]()
![]()
![]()
![]()
Crop prices and crop yields are considered the most important sources of risk in farming among large-scale cornbelt cash grain farmers. New forms of crop insurance can be used to manage production risk and several marketing techniques including forward contracting, minimum price contracts, hedging, and options contracts are available to help manage price risk. The purpose of this article is to determine the use of these marketing techniques and to explore the factors, including attitudes toward price risk, which affect grain marketing behavior of large-scale farmers.
The study is based on data obtained through a survey of producers participating in the 1993 Purdue Top Farmer Crop Workshop. Nearly 150 attended the 1993 workshop representing nearly 100 farms in nine Midwestern states. Since there were multiple participants from several farms, the survey was directed toward the participants with primary marketing responsibility.
The average respondent was nearly 41 years of age, which is younger than the average farmer in the North Central region. Likewise, with nearly 3.3 years of post-high school education, the average respondent was more highly educated than the average farmer in the region. The respondents operated an average of 1834 acres, about four times larger the average in the region. Less than 30 percent of the operated acres were owned by the operators.
A total of 62 farms were represented in the study, and none of the farms received more than 67 percent of gross income from livestock. On average, corn and soybeans accounted for 75 percent of gross farm sales. All farms had gross farm sales in 1992 of more than $100,000 with about 39 percent over $500,000. The majority of the farm operations had debt/asset ratios of 20 to 39 percent.
Marketing Methods Used to Reduce Risk
The producers were asked to rate the importance of forward contracting, minimum price contracts, hedging, and options contracts as marketing responses to risk. This information is presented in Table 1. A scale of one to five was used, with one being not important and five being very important. Forward contracting was viewed as the most important marketing response to risk with an average score of 4.23 and 74 percent of the producers indicated this method was used on their farms. Hedging with futures was second, ranked at 3.69 with about 55 percent of respondents using the method. Options contracts and mini-mum price contracts followed with scores of 3.08 and 2.93, respectively, and with 36 and 19 percent of respondents indicating their use.
Even with the decreasing emphasis on government support pro-grams, these large-scale producers continue to consider participation in government programs important to their farm operations. Participation in government farm programs as a management response to risk scored 3.92 on the same five-point scale, and 71 percent of these producers participated in the government farm program in 1993.
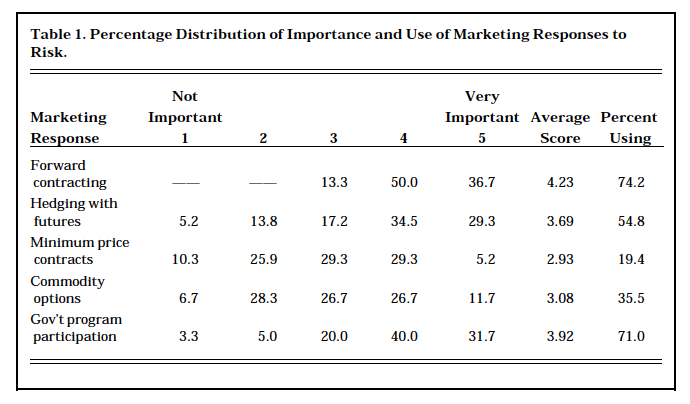
Table 1. Percentage Distribution of Importance and Use of Marketing Responses to Risk
The producers were also asked to indicate the quantity of their 1992 and 1993 corn and soybeans which had been marketed by July 15 of each year. The percentages of producers using each marketing method and total quantities marketed by the 62 producers are presented in Table 2. Forward contracting was the most common marketing method and was used by about two-thirds of the producers, followed in use by hedging, options contracts, and finally minimum price contracts. Use of these marketing methods in 1993 was substantially lower than the use indicated in Table 1.

Table 2. Percentage of Workshop Participants Using Selected Marketing Methods and Quantities Marketed by Marketing Methods as of July 15 of Corn and Soybeans
The percentage of producers using forward contracting decreased for corn while use increased for soybeans from 1992 and 1993, probably reflecting the adverse weather in the western cornbelt in 1993 and producers’ perceptions of the markets. The percentages of producers hedging corn and soybeans increased from 1992 to 1993, but other changes in the use of marketing techniques were not consistent across crops. Notice that the bushels of corn marketed decreased from 1992 to 1993 for each of the four methods. With the exception of mini-mum price contracts, the opposite occurred for soybeans.
Attitudes Toward Risk
The producers were asked to describe their risk attitudes in three areas. First, producers were asked to indicate their agreement or disagreement with the following statement: “I am more concerned about a large loss in my farm operation than missing a substantial gain.” Almost half, 48.3 percent agreed or strongly agreed, 30.0 percent were neutral, 21.7 percent disagreed, and no respondents strongly disagreed.
For the second area, producers indicated the percentage of expected yields they would give up to have stable yields from year to year with cur-rent technology. In essence, this is the premium they would pay for stable yields, thus, we call them “risk premiums.” They are shown in Table 3. The majority of producers would give up 10 percent or less yield. However, 19 percent of corn producers and 15 percent of soybean producers were willing to give up 20 percent or more of current yields for year to year stability.
In the third risk attitude area producers indicated how their 1992 net farm income compared to the average of the previous five years. Previous studies have shown that individuals are more likely to take a risky action following a loss. Nearly 63 percent had 1992 net farm incomes which were higher or much higher, while about 26 percent had incomes that were about the same as the previous five years. About 11 per-cent indicated 1992 net income was below average. As the percentage of expected production forward marketed increases, price risk would decrease to a point, but yield risk would continue to increase. Thus, higher percentages of forward marketing would be more risky and the producers indicating below average net income would, on average, for-ward market a higher percentage of expected production than the producers indicating above average net income. As it turned out, the respondents indicating a below average net income in 1992 forward marketed a significantly higher percentage of expected production by July 15.
1993 versus Marketing Plan Behavior
This study also explored marketing behavior in 1993 and compared it with their typical long-run marketing plan. We call the producers’ long-run marketing plan their “marketing plan behavior.” The 1993 marketing behavior is defined as the percentage of expected 1993 production that was marketed by July 15. The quantities marketed using the four methods in Table 1 were summed for each producer and then divided by expected production to determine the percent marketed by July 15. The average percentage, across producers, of expected 1993 production marketed by July 15 was 23.0 percent for corn and 36.8 percent for soybeans.
Marketing plan behavior is defined as the maximum percentage of expected production the producers would typically market by August 1. Designed to capture farmers’ long-run marketing behavior, producers were asked to indicate the maximum percentage of expected production they would typically price by August 1. The average response was 58.6 percent for corn and 59.2 percent for soybeans. However, the range of the responses was 10 to 100 percent for both corn and soybeans.
Other Factors That Affect Marketing Behavior
A total of eleven factors were tested to determine their affects upon both 1993 marketing behavior and marketing plan behavior. The statistically significant factors are presented in Table 4. A negative sign indicates a negative relationship between the factor and the marketing behavior. A positive sign indicates a positive relationship. The factors that were not statistically significant in any of the tests include: percentage of income from livestock, gross income, risk premium, and yield variability.
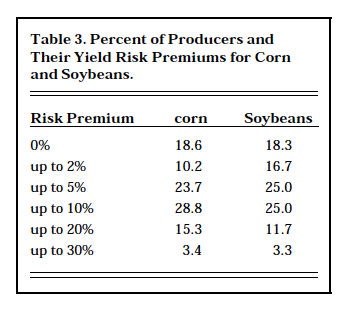
Table 3. Percent of Producers and Their Yield Risk Premiums for Corn and Soybeans
Two factors were found to significantly affect marketing plan behavior for each corn and soybeans. One measurement of risk attitudes—attitude toward loss—significantly affected the marketing plan behavior of both corn and soybeans. Producers more concerned with a loss would typically market more by August 1.
Five factors significantly influenced the 1993 marketing behavior for corn while three factors influence the 1993 marketing behavior for soy-beans. The 1993 marketing behavior for corn was positively affected by years of education. The producers with more education marketed a higher percentage of expected 1993 production by July 15. In contrast, 1993 corn marketing was negatively affected by the age of the producer as younger producers marketed higher percentages of expected production.
The 1993 marketing behavior for both corn and soybeans was positively affected by the use of options or minimum price contracts. Supposedly, the producers using these techniques have the potential for price enhancement, but have eliminated the implications of downward price movements. Conversely, the 1993 decisions were negatively effected by the change in net income from the previous five years. Those farmers reporting lower than average net incomes in 1992 marketed higher percentages of expected 1993 production by July 15. As stated earlier, marketing higher percentages of expected production is more risky when taking yield risk into consideration. This supports the findings that farmers are willing to take risky actions after losses.
Finally, due to the adverse weather conditions in the western cornbelt in 1993, producers in that region marketed lower percentages of their expected 1993 production.
Summary and Conclusions
Marketing methods for the 1992 and 1993 crops were obtained from a survey of large scale farmers. The large-scale farmers in this study do forward market a significant portion of their corn and soybean crops.
Forward contracting was considered the most important of the four marketing responses to risk. In addition, forward contracting was the most common marketing method, being used by nearly three-quarters of the producers. Hedging and options were used by about 55 and 36 per-cent of the producers, respectively. On average, producers priced 23 and 37 percent of their expected 1993 corn and soybean production by July 15, 1993. The large-scale producers in this study continue to consider government program participation an important management response to risk and nearly 71 percent participated in the 1993 government feed grains program.
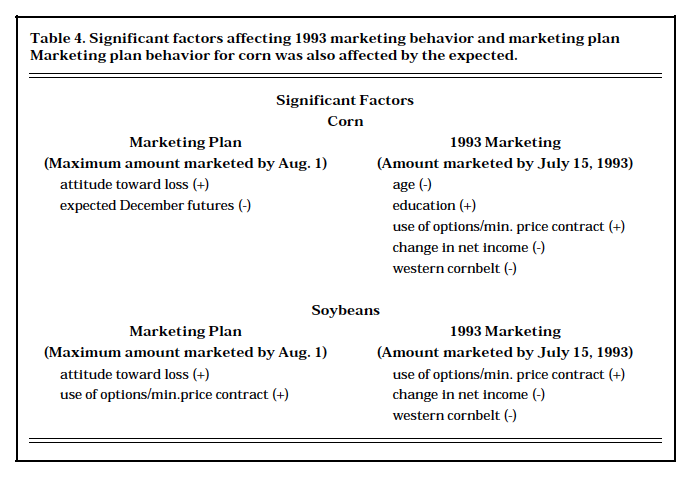
Table 4. Significant factors affecting 1993 marketing behavior and marketing plan. Marketing plan behavior for corn was also affected by the expected.
Two factors had significant influence on marketing plan behavior for each corn and soybeans. Five factors significantly influenced 1993 marketing behavior for corn while three fac-tors significantly influenced 1993 marketing behavior for soybeans. It was found that risk attitudes had a significant impact on marketing behavior. The attitude toward loss affected marketing plan behavior. This implies that those farmers more concerned about a large loss than missing a substantial gain will typically market a higher percentage of expected production by August 1. The change in net income from the average of the previous five years affected 1993 marketing behavior, indicating that producers are more willing to take risky actions after losses. The producers using options or minimum price contracts marketed a significantly higher percent-age of expected 1993 production by July 15, implying these marketing techniques reduce the risk associated with some of the other techniques. Finally, as a result of their location or price expectations, those farms located west of the Mississippi river marketed significantly less of their expected 1993 production by July 15.
References
Collins, Alan, Wesley N. Musser and Robert Mason. “Prospect Theory and Risk Preferences of Oregon Seed Producers.” American Journal of Agricultural Economics 73(1991):429-35.
Eckman, David T., George F. Patrick, Wesley N. Musser(1994). “Risk and Grain Marketing Behavior of Large-Scale Farmers: An Exploratory Analysis.” Unpublished Manuscript.
Ortman, Gerald F., George F. Patrick, Wesley N. Musser and D. Howard Doster. Information Sources, Computer Use, and Risk Management: Evidence from Leading Cornbelt Farmers. Purdue University Agricultural Experiment Station Bulletin No. 638, June 1992.
Patrick, George F., Paul N. Wilson, Peter J. Barry, William G. Boggess, and Douglas L.Young. “Risk Perceptions and Management Responses: Producer-Generated Hypotheses for Risk Modeling.” Southern Journal of Agricultural Economics. 57(1975):410-419.
![]()
![]()
![]()
![]()
![]()
