Income Differences: Owner’s and Businesses’ Age Amongst Family/Non-Family Businesses
May 15, 2024
PAER-2024-14
William Walls, Graduate Research Assistant; Renee Wiatt, Family Business Management Specialist; and Dr. Maria Marshall, James and Lois Ackerman Professor of Agricultural Economics
![]()
![]()
![]()
![]()
![]()
Introduction
Small businesses continue to play an important role in Indiana’s economy, especially the farms that provide agricultural production not only to the state but to the rest of the country. The idea of succession, cross-generational promotional practices, and business longevity become key to the long-term success of small businesses. With that said, a large majority of respondents to the 2012 Intergenerational Farm and Non-Farm Business Survey had yet to start the processes of management transfer, ownership transfer, or estate planning, and only 28% of respondents had found a successor for their business (Marshall et al., 2012). A study by Mishra et al. (2003) found similar results using the 2001 Agricultural Resource Management Survey, with only 27% of farm operators in the United States having named a successor for their operation.
Utilizing the Small Business Values Survey (Marshall & Wiatt, 2019), we sought to better understand the correlation between low succession numbers in the businesses and the continued importance of small businesses’ longevity. The survey consisted of 14 sections: screener questions, business demographics, copreneurs, technology & social media, socioemotional wealth, FB-BRAG: family business functioning, culture of collaboration, adjustment strategies, work/family balance, disaster, crisis (non-disaster/other event), financials, exit strategies and expectations, and respondent demographics. The screener questions ensured that the respondents were owners of a small business and over 18 years of age. Business demographics, copreneurs, technology & social media, and financials were used to understand how a respondent’s business was organized and operated, as well as the financial background of the businesses. Socioemotional wealth, FB-BRAG, culture of collaboration, adjustment strategies, and work/family balance sections were added to better understand respondents’ feelings as they thought about their small business. The disaster and crisis sections were used to understand how a respondent’s business dealt with adversity and any extenuating challenges. The exit strategies and expectations section gained insight into what the respondents expected and desired to happen when thinking about future generations of their business. Finally, the general demographics of the respondents were recorded as well.
Results
Our data visualizations compare average income levels across a variety of business characteristics. Average business income for each category was used as a constant variable due to profit being the second most important business goal, behind a positive reputation with customers, per the 2012 Intergenerational Farm and Non-Farm Business Survey (Marshall et al., 2012). Below are two figures, along with descriptions of our findings, that compare the financial measure of business success against other business characteristics to observe what trends exist.
Figure 1 depicts the owner’s age compared to the average income of family and non-family small businesses. The largest average annual income occurred when respondents were in their 30s at just over $1,000,000. The next two highest data points occurred when owners responded that they were in their 40s, followed closely by owners who responded that they were in their 20s. The trend follows a bell curve, with the highest average income being within the three youngest age groups and decreasing as respondents aged. This demonstrates that the age of the owner of the business can have strong effects on the average income of a small business. It is important to note that these averages are a combination of family and non-family small businesses, and what works for one segment (i.e., farms) may not work as well for the other (i.e., non-farm businesses). Overall, this figure demonstrates the importance of cross-generational ownership within a small business.
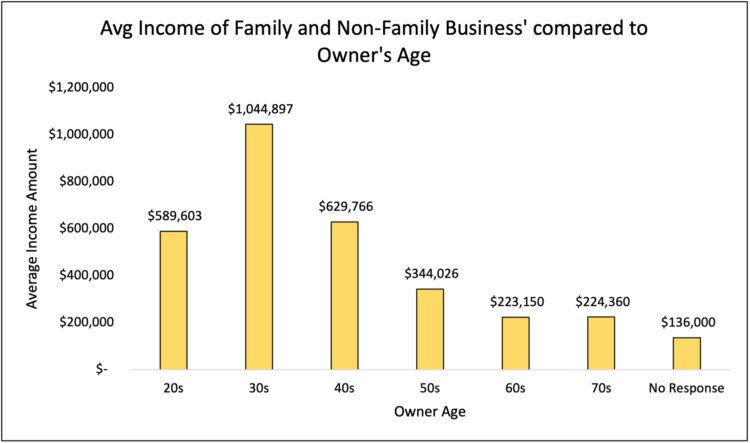
Figure 1. Average Income of Family and Non-Family Business’ compared to Owner’s Age.
Figure 2 illustrates business age compared to the average income of family and non-family small businesses. The largest average income, by a wide margin, occurs when the business is 40 – 49 years old. The next businesses that had the highest average income were age groups 10 – 19 years old and 20 – 29 years old. Although the distinction between these data points and the remaining age groups appears minimal, a difference of $200,000 – $300,000 is quite large for small businesses. There is no direct trend for this data set, just a striking observation of business age at the 40 – 49-year-old data point. This demonstrates that small businesses that have been in business for this period of time are experiencing higher income than businesses that are younger. It is important to notice that the fifty-plus business age data point had the lowest average income (but the sample for this group may not be representative, with only eight observations between 50 years and 83 years). Founder-owned businesses that are in their 40s likely have owners who are nearing and considering retirement age and who are also considering bringing in that next generation to the business.
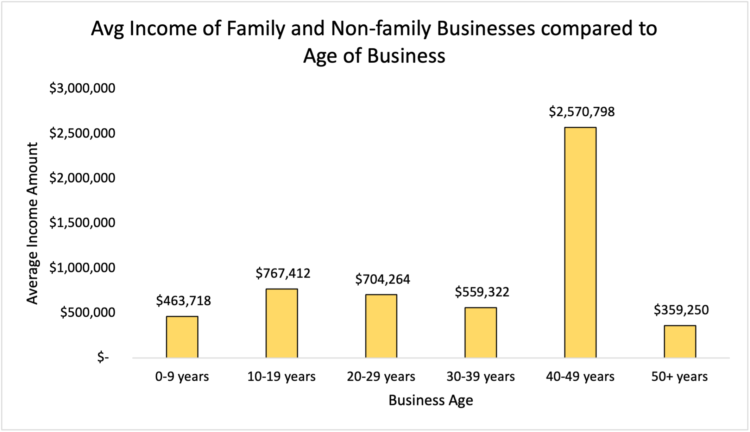
Figure 2. Average Income of Family and Non-Family Businesses compared to Age of Business
Conclusion
Table 1 reports the correlation between variables. We see there are not as strong positive or negative relationships as the graphs might suggest. Especially as we look at the average business income as the constant variable. As the business’ age approaches thirteen years, the business’ income is positive. So, as the business continues increasing in age, the income should resemble a similar narrative. Yet, as the owner’s age approaches forty-four, the business’ income becomes negative. This correlation matrix and mean table help in the understanding of the previous two graphs by linking what we see. The longer a business remains in business, the possibility it experiences high amounts of income is likely; and the longer an owner maintains total managerial and operational control, there is an increased possibility that the business will experience drops in income — highlighting the importance of succession practices and planning.
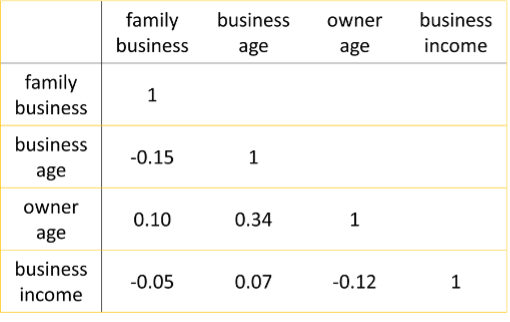
Table 1: Correlation Table
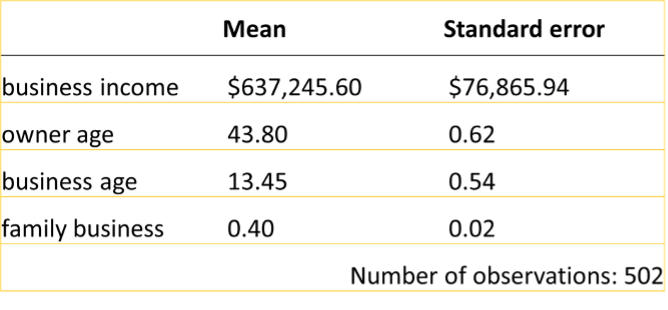
Table 2: Mean Table
Every small business is different, and therefore, succession will look unique for each business. Each succession process takes a different amount of time and has different key players, meaning strategies that work for some may not be as successful for others. Family businesses may do things differently than non-family businesses, and younger businesses may operate differently than more experienced businesses. However, based on our analysis, cross-generational promotion practices may be useful regardless of the status of a small business. The longer a small business is in business, the higher the chances are that it will continue to see high amounts of income. At the same time, somewhere along the small businesses’ lifespan, a change in ownership to a younger generation may be important in order to continue seeing high amounts of income.
References
Marshall, M.I., Dobbins, C., & Keeney, R. (2012). Intergenerational Farm and Non-Farm Business Survey.
Marshall, M.I., & R. Wiatt (2019). Small business values survey [data file and codebook]. Purdue Institute for Family Business, Purdue University. Unpublished data.
Mishra, A.K., J.D. Johnson, & M.J. Morehart. (2003). “Retirement and succession planning of farm households: results from a national survey.” Paper for presentation at the National Public Policy Education Committee, Salt Lake City, UT.
![]()
![]()
![]()
![]()
![]()