Increasing Strength in Indiana Land Values
August 1, 1979
PAER-1979-1
Author: J. H. Atkinson, Professor of Agricultural Economics
![]()
![]()
![]()
![]()
![]()
Note: The charts in this article were taken from physical copy scans – as the original documents no longer exist. These versions are very blurry – we apologize in advance for the quality.
The 1979 Land Values Survey was made possible by the cooperation of 210 persons who are knowledgeable about land values and cash rents – farm managers, appraisers, realtors, and agricultural lenders representing banks, PCAs, the Federal Land Bank, and insurance companies. They reported on all but seven counties in Indiana giving their estimates of cash rent and the market value for top, average, and poor tillable bare land. They also estimated the corn yield which might be expected over several years on each of the classes of land. In addition to farm land, they estimated the value of land moving into nonfarm uses – factory locations, housing, shopping centers, etc.
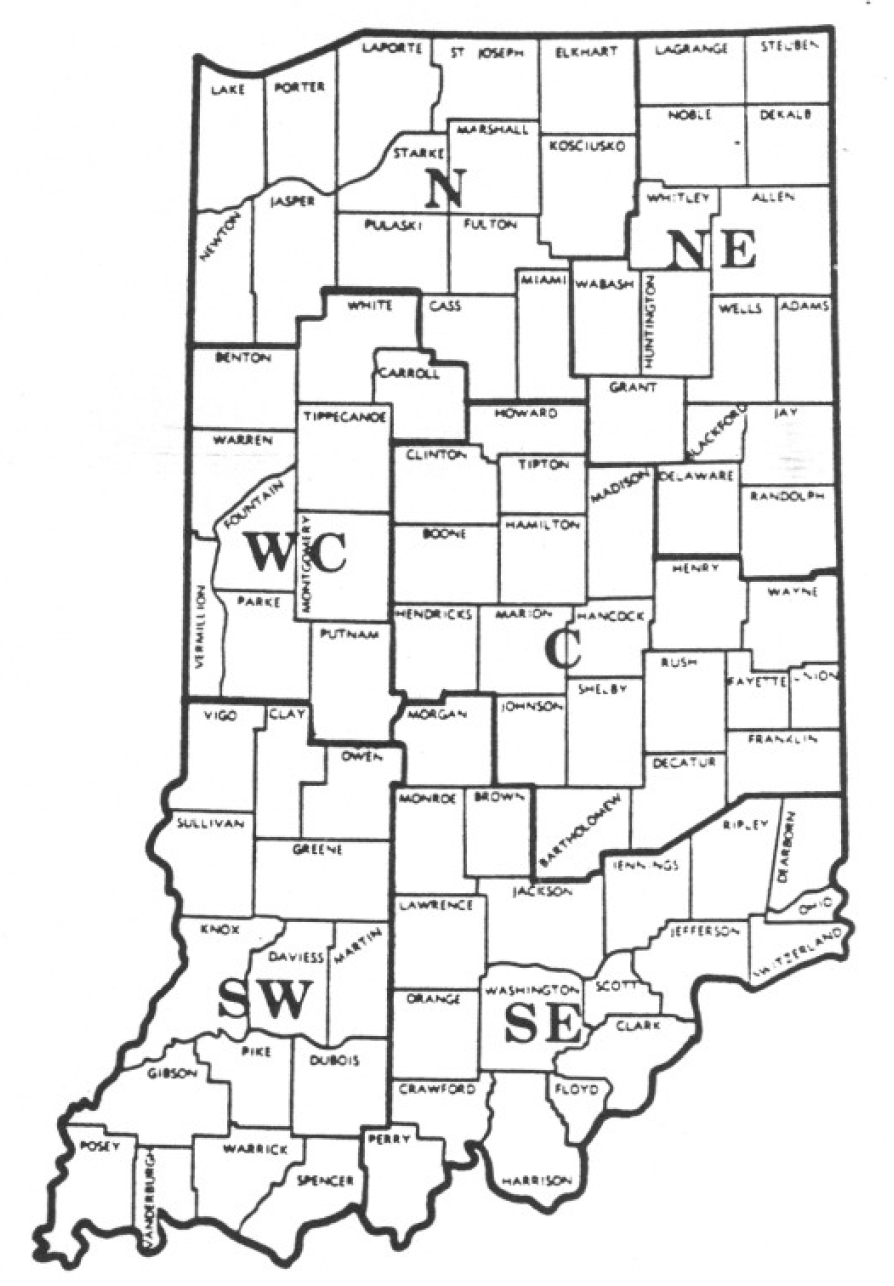
Figure I. Geographic areas used in the 1979 land value survey, Purdue University, July 1979.
The state was divided into six areas (Figure I) based roughly on general soil associations. Within any area, land values io a specific county may vary considerably from the area average. Table l summarizes much of the information on land values and cash rent, as well as an estimate or projection of where the respondent think values will be by the end of the year. In using estimates from the survey especially dollar figures per acre, potential buyers and sellers of land should remember that nothing substitutes for good knowledge of one’s local land market. Our figures are useful guidelines and may fit some local situations, but the probable value of a specific farm still must be adjusted for buildings, non-tillable land drainage, soil type, fertility, etc.
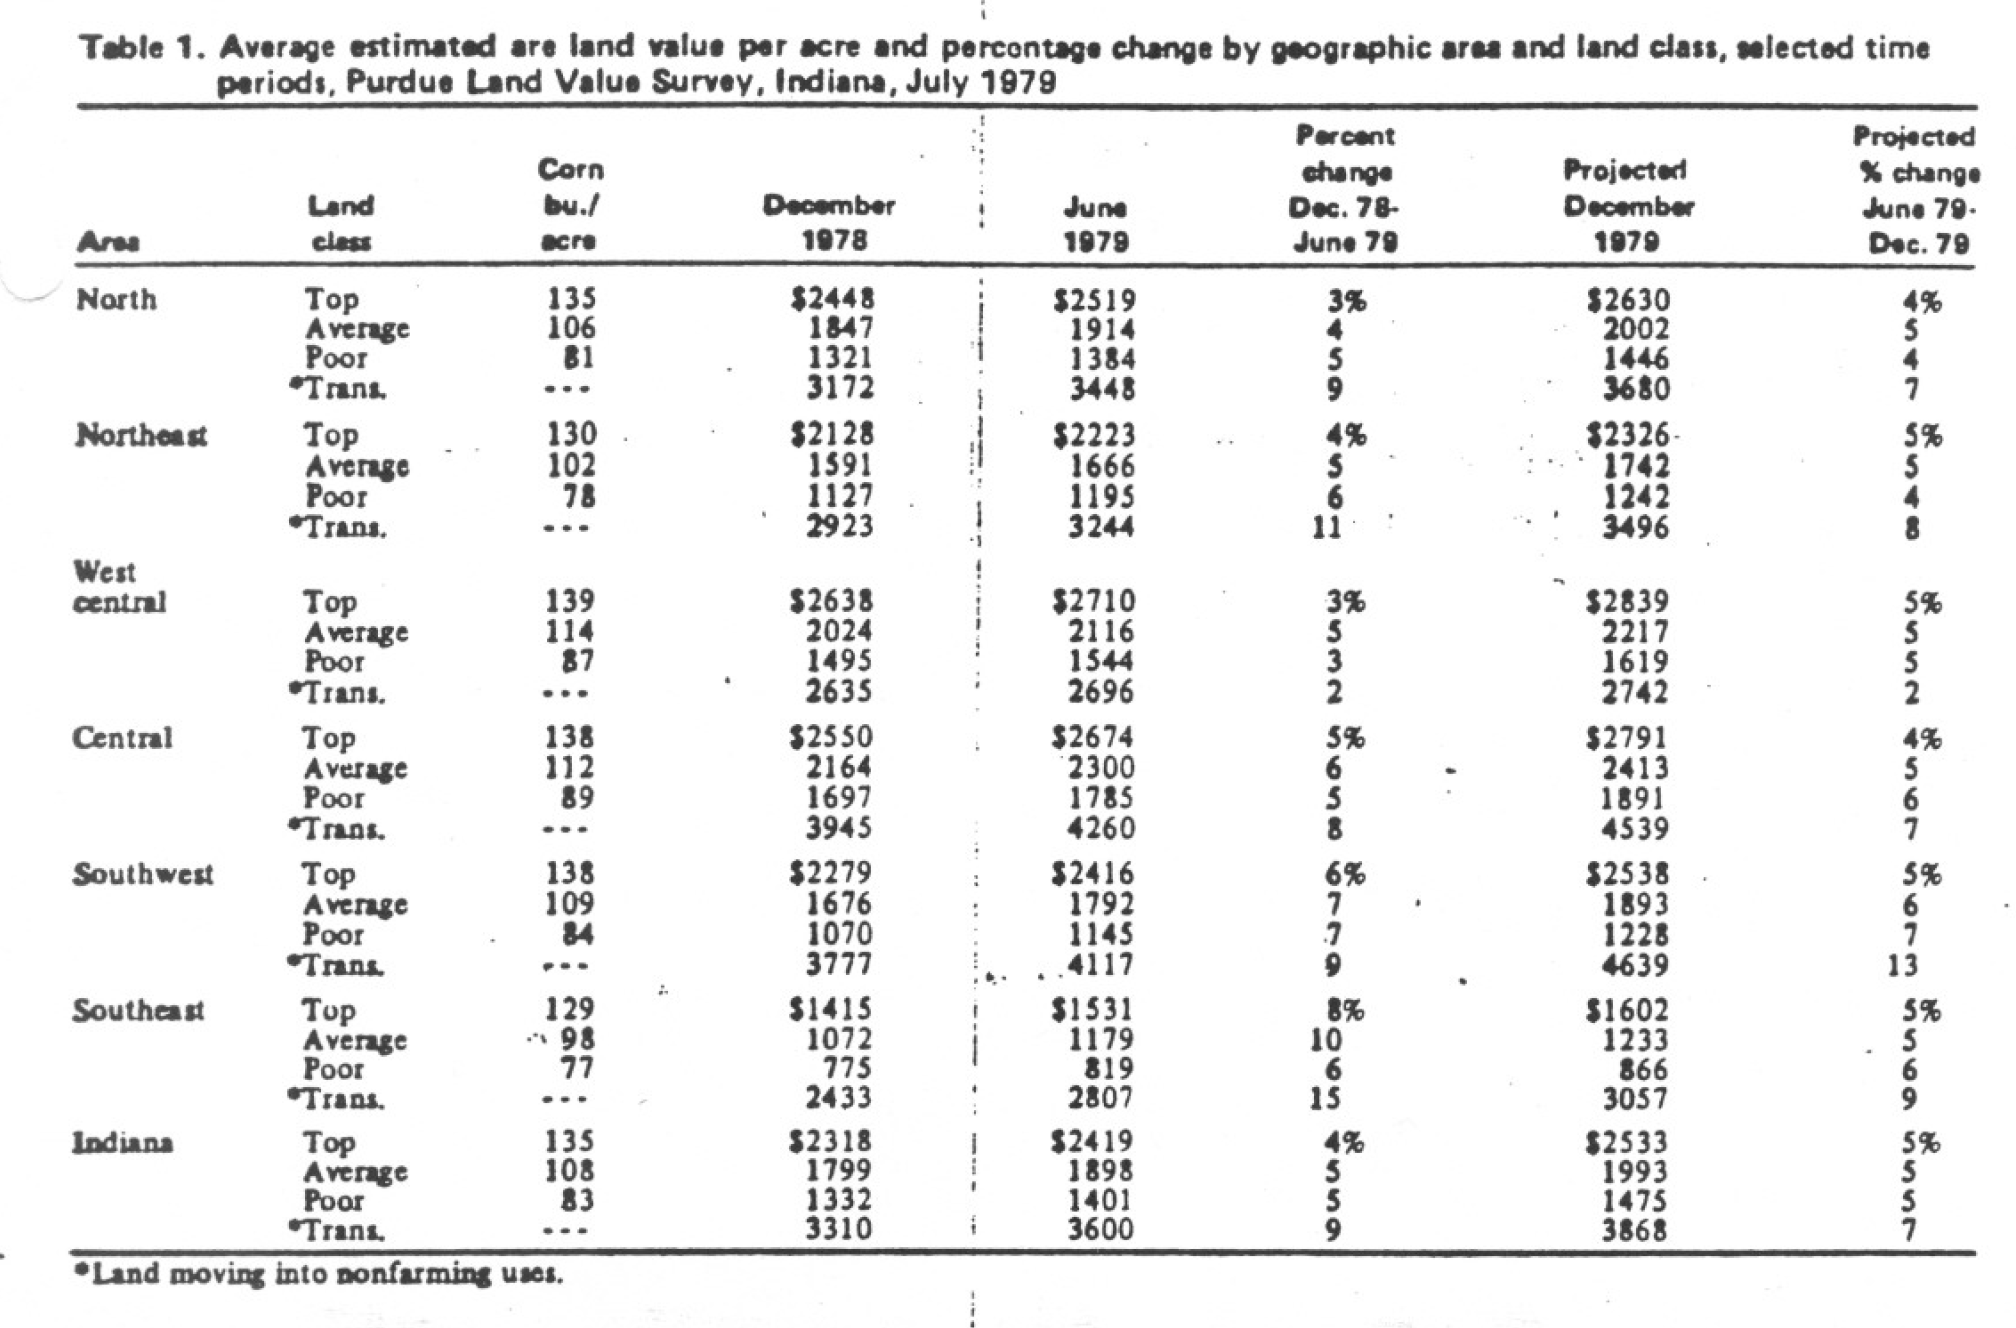
Table 1. Average estimated bare land value and percentage change per acre by geographic area and land class, selected time periods. Purdue Land Value Survey. Indiana. July 1979
One of the purposes of the survey is to obtain information on movements in land prices during the first half of the year (Dec-June). State-wide farmland values were estimated to have increased about 4 to 5 percent from December ’78-June ’79. Two other conclusions are evident from Table 1.
- In every area, average land was reported to have risen more than top quality land.
- Land values rose faster in the southwest and southeast areas than in the other areas – 6 to 10 percent versus 3 to 6 percent.
In general, the land market was reported to be noticeably stronger the first half of 1979 than the same period a year earlier. This is not surprising when we recall that in early 1978 the $1.50-1.75 per bushel corn prices of late summer 1977 were still fresh in our minds and many farmers were thinking in terms of $2.00 corn. By spring of 1979, the outlook for both corn and beans was much better than a year earlier.
The highest average land value was again reported in the west central area $2,710 per acre for 139- bushel land; however, top land in the central area was only $36 per acre less, and average land in that area at $2,300 was nearly $200 higher than in the west central area. In all of the other five areas, top and average land values gained on the west central area -e specially in the north and northeast. For example, in the northeast in 1978 the value of average land was only 66 percent as much as in the west central area, but in 1979 this figure was 79 percent (Table 2).
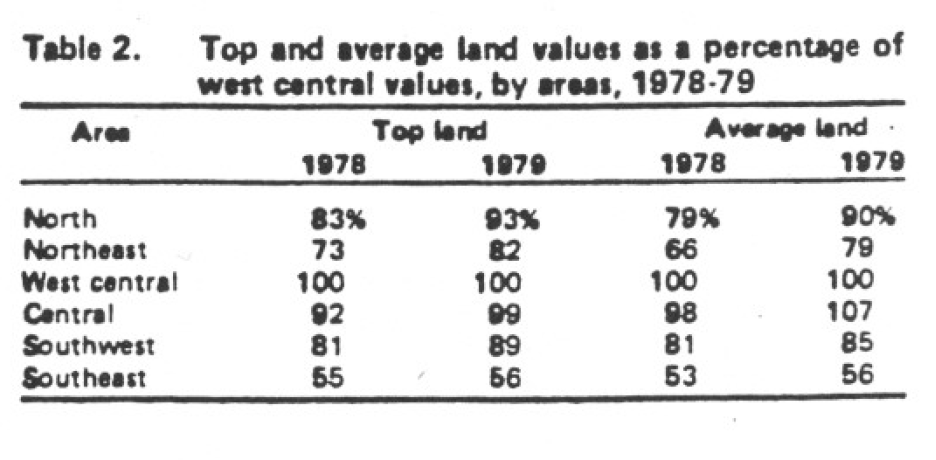
Table 2: Top and average land values as a percentage of west central values, by areas, 1978-79
What this means, or course, is that land values rose over the past year relatively less in the west central area than in other areas. In fact, top and average land values in the west central area in June 1979 were reported to be within $6 and S7 of the values reported a year earlier. The average value of top land in this heavy cash grain area thus is still about $150 per acre less than in 1977, although average land is $50 higher. The fact that land values were reported to have risen 3 to S percent from December 78 to June 79 in the west central area implies that there was some weakness in values the last half of 1978 or respondents felt in 1979 that they had over-estimated values a year earlier. In contrast, increases over the past year in the top and average land ranged from 13 to J 9 percent in the north and northeast; 8 to 12 percent in the central area; and 3 to 10 percent in the two southern areas. State-wide, the increase from June ’78 to June ’79 was 8 or 9 percent; somewhat below the USDA estimate of 15 percent for the year ending in February but practically the same as the Federal Reserve Bank of Chicago estimate of 9 percent for the year ending July 1.
A helpful “rule of thumb” in evaluating different qualities of crop land is the land value per-bushel of average corn yield, or value per acre divided by estimated yield. (Of course, management levels: affect actual yields, so yield estimates should be based on typical management levels.) The value per bushel for top quality land in the west central area was $19.50 (sec Table 3). This figure was practically the same as last year, but estimates for average and poor land was slightly less than last year, as was true for poor land in the southwest. In all other cases, the value per bushel was higher in 1979 than in 1978, generally in the rand of $1 to $3 increase.
The highest value per bushel was for average land in the central area -$20.54. Logically, one would expect per bushel figures to increase as land quality increased to reflect the spreading of fixed costs over more bushels. This was the case except in going from average to top land in the central and southeast areas.
Land values per extra bushel of estimated yield going from average to top land, were $20.86 in the north, $19.89 in the northeast and $21.52 in the southwest. In the west central area the figure was $23.76 and in the central area only $14.38. This suggests that average land in the central area is overpriced relative to top land.
Assuming land with an estimated corn yield of 110 bushels and adjusting the land value for yield differences (value of average land plus or minus the product of the value per extra bushel going from average to top land times the departure in reported yields from 110 bushels) indicates the following values from 110-bushel land:
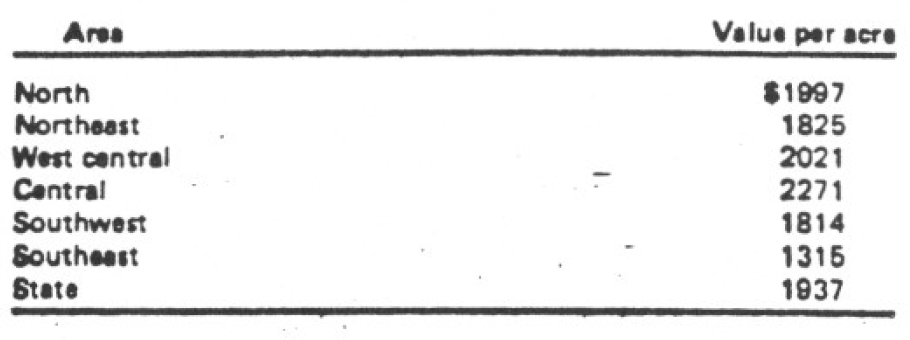
Table A: Value per acre by area (land with estimate yield expectation of 110 bushels per acre)
The difference from one area to another in these values narrowed in 1979. Except for the extreme high of $2,271 in the central area and the low of $1,315 in the southeast, the only difference is only about $200, last year it was nearly $400 for these same areas. The relatively high estimate for the central area may reflect the profitability of hogs in 1977, 1978, and early 1979.
Cash rent for average bare land at $92 (state average) was up $4 per acre over last year. The USDA estimate a state average for cropland of $90.49, up from $85.54 last year.
Cash rent per bushel of estimated yield on top and average land varied from about 70 to 75 cents in the south to nearly $1.00 in the central area (Table 4). Availability of grain storage and drying facilities could easily add 10 cents or more per bushel.
Cash rents as a percentage of land values were about 6 percent in the southwest and from 4.3 percent to 5.2 percent in other areas. The state wide average was 4.8 percent, down from 5.1 percent last year.
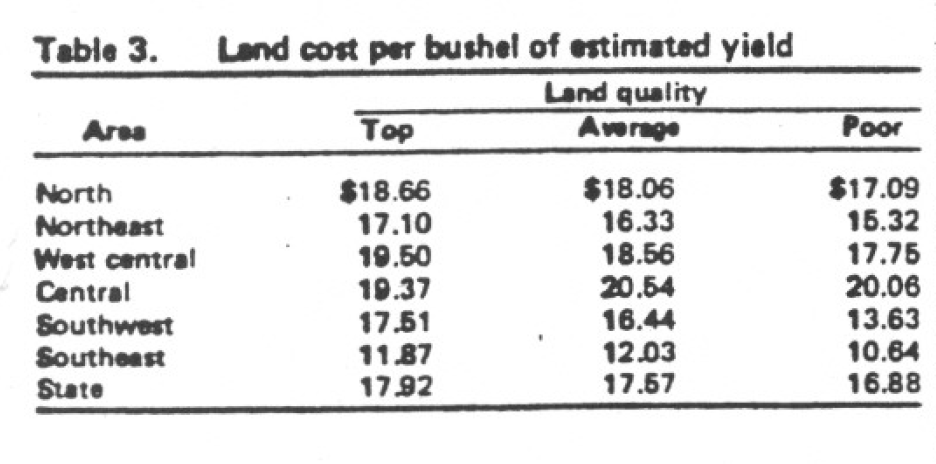
Table 3. Land cost per bushel of estimated yield
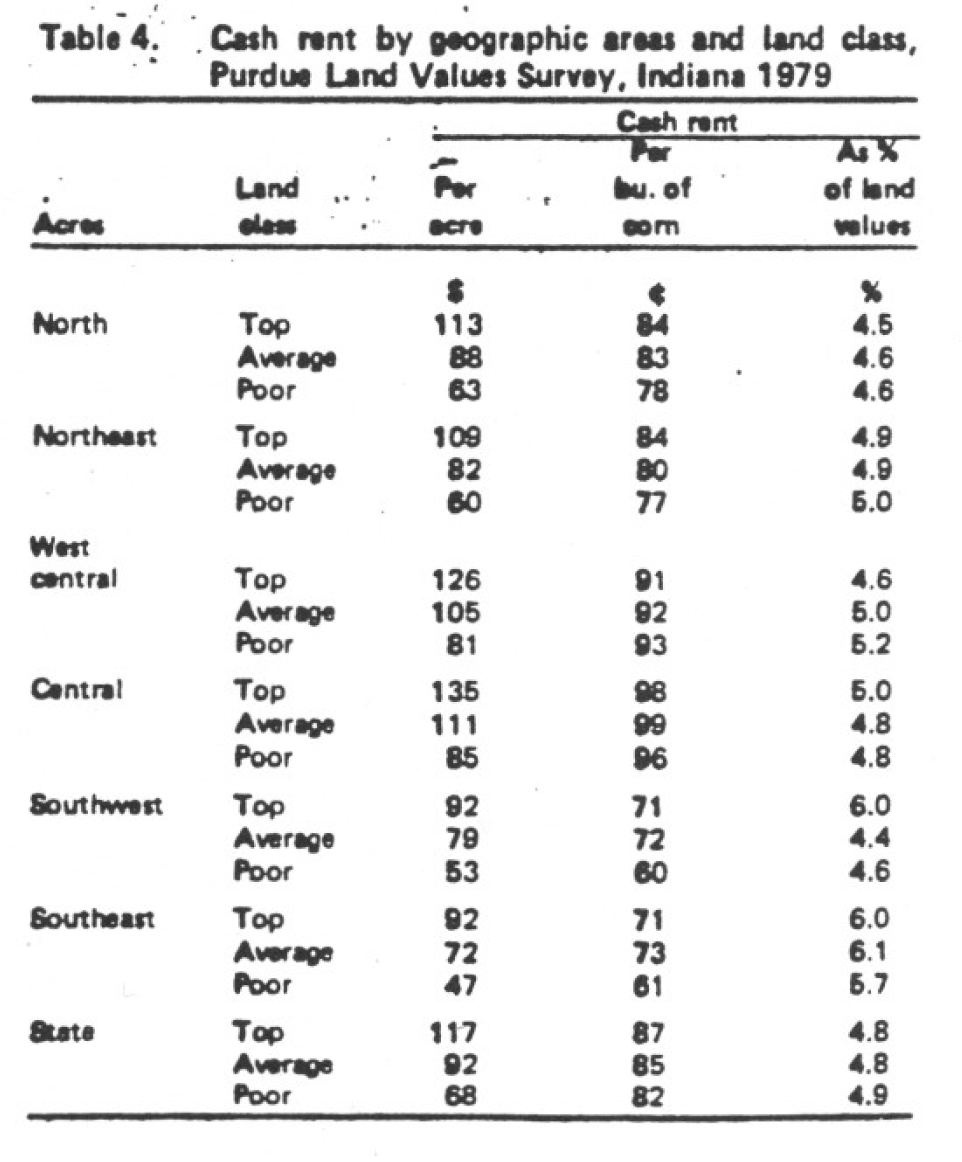
Table 4. Cash rent by geographic areas and land class, Purdue Land Values Survey, Indiana 1979
What of the future?
Much depends upon corn and: bean prices and earnings from livestock enterprises. Even with ups and downs in grain prices, the outlook is better than a year earlier. Land prices could easily move up by December by the 4 to 7 percent (5 percent statewide} projected by survey respondents. Heavy cash grain areas could increase more and areas heavily dependent upon hogs less, in view of the unfavorable hog outlook.
Over the longer run, the survey average projection was a 28-percent increase in land prices in 5 years or an annual compound rate of 5 percent. This would appear modest in view of their estimated average year on-farm price of $2.83 per bushel for corn and. $7.40 for beans. With farm mortgage interest rates at 10 percent or more and annual operating returns to total land investment of under 5 percent, many landowners will no doubt be disappointed if the annual price increase is not at least S percent, and they probably arc hoping for mor! In other words, the present price of land indicates the anticipation of at least a 5-percent annual increase. But opinions vary widely from no change in 5 years to a 50 percent or more increase.
For the operating farmer who can profitably use additional land (perhap5 spreading fixed costs over more acres or purchasing a base of operation), who can handle the cash flow requirements and who purchases near the “market price” with the expectation of 5 to 7 percent annual income value, investment in land at this time probably makes sense.
![]()
![]()
![]()
![]()
![]()
