Increasing the Value of Manure with a Variable Rate Fertilization Program
May 13, 2004
PAER-2004-5
Dayton Lambert, J. Lowenberg-DeBoer and Gary Malzer
![]()
![]()
![]()
![]()
![]()
Some custom manure handling services are starting to offer site-specific application. From an engineering standpoint site-specific manure application equipment is very similar to that used for variable rate application (VRA) of liquid fertilizer, but from a management point of view, variable rate manure is quite different from VRA of fertilizer. The key difference is that manure is highly variable in nutrient content. This variability can be reduced, but not eliminated, by agitation and calibration. Partly as a result of this variability, it has proven more difficult to estimate site-specific crop response to manure than to fertilizer. Also because site-specific manure application is quite new, not all producers have access to this service. The goal of this article is to summarize the results of a recent study of the economics of site-specific manure application. The results of this study will be of particular interest to farmers, manure custom application providers and agencies dealing with regulation of livestock waste.
VRA fertilizer has become quite common since it was first introduced in the late 1980s. Variable rate manure (VRM) has only recently been introduced. Over half of all fertilizer retailers in the U.S. offer some kind of computer controlled VRA. Most Corn Belt farmers have access to this service. The most recent USDA estimates indicate that about 11%of all corn received some VRA fertilizer in 2000. There are at least six companies that currently manufacture variable rate manure application equipment.
Experimental Design
The variable rate manure experiment was conducted in cooperation with the University of Minnesota and Christensen Farms, near Sleepy Eye, Minnesota. Corn grown during the 1999 season was followed by soybean in 2000. Four rates of liquid swine manure, including a check strip (0, 2000, 4000, 6000, and 8000 gal/acre) were applied over a 10.7 acre field in constant rate strips. Manure was only applied before the corn-growing season. One manure sample was taken from every load at the beginning of the application. This sample was analyzed for nitrogen (N), phosphorous (P), and potassium (K) content. No manure was applied prior to planting soybean. Manure was applied via surface broadcast and immediate incorporation with double discs attached to the applicator. Yield data was collected in 50 foot segments for corn and soybean crops. Grain yield was measured from the center row of each treatment strip using a Massey Ferguson plot combine equipped with a ground distance monitor and computerized Harvest Master weigh-all (Harvest Master, Logon Utah). Every 50 feet, the combine was stopped and the harvest grain weighed.
Site-specific crop response to manure was estimated for management zones based on phosphorous soil test levels (Figure 1). This zonation makes sense because: (1) the candidate management zones are supported by University of Minnesota extension recommendations; (2) P is a convenient proxy since it correlates strongly with zinc (Zn), pH, and %organic matter (%OM) soil tests; and (3) P is a manageable input that has been well-studied in extension and agronomic literature.
In the economic analysis, whole field management and variable rate manure strategies are combined with one of three soil fertility management strategies: (1) do nothing
(a whole-field strategy), (2) use soil test information to raise potassium (K), phosphorus (P), or lime levels to whole-field average levels recommended by extension, and (3) to use soil test information to vary P, K, or lime site-specifically. In total, there are six scenarios. Whole field management strategies are evaluated at extension recommendation rates (3500 gal/acre) and the field specific optimal manure rate (4719 gal/acre).
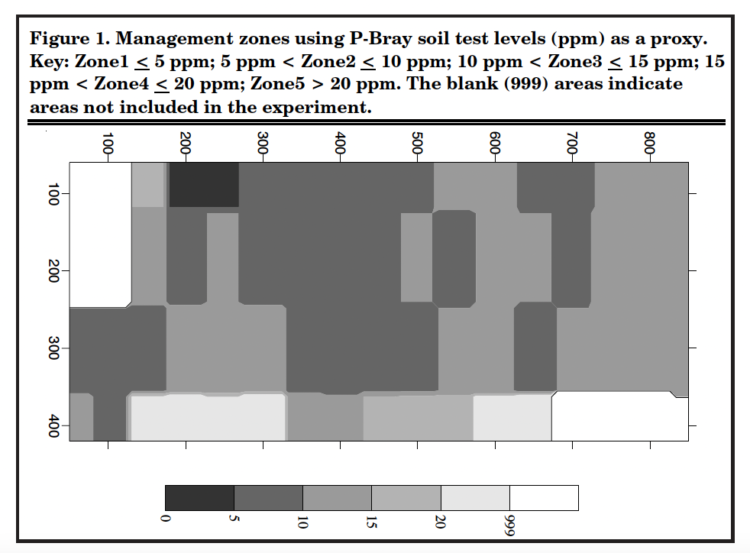
Figure 1. Management zones using P-Bray soil test levels (ppm) as a proxy.
Key: Zone1 < 5 ppm; 5 ppm < Zone2 < 10 ppm; 10 ppm < Zone3 < 15 ppm; 15 ppm < Zone4 < 20 ppm; Zone5 > 20 ppm. The blank (999) areas indicate areas not included in the experiment.
Estimating net Present Value Because manure application, fertilizer spreading and harvest occur in the data over a two year period, the analysis relies on net present value (NPV) to allow for the time value of money. In general NPV discounts costs and returns by a factor that depends on the cost of capital (also known as the discount rate) and the time at which the cost or revenue occurs. Specifically the discount factor is (1+r)-t, where r is the cost of and t is the number of years since the first manure or fertilizer was applied. In this case the NPV is discounted revenue from corn, minus manure application costs, plus discounted revenue from soybeans, minus information costs, the variable rate application fee and fertilizer cost. The discount rate used in this report is 7.5%.
The average cost of a single-product VRA in the Midwest was about $5.64/acre in 2000, and a soil test fee (including lab analysis) averaged $6.11/acre. The price/lb of P2O5 and K2O were $0.28 and $0.15. The price/lb of lime was $0.007. These costs apply only when a producer chooses to adjust P, K, or pH to target levels. Corn and soybean prices used in the analysis were $2 and $6/bu, respectively. For more details on cost, see Lambert et al., 2003.
Results
Statistical analysis of the manure nutrient contents revealed that although the gallons applied manure per treatment are known, the manure N, P, and K content varies (Figure 2). Error bars in Figure 2 show the range of nutrient application for a given application rate. N and K were very consistent sample to sample, but P content varied widely. In particular the 6000 gallon manure application sometimes applied more P than the 8000 gallon treatment.
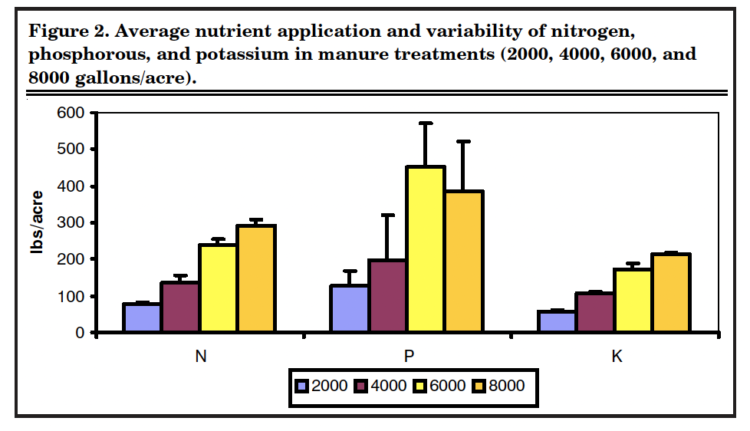
Figure 2. Average nutrient application and variability of nitrogen, phosphorous, and potassium in manure treatments (2000, 4000, 6000, and 8000 gallons/acre).
Using the site-specific crop responses to manure estimated from the on-farm trial data, the maximum NPV of $607/acre is achieved with the variable rate manure strategy, combined with a variable rate fertilizer strategy (Figure 3). The next highest NPV ($605/acre) was achieved by the strategy which Figure 2. Average nutrient application and variability of nitrogen, phosphorous, and potassium in manure treatments (2000, 4000, 6000, and 8000 gallons/acre). applies manure at a field specific optimal rate (WFM*), combined with a variable rate fertilizer pro-gram, followed by the strategy which applies a uniform rate of manure at the extension recommendation rate of 3500 gal/acre combined with variable rate fertilizer ($597/acre).
Profit maximizing manure rates by zone vary from about 2500 gal/acre to 8000 gal/acre (Figure 4). Optimal manure rates are usually lower when some fertilizer is applied to complement the nutrients in manure. The average profit maximizing manure rate for the variable rate manure and fertilizer strategy is 5600 gal/acre. The average economically optimal rate for the variable rate manure strategy using soil test information and following the extension guidelines for variable rate fertilizer is 4800 gal/acre. The extension recommendation of 3500 gal/acre is lower than the average VRM application and may have environmental benefits.
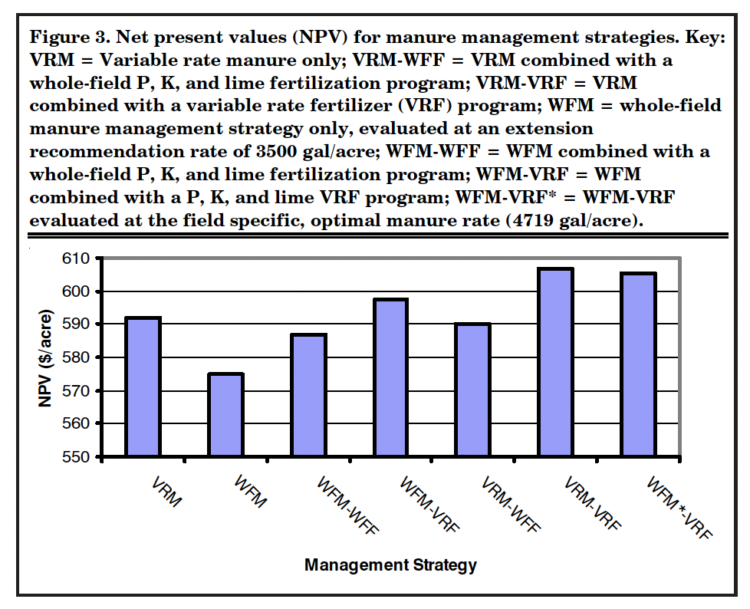
Figure 3. Net present values (NPV) for manure management strategies.
Key: VRM = Variable rate manure only; VRM-WFF = VRM combined with a whole-field P, K, and lime fertilization program; VRM-VRF = VRM combined with a variable rate fertilizer (VRF) program; WFM = whole-field manure management strategy only, evaluated at an extension recommendation rate of 3500 gal/acre; WFM-WFF = WFM combined with a whole-field P, K, and lime fertilization program; WFM-VRF = WFM combined with a P, K, and lime VRF program; WFM-VRF* = WFM-VRF evaluated at the field specific, optimal manure rate (4719 gal/acre).
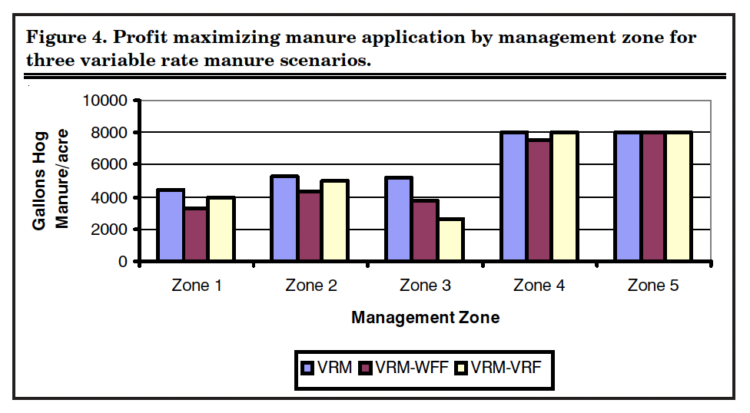
Figure 4. Profit maximizing manure application by management zone for three variable rate manure scenarios.
Conclusions
Given the variability of the nutrient content of manure, it is difficult to argue that the VRM-VRF strategy is a better strategy than the WFM strategy combined with variable rate fertilizer program. The WFM-VRF strategy results in an NPV that is only about two dollars/acre lower than the VRM-VRF approach. Statistically, they are not significantly different. With good agitation and careful calibration, a uniform application of manure is a reasonable goal. With current technology, accurate VRA of manure quantity is possible, but it is difficult to control the actual soil nutrients applied. VRF can be used to more economically and accurately manage soil variability.
For more information:
Lambert, Dayton, Gary L. Malzer, and Jess Lowenberg-DeBoer. 2003. “A Systems Approach Incorporating Soil Test Information into Site-specific Manure Management Recommendations”. Staff Paper #03-13, Purdue University Department of Agricultural Economics, West Lafayette, IN, 47906
![]()
![]()
![]()
![]()
![]()
