Indiana Farm Land Prices
August 1, 1977
PAER-1977-1
Author: J. H. Atkinson, Professor of Agricultural Economics
![]()
![]()
![]()
![]()
![]()
Farm land prices increased at record rates last fall and winter. The USDA reported a state average increase of 32 per cent for the year ending February 1, 1977. The Federal Reserve Bank of Chicago reported a 37 per cent state-wide increase for the year ending April 1 with the central part of the state showing a whopping 44 per cent increase.
The Purdue land values survey indicated even greater increases for the year ending in June 1977. Average increases were reported to be near 50 per cent in the north and west central areas (Figure I). Around 40 per cent in the southwest and 30 per cent in the northeast and central areas.
About 160 farm managers, lenders. appraisers and brokers responded to the Purdue survey. giving their estimates of the value of tillable bare land in December 1976. June 1977 and their projection of values next December. They gave their estimates for three classes of tillable bare land based on corn yields and for transitional land – that moving from agriculture to other uses. Replies came from six geographic areas (Figure I).
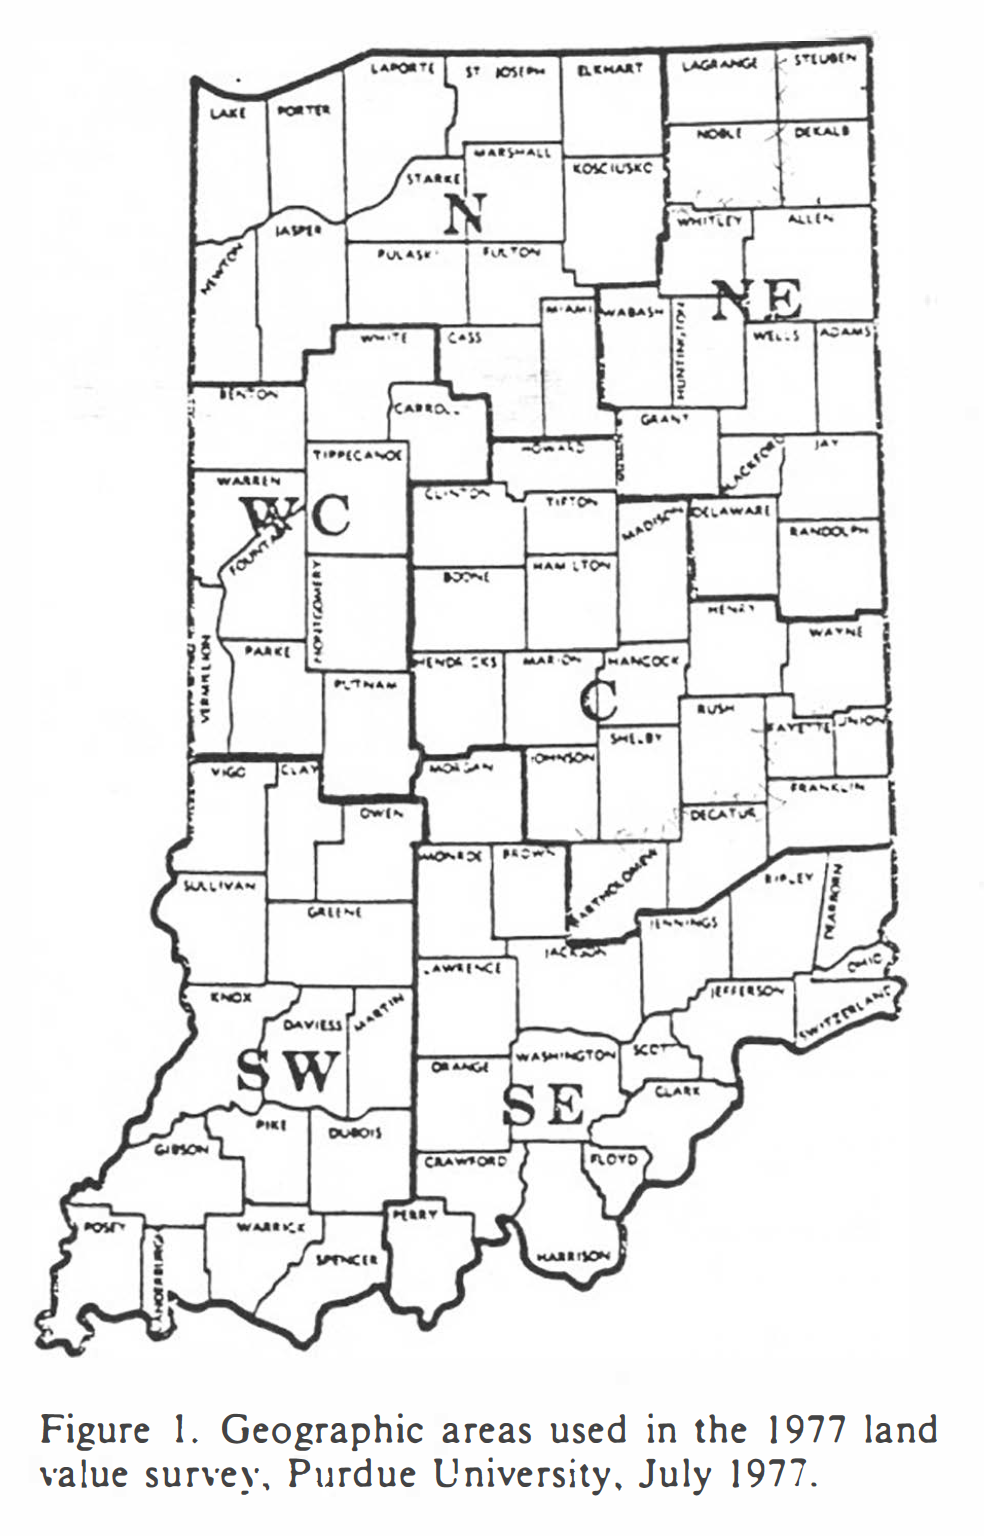
Figure I. Geographic areas used in the 1977 land value survey, Purdue University, July 1977.
For the state as a whole, top quality land estimated to average 133 bushels of corn was reported to be worth about $2150 per acre in June 1977. The estimate for average land (105 bushels per acre) was about S 1600 per acre, with poor land (80 bushels per acre) at $1120 (Table 1).
The highest land values were again reported in the west central area (S2862 for 144-bushel land), followed by the central area (S249 I for 139-bushel land). Top quality land in the northeast area (127 bushels per acre) was estimated to be selling for $2001 per acre, about the same as in the southwest where the yield was estimated to be 142 bushels per acre. Both yield and value estimates were lower in the southeast -$1136 per acre for I 16-bushel land. Land moving from agriculture to other uses had estimated average values of S2200 to $2300 per acre in the southeast and northeast. In other areas. the averages were from about S2900 to $3200 per acre.
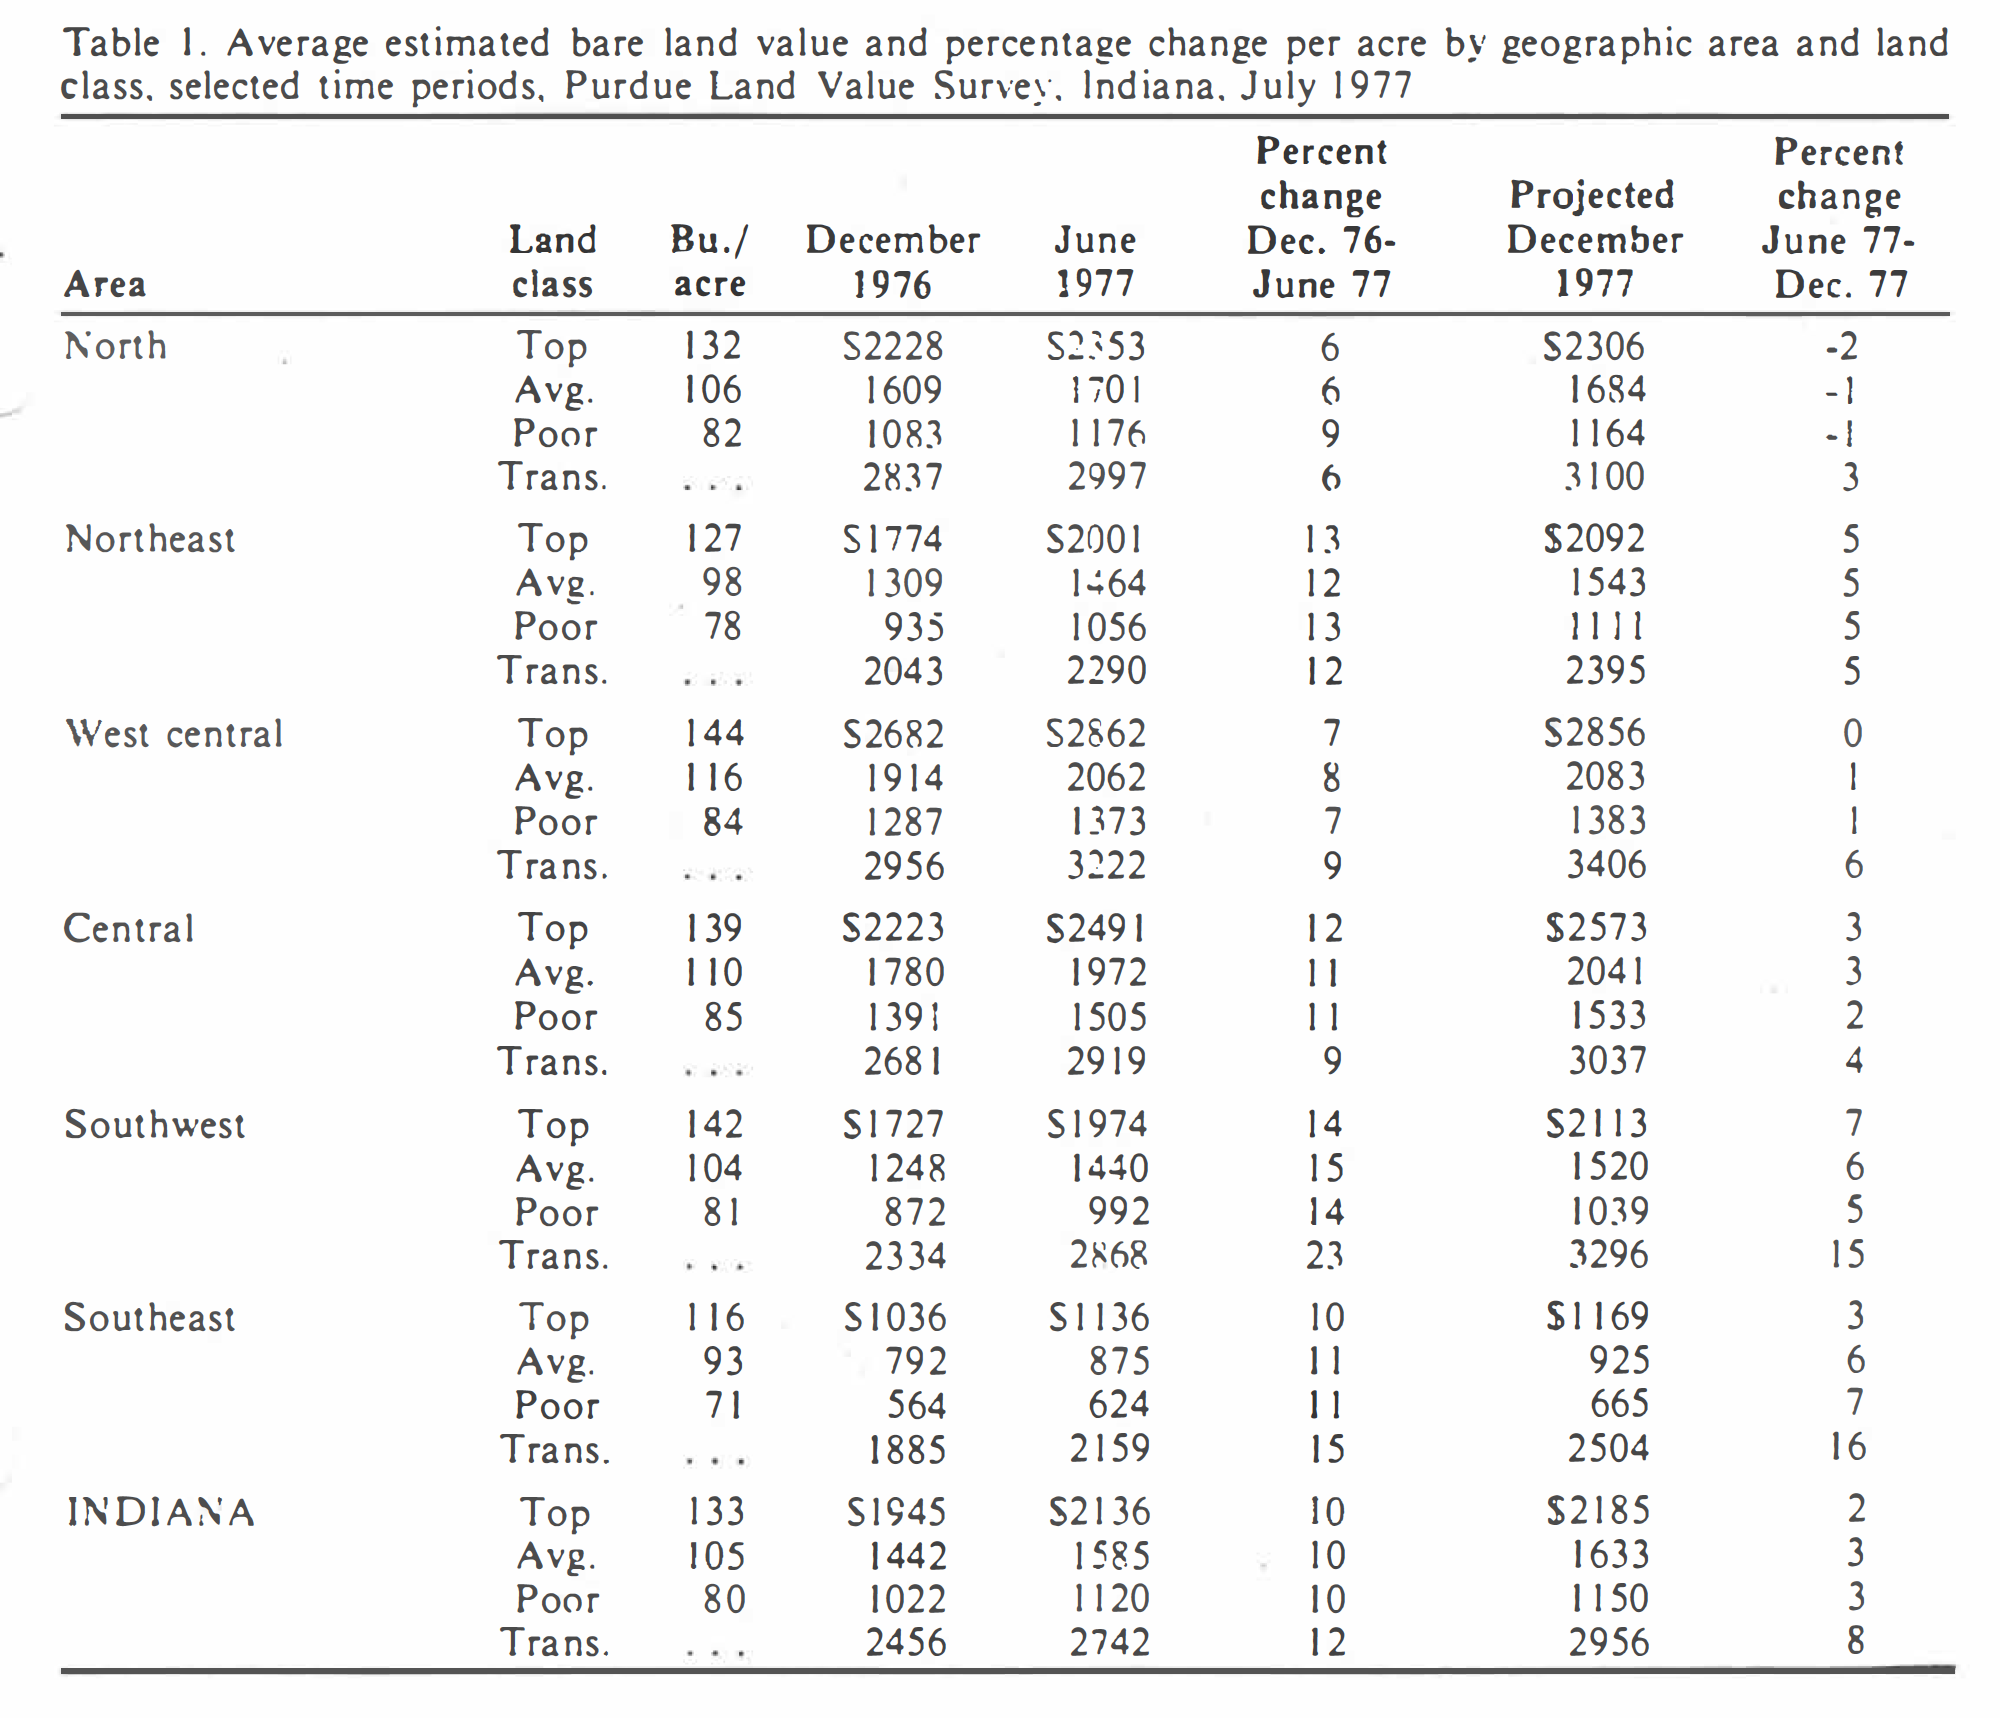
Table I. Average estimated bare land value and percentage change per acre by geographic area and land class, selected time periods. Purdue Land Value Survey. Indiana. July 1977
Adjusted to a 140-bushel per acre yield level. the values per acre were approximately as follows:
West Central $2750
North $2550
Central $2500
Northeast $2250
Southwest $1950
Thus, at the 140-bushel yield level land in the west central area was valued about $200above that in the northern area. Average reported values were about the same in the north and central areas and several hundred dollars lower in the northeast.
What accounts for these differences? Income per farm and the financial strength of farmers probably account for part of the higher land values in the traditionally better farming areas. Other factors may be larger fields. less mixture of land qualities (including permanent pasture, wood, and waste). somewhat lower fertilizer requirements per bushel, easier weed control, less yield variation and easier – worked soils.
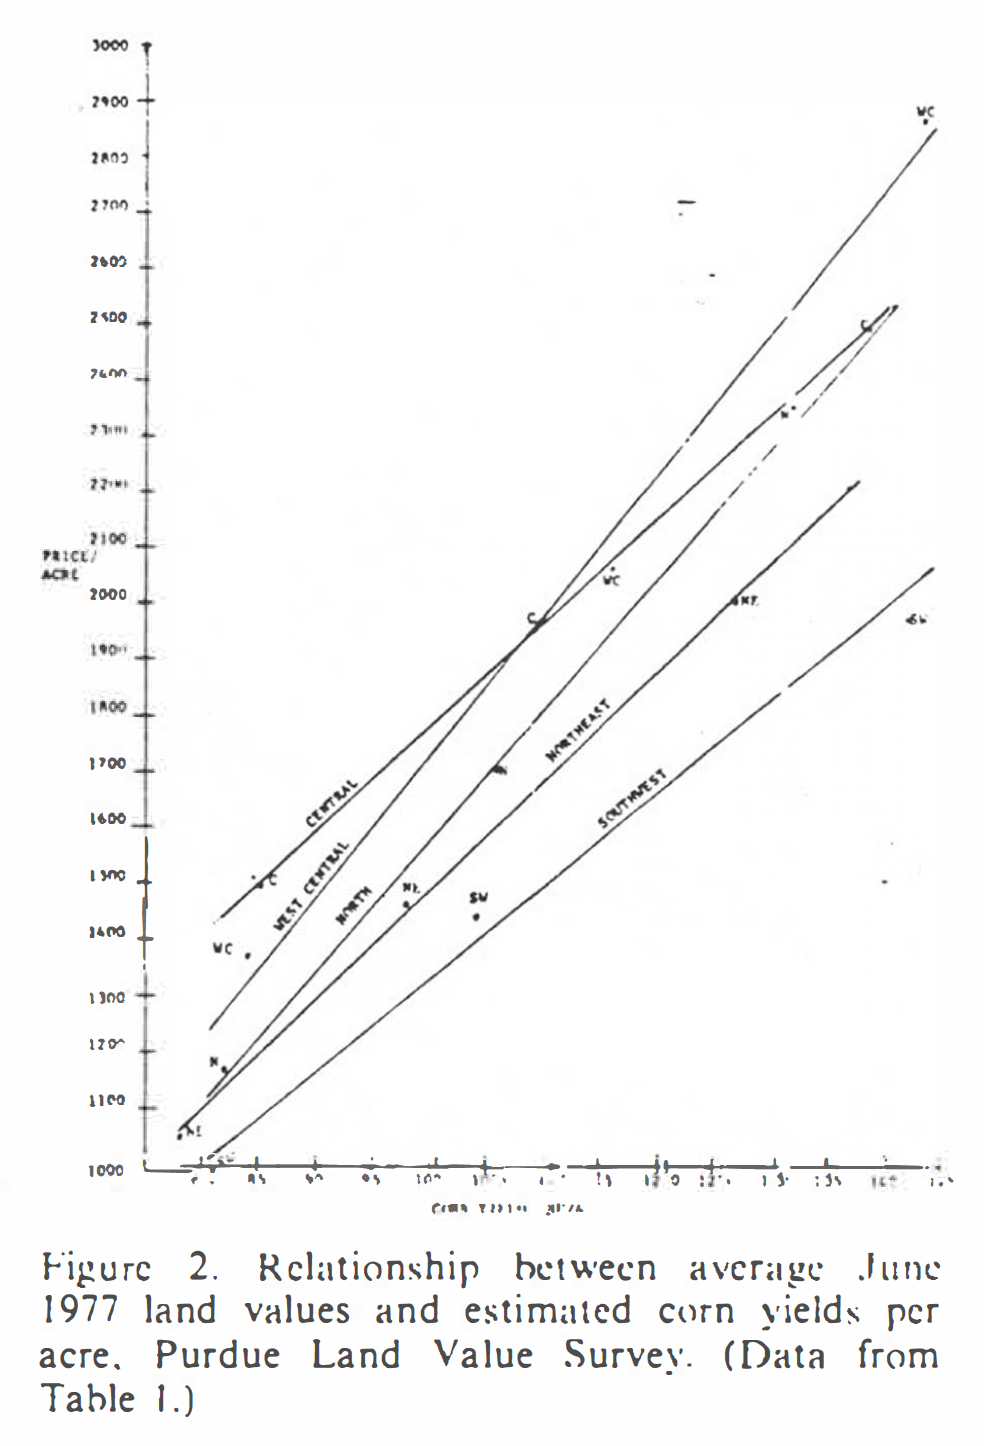
Figure 2. Relationship between average June 1977 land values and estimated corn yields per acre. Purdue Land Value Survey. (Data from Table 1.). Note: this table is illegible in its original and current condition. Including it here since it is referenced in the article. Apologies we do not have a higher resolution option.
In the north and west central areas. the difference in average values was about the same for all qualities of land. But differences became less between the southwest and northeast going from top to poor land, as did the differences between these two areas the north and west central. In the central area. average values for land estimated to yield 110 bushels or less were the highest of all areas. Over the 110-bushel level, land values in this area fell between those in the north and northwest (Figure 2).
Land values per bushel of estimated corn yield were as follows:
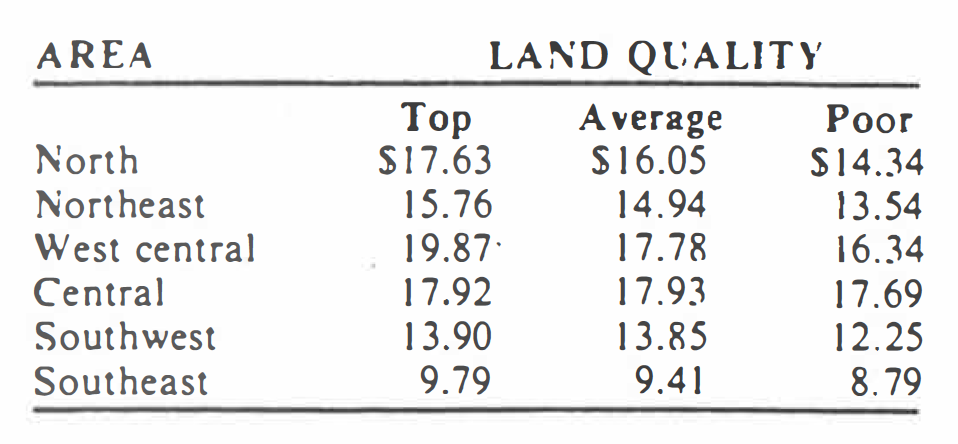
Table 2. Land values per bushel of estimated corn yield.
Except in the central area, higher yielding land was valued higher on a per bushel basis. no doubt reflecting the savings in labor and machinery on higher yielding land.
Land values per extra bushel of estimated yield. going from average to top land, varied from $11.35 the southeast to S28.57 in the west central area with an operating cost of about 60 cents per extra bushel, the return on $28.57 would be only 4.9 per cent with S2.00 corn or 6.3 per cent with $2.40 corn. At a price of $20.00 per bushel. these rates of return would be 7 and 9 per cent.
In the north and west central. the land value per extra bushel productivity was more than 50 per cent greater than the average land value per bushel. In the northeast. added bushels were valued 24 per cent above average and about the same in the southeast. Extra productivity apparently can be had in the central and southwest areas at about the same as average per bushel values. This suggests that higher quality land is underpriced in the central and southwest areas; reasonably priced in the southeast and northeast; and overpriced in the north and west central areas.
Changes in Land Values
On the average. increases of about 10 per cent were reported for the 6-month period ending in June 1977. Increases of 6 to 8 per cent were reported in the north and west central. while the increase in other areas was from 10 to 15 per cent. Transitional land value increases ranged from 6 per cent in the North to 23 per cent in the southwest.
When asked to make a guess about where land values would be next December, respondents were cautiously optimistic. State-wide, slightly over half thought values would be higher. a third lower. and 12 per cent expected a decline. On the average. in the north they expected slight decreases. virtually no change in the west central and increases of 3 to 7 per cent in other areas (Table 1). Most respondents expected land values to be higher 5 years from now – by an average of 28 per cent or about 5 per cent per year.
In 1974. the title of this article asked the question “Is the Land Boom Fizzling?” But even before it went to press. grain prices increased and a comment was attached suggesting that land prices probably would continue to rise. The title in 1975 made the statement. “Land Values May Stabilize”: but late summer crop prospects again resulted in stronger prices and land moved higher. In 1976 we said. “Land Values Continue to Increase.” and they did – at record rates. But a year ago. we made this statement:
“One possibility is this: assume that the 1976 grain crop is in line with current expectations and that 1977 is an average or better crop year. By the end of 1977. grain prices could be well below current levels and profits from hog production much less favorable than at the present time. This likely would cause the bid price of land to fall. and volume of land sales probably would decrease. Land that had to be sold might bring less than it would have a year earlier.”
Corn prices now appear to be at levels which ha Ye been expected (or feared) for the past 3 years – well under $2.00 at harvest time low and prospects for a season average near $2.00 per bushel. What will this do to land prices? Before predicting a sharp decline in land prices, consider the following:
- After corn moved above $2,000 in 1973. it took 3 years for land to be bid up to the point where the operating return to land investment moved down to pre-1973 levels.
- Five-year average price expectations of survey respondents were from $2.53 corn and $6.75 beans.
- Many farmers have had a series of good income years with these results: (a) they have invested heavily in big machinery thus creating a tremendous pressure for farm enlargement; (b) many are in a strong financial position with substantial cash and/ or credit reserves.
- Actions of the current Democratic Administration regarding price support levels are uncertain.
- After hearing about world food shortages for 5 years. many people may believe that poor crops next year in any major agricultural area in the world could cause a significant increase in farm product prices.
- Short-run profit prospects for hog producers are good, and beef feeding profits are at least on the plus side.
But even with these thoughts in mind. the economic consequences of $2.00 corn and wheat are so serious as to raise the question … “What good reason exists for continued increases in land prices?” If this question prevails in the land market. we probably can conclude that the land boom is over – for now, and suggest the following (at the risk of being wrong):
- The genera! level of Indiana land prices as measured by the USDA and the Federal Reserve Bank of Chicago will change very little in the next 6 to 9 months.
- There will be increasing reports of several hundred dollars per acre declines in land values in the months ahead. This will be the highest price land. Part of the “decline” will be random differences in prices that always are present. but part of it will be a real decline in this land which was unreasonably high to begin with. These are the sales where two bidders leave all the others by as much as S500 to $1000 per acre.
- The number of farms sold will decline.
- There will be few “good buys” especially for operating farmers who need additional land – good in terms of prices last spring and good in terms of operating returns.
- If price prospects a year from now are for $2.00 corn and $5.00 beans, land prices might fall by 5-10 per cent by the end of 1979.
- Cash rents may decline for 1978, at least top rents of $150-175
What does this mean to farmers? Basically, what has been said many times before:
- Watch your cashflow – be sure you can make ends meet in a bad year
- Be careful not to leave unsuccessful bidders too far behind.
- When adding to an existing unit. remember that excess machinery and labor may exist only in the short-run and that timeliness may be sacrificed in spreading labor and machinery over more acres.
In addition, present circumstances suggest the following:
- Don’t count on much increase in land values over the next few years.
- Watch for good buys – there are almost always a few, but they may be easier to spot in the months ahead.
- If you get in a serious cash flow bind. consider selling land to an investor buyer who will agree to let you continue farming the land as a tenant.
- Consider cash or share renting for a year or so as an alternative to buying.
- Many farmers have seen “the best of times” in recent years. Now is a time for caution, a time for sharpening up on production and marketing management, a time for careful financial planning. – maybe even a time for “belt tightening” but probably not “the worst of times.”
![]()
![]()
![]()
![]()
![]()
