2011 Indiana Farmland Market Continues to Sizzle
August 1, 2011
PAER-2011-07
Craig L. Dobbins, Professor; Kim Cook, Research Associate
![]()
![]()
![]()
![]()
![]()
Introduction
For Indiana farmland values, it seems that history may be repeating itself. Just like the early 1970s, strong grain prices, robust net farm incomes, favorable interest rates, competitive farmland demand, and a limited supply of farmland offered to the market provides the environment for a strong increase in farmland values. The 2011 Purdue Farmland Value Survey, indicates that the statewide increase in value was 22.8% to 25.3%. Increases this large have not occurred since 1977.
State-wide Farmland Values
For the state as a whole, the 2011 survey found the average value of bare Indiana cropland ranged from $4,386 per acre for poor quality land to $6,521 per acre for top quality land (Table 1). Average quality cropland had a value of $5,468 per acre. For the 12-month period ending June 2011, the value of top, average, and poor quality land increased 22.8%, 23.7% and 25.3%, respectively.
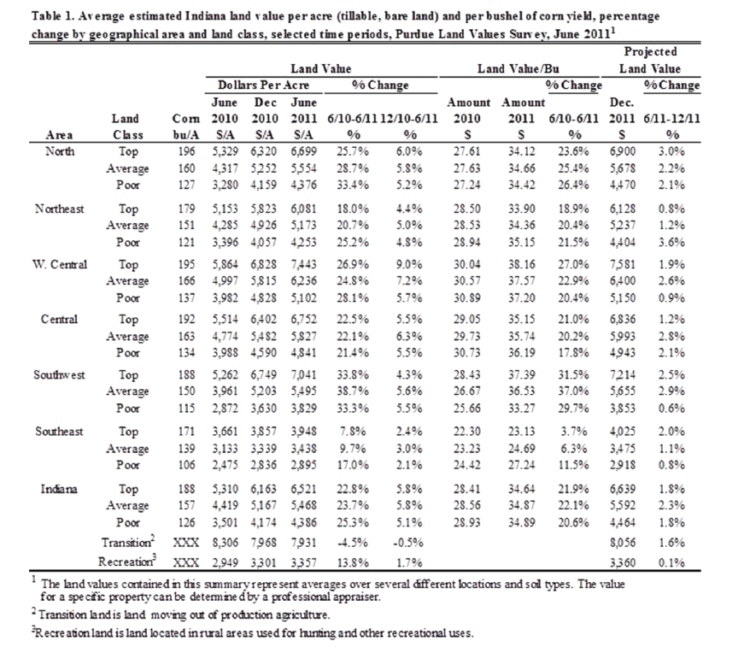
Table 1. Average estimated Indiana land value per acre (tillable, bare land) and per bushel of corn yield, percentage change by geographical area and land class, selected time periods, Purdue Land Values Survey, June 2011
To assess the productivity of the various land qualities, survey respondents estimated long-term corn yields for poor, average, and top quality land. The average of these long-term corn yield estimates provides one measure of land productivity. For the state, the average long-term corn yields for poor, average, and top quality land were 126, 157, and 188 bushels per acre, respectively. State-wide, the value per estimated bushel of corn yield for poor, average, and top land qualities was $34.89, $34.87 and $34.64 per bushel, respectively.
The transitional land market, farmland moving out of agriculture, continues to be soft. For the fourth straight year, the average value of transitional land declined. In 2011 the average value was $7,931, a decline of 4.5%. The estimated value of land in this market continues to have a wide range. In June 2011, transitional land value estimates ranged from $1,000 to $30,000 per acre. This is a specialized market with the transitional land value strongly influenced by the planned use and location. Because of the wide variation in transitional land values, the median value2 may give a more meaningful picture than the arithmetic average. The median value of transitional land in 2011 was $7,250 per acre. This was $250 per acre more than in 2010.
The state-wide average value of rural recreational land used for hunting and other recreational activities is $3,357 per acre, an increase of 13.8% when compared to June 2010. As with transitional land, there is a wide range of values for rural recreational land, again making the median value a more meaningful indictor value than the arithmetic average. The median value for rural recreational land in June 2011 was $3,000 per acre, $200 more than in 2010.
State-wide Rents
Cash rents increased in 2011 contributing to the value of farmland. On average, top quality land rents increased $28 per acre. For average and poor quality land, the increases were $21 and $17 per acre, respectively (Table 2). The average estimated cash rent was $230 per acre on top quality land, $182 per acre on average quality land, and $141 per acre on poor quality land. This was an increase in rental rates of 13.9% for top quality land, 13.0% for average quality land, and 13.7% for poor quality land. State-wide, average rent per bushel of estimated corn yield was $1.12 to $1.22 per bushel.
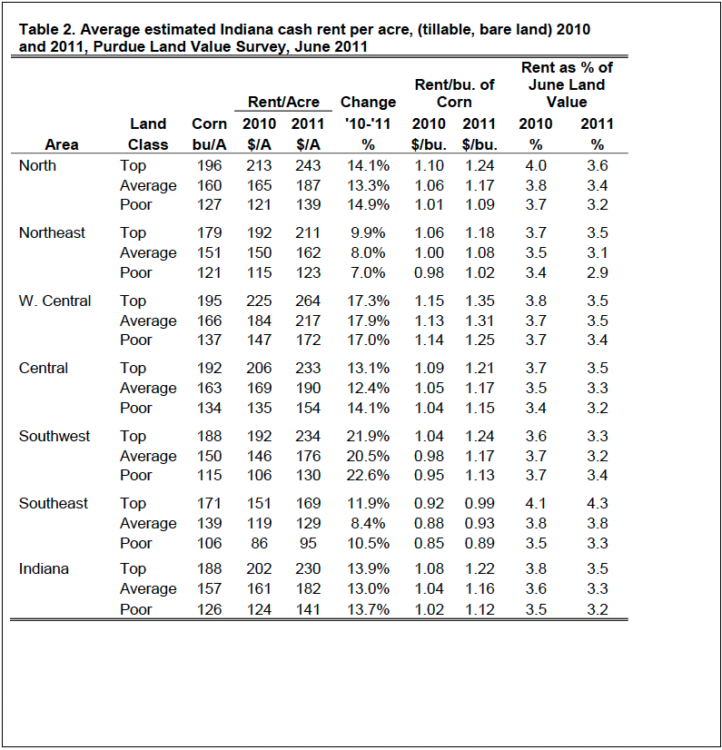
Table 2. Average estimated Indiana cash rent per acre, (tillable, bare land) 2010 and 2011, Purdue Land Value Survey, June 2011
For top quality farmland, cash rent as a percentage of farmland value was 3.5%. For average and poor quality farmland, cash rent as a percentage of farmland value was 3.3% and 3.2%, respectively. These percentage values are the lowest in the 37-year history of the survey. For this 37-year period, rent as a percentage of farmland value has averaged 5.7%.
Area Land Values
Survey responses were organized into six geographic regions (Figure 1). As in the past, there are geographic differences in farmland value changes. This year, the Southwest region reported the strongest percentage increase in farmland values. Bare farmland in this region increased 33.3% to 38.8% (Table 1). This was followed by the West Central and North regions with increases of 24.8% to 33.4%. The Northeast and Central region reported increases of 18.0% to 25.2%. The Southeast region reported the lowest increases, ranging from 7.8% to 17%.
Per acre farmland values are the highest in the West Central region. The value for top, average, and poor quality farmland was $7,443, $6,236, and $5,102 per acre, respectively. The lowest farmland values are in the Southeast. Here top, average and poor quality farmland have values of $3,948, $3,438, and $2,895 per acre, respectively.
Land value per bushel of estimated long-term corn yield (land value divided by bushels) is the highest in the West Central region, ranging from $37.20 to $38.16 per bushel. The North, Northeast, Central, and Southwest reported values ranging from $33.27 to $37.39. The Southeast had the lowest land values per bushel, ranging from $23.13 to $27.24 per bushel.
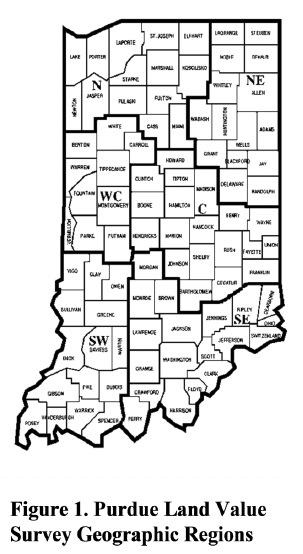
Figure 1. Purdue Land Value Survey Geographic Regions
Area Cash Rents
Changes in cash rent also varied by area. The strongest percentage increase in cash rent was in the Southwest. Here cash rents increased from 20.5% to 22.6% (Table 2). This was followed by the West Central region with increases of 17.0% to 17.9%. The cash rent change in North and Central Indiana ranged from 12.4% to 14.9%. Cash rents in the Northeast and Southeast increased 7.0% to 11.9%.
The highest average per acre cash rent is $264 per acre for top quality land in the West Central region. With a range in per acre rents of $172 to $264, this region has the strongest cash rents across all land qualities. Cash rents are the lowest in the Southeast, $95 to $169 per acre.
Differences in productivity have a strong influence on per acre rents. To adjust for productivity differences, cash rent per acre was divided by the estimated long-term corn yield. Rent per bushel of corn yield in the West Central region ranged from $1.25 to $1.35. Cash rent per bushel of corn yield in the North, Northeast, Central, and Southwest regions ranged from $1.02 to $1.24 per bushel. Per bushel cash rent in the Southeast ranged from $0.89 to $0.99 per bushel.
Distribution of Responses
The data contained in Tables 1 and 2 provides information about the average of the survey responses. Averages are helpful in establishing a general value for farmland and cash rent and the direction in which values and rents are moving. However, it is important to remember that the average is developed from several different responses regarding the perceived value or rent. In some cases, perceptions of those responding might be closely clustered around the average. In this case, survey respondents generally agree. In other cases, the responses may be widely dispersed; respondents have a wide difference in their perceptions. It is possible to have the same or nearly the same average with either set of responses. Figure 2 illustrates these properties. The top of the dark line is the largest perceived value reported by respondents in the area for land of the specified quality. The bottom of the dark line indicates the smallest perceived value. The horizontalbar along the right side of the line indicates the average.
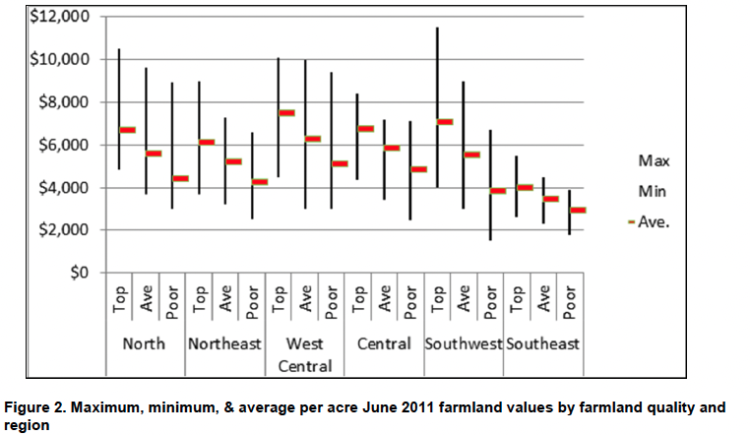
Figure 2. Maximum, minimum, & average per acre June 2011 farmland values by farmland quality and region
Consider top quality land in the North region. The range of perceived values was from about $5,000 per acre to over $10,000 per acre. This is a wide range. The average of the responses was $6,699 per acre, a value closer to the per acre minimum than maximum. This indicates there were a greater number of responses in the lower part of the range. For top land in the Central region there is more agreement, a smaller range. In addition, the average is more in the center of the range. For this situation, the respondents’ perception of value is distributed more evenly across a smaller range.
Figure 3 illustrates the same information for cash rents. In both the case of farmland value and cash rent, the survey provides a general guide to value or rent but does not indicate the value or cash rent for a specific farm. Arriving at a value or amount of cash rent for a specific farm requires additional research or assistance from a professional.
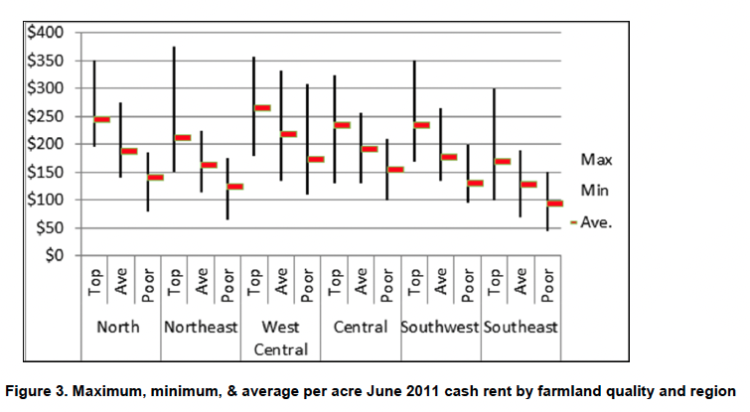
Figure 3. Maximum, minimum, & average per acre June 2011 cash rent by farmland quality and region
Rural Home Sites
Respondents were asked to estimate the value of rural home sites with no accessible gas line or city utilities located on a blacktop or well-maintained gravel road. These properties have a very wide range in value. Because of this wide range, median values, the value at the midpoint of the range, is used as a measure of value for these properties. The median value for five-acre home sites ranged from $7,500 to $9,000 per acre (Table 3). For the first time in several years, all the regions reported an increase in median values.
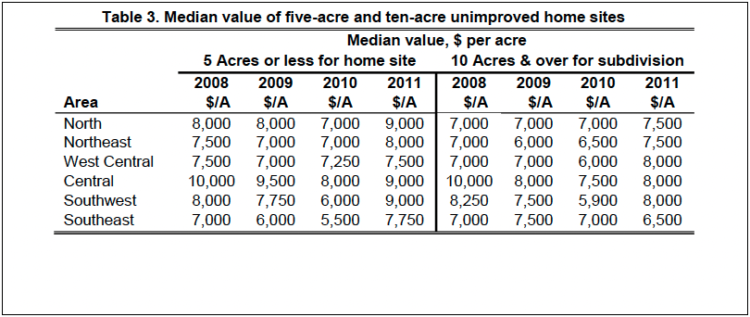
Table 3. Median value of five-acre and ten-acre unimproved home sites
Estimated per acre median values of the larger tracts (10 acres) ranged from $6,500 to $8,000 per acre. Compared to 2010, all regions except the Southeast exhibited an increase in median value. The Southeast median value was less than in 2010.
For 2011, the home site data indicates that the decline in the value of rural housing sites may be ending. Values in all regions have not returned to the values reported in 2008, but it appears that respondents are more positive about rural housing site values.
Changes in Farmland Supply & Demand
To assess changes in the supply of land on the market, respondents were asked to provide their opinion of the amount of farmland on the market now compared to a year earlier. The respondents indicated either more, the same, or less land was on the market than one year ago. For 2011, most respondents indicated there was the same (39%) or less (38%) land on the market (Figure 4). The remaining 23% of the respondents indicated there was more land on the market. It appears the high prices have convinced at least some landowners that now is a good time to sell. However, the supply of farmland still remains tight with nearly 77% of the respondents indicating that the amount of land on the market is the same or less than last year.
The respondents also provided their opinion on the number of farmland transfers the past 6 months compared to a year earlier. They could respond with more, less, or the same. Forty-one percent of the respondents indicated there were more transactions, 40% indicated the same, and 20% indicated fewer transactions. In 2010, the percent of respondents indicating there were more, the same, or fewer, were 20%, 36%, and 44%, respectively. These responses indicated that there has been a significant up-tick in the number of respondents indicating increased transactions and a significant decline in number reporting fewer transactions.
Respondents were also asked to provide their perception of changes in demand for farmland. One source of farmland demand is farmers seeking to expand the size of their business. Respondents indicate if farmer demand increased, remained the same, or decreased when compared to a year earlier. In 2009 and 2010, the number of respondents indicating increased demand that respondents are more positive about rural housing site values.
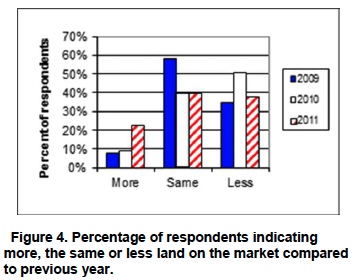
Figure 4. Percentage of respondents indicating more, the same or less land on the market compared to previous year.
Changes in Farmland Supply & Demand
To assess changes in the supply of land on the market, respondents were asked to provide their opinion of the amount of farmland on the market now compared to a year earlier. The respondents indicated either more, the same, or less land was on the market than one year ago. For 2011, most respondents indicated there was the same (39%) or less (38%) land on the market (Figure 4). The remaining 23% of the respondents indicated there was more land on the market. It appears the high prices have convinced at least some landowners that now is a good time to sell. However, the supply of farmland still remains tight with nearly 77% of the respondents indicating that the amount of land on the market is the same or less than last year.
The respondents also provided their opinion on the number of farmland transfers the past 6 months compared to a year earlier. They could respond with more, less, or the same. Forty-one percent of the respondents indicated there were more transactions, 40% indicated the same, and 20% indicated fewer transactions. In 2010, the percent of respondents indicating there were more, the same, or fewer, were 20%, 36%, and 44%, respectively. These responses indicated that there has been a significant up-tick in the number of respondents indicating increased transactions and a significant decline in number reporting fewer transactions.
Respondents were also asked to provide their perception of changes in demand for farmland. One source of farmland demand is farmers seeking to expand the size of their business. Respondents indicate if farmer demand increased, remained the same, or decreased when compared to a year earlier. In 2009 and 2010, the number of respondents indicating increased demand from farmers was around 50% (Figure 5). In 2011 this increased to 73% of the respondents. The number of respondents indicating the same farmer demand declined to 24%. Only 3% indicated that farmer demand had declined.
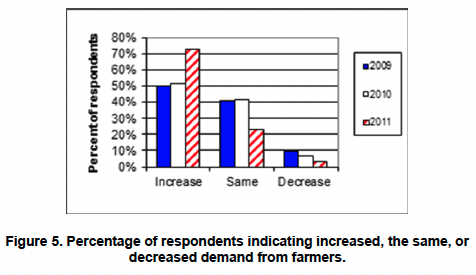
Figure 5. Percentage of respondents indicating increased, the same, or decreased demand from farmers.
Before the downward correction in the housing market, credit crisis, and recession, converting farmland to rural home sites was a strong source of demand. From 2007 to 2011, demand from this source has changed significantly.
In 2007, 56% of the respondents indicated an increase in demand for rural residences. In 2010, only 11% indicated an increase in demand from this source. In 2010 and 2011, 58% and 53% of the respondents, respectively indicated a decrease in demand from this source. In 2007, only 9% of the respondents indicated a decrease in demand for rural residences. This trend indicates there has been a significant reduction in demand for rural residences.
Nonfarm investors also contribute to the demand for farmland. Respondents indicated if they perceived an increase, the same, or a decrease in demand from individual investors as well as investment funds, such as pension funds. The percentage of respondents indicating an increased interest from nonfarm investors increased from 32% in 2010 to 48% in 2011 (Table 4). The percentage of respondents indicating the same or less interest by nonfarm investors both declined. The largest decline came from respondents indicating a decrease in nonfarm investor interest.
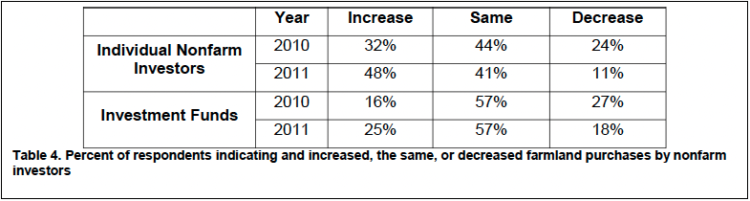
Table 4. Percent of respondents indicating and increased, the same, or decreased farmland purchases by nonfarm investors
There were some similar changes associated with investment funds. Compared to 2010, the number of respondents reporting a decreased interest from investment funds declined. In 2010, 27% of the respondents indicated less interest on the part of investment funds. In 2011, only 18% indicated less interest. There was an increase in respondents indicating an increased interest from investment funds, increasing from 16% to 25%. These changes seem to indicate that in 2011 there was a modest increase on the part of investment funds in making purchases of Indiana farmland.
Expected Grain Prices, Interest Rates, and Inflation
Making a farmland purchase is typically a long term commitment. As a result, expectations regarding crop prices over the next few years can have a strong influence on farmland values. In order to gain insight into crop price expectations, respondents estimated the annual average on-farm price of corn and soybeans for the period 2011 to 2015. This year saw a large increase in the expected five-year average price of corn and soybeans (Table 5). On average, survey participants expect corn prices to average $5.66 per bushel and soybean prices to average $11.59 per bushel over the next five years. If these higher prices materialize and production costs for corn and soybeans do not rapidly increase, returns from crop production will remain strong. However, expectations about prices can change quickly. Just last year, the expected five-year average price for corn and soybeans was much lower. Just like short-term prices long-term price expectations have become much more volatile.
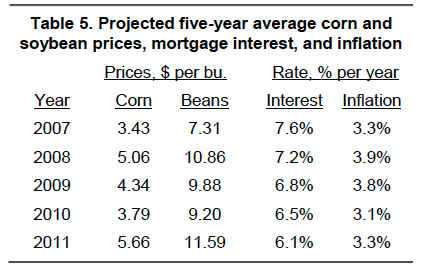
Table 5. Projected five-year average corn and soybean prices, mortgage interest, and inflation
Mortgage interest rates have important implications for real estate markets. Mortgage rates continue to be near historic lows. Survey respondents are expecting mortgage interest rates to remain modest. While many people talk about the potential for increased interest rates, this group is not expecting any sudden change in interest rates.
Inflation rate expectations have reversed direction. On average, survey respondents estimate annual inflation over the next five years will be 3.3%. Since 2007, expectations about long-term inflation have been fairly stable.
Market Influences
To identify additional forces influencing the farmland market, survey respondents were asked to assess the influence of 11 different items. These items included: 1) current net farm income, 2) expected growth in returns to land, 3) crop price level and outlook, 4) livestock price level and outlook, 5) current and expected interest rates, 6) returns on competing investments, 7) outlook for U.S. agricultural export sales, 8) U.S. inflation/deflation rate, 9) current inventory of land for sale, 10) cash liquidity of buyers, and 11) current U.S. agricultural policy
Respondents used a scale from -5 to +5 to indicate the effect of each item on farmland values. A negative influence is given a value from -1 to -5, with a -5 representing the strongest negative influence. A positive influence was indicated by assigning a value between 1 and 5 to the item, with 5 representing the strongest. An average for each item was calculated.
In order to provide a perspective on the changes in these influences, data from 2009, 2010, and 2011 are presented in Figure 6. The horizontal axis of the chart indicates the item from the list above. It comes as no surprise that current net farm income, and crop price level and outlook are the two strongest forces. This is followed by the expected growth in return to land, current and expected interest rates, returns on competing investments, outlook for U.S. agricultural exports, current inventory of land for sale, and current cash liquidity of buyers. These items are all stronger when comparing 2010 and 2011. Livestock price level and outlook, current U.S. agricultural policy, and U.S. inflation/deflation rate provide small positive contributions to the land market.
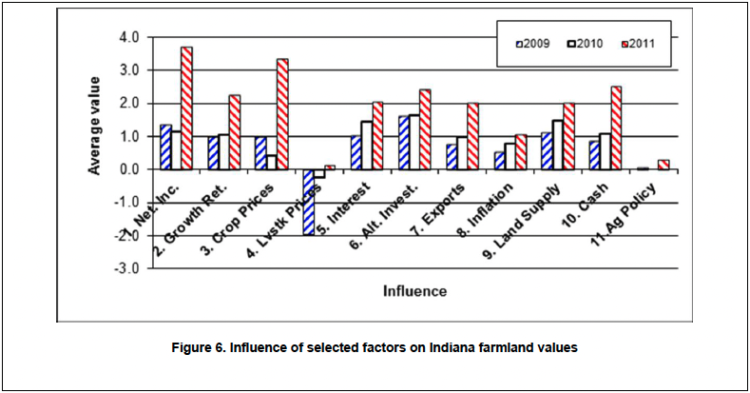
Figure 6. Influence of selected factors on Indiana farmland values
Expected Future Land Values
Expectations about corn and soybean prices, net income, and the other influences impacting the land market indicate strong farmland values. However, participants see the growth rate in farmland values slowing considerably. On a state-wide basis, Table 1 indicates that for the six-month period from June to December 2011, survey respondents expect farmland values to increase by only 1.8% to 2.3%. The regional averages indicate respondents in all regions are expecting farmland value growth to slow significantly. The region expected to have the strongest growth is the North with an increase of 2.1% to 3.0% in farmland value.
Respondents also projected farmland values five years from now. Fifty-nine percent of the respondents expect farmland values to be higher. The average increase for this group was 12.4%. This translates into an average annual increase of 2.4%. Nineteen percent expect farmland values to decline. The average decline for this group was 11.9%. This leaves 22% of the respondents that do not expect any change in land values five years from now. Given the change in farmland value for the past five years, no change in value over five years will be a sharp change in the trend.
When it comes to where farmland values are headed, this group is divided. Fifty-nine percent expect a continued increase in farmland values; but at a much more modest rate. Forty-one percent expect a change in the farmland value trend with no change or a decline in value. The group expecting a decline sees a moderate downward adjustment (12%) over the five year period.
What might happen that would make each group correct? Here are a few influences on the side of continued farmland value increases:
- Strong demand for corn from the ethanol industry because of biofuel mandates
- Strong soybean export demand
- 2011 U.S. corn and soybean crop that is average or below average
- Moderate increases in input costs for corn and soybeans, keeping crop production margins well above historic averages
- Low long term interest rates
- Little change in the amount of land available for sale
- What about influences for those that expect no change or a decline in farmland values?
- Sharp decline in corn and soybean export demand
- Sudden change in the U.S. policy away from providing biofuel subsidies and mandating usage levels
- Sharp rise in interest rates because of a downgrade in the credit rating of U.S. government debt obligations or increased inflation fears
- Exceptionally large 2011 corn and soybean crop
- Sharp rise in crop input prices reducing crop production margins
- Further slowing of world growth because of sovereign debt problems, including the U.S.
- Strong supply response resulting from capital investments in agricultural production stimulated by high grain prices
- U.S. recession brought on by U.S. debt problems or default
- Some combination of the above or some unknown development
While the probability of events triggering a decline in farmland values seems low, the important thing is to assess how such an event would impact the business. In an economic environment with big uncertainties, a useful exercise is to perform a stress test and develop a “Plan B.”
Purdue Land Value and Cash Rent Survey
The Purdue Land Value and Cash Rent Survey is conducted each June. The survey is possible through the cooperation of numerous professionals that are knowledgeable of Indiana’s farmland market. These professionals include farm managers, appraisers, land brokers, agricultural loan officers, Purdue Extension educators, farmers, and persons representing the Farm Credit System, the Farm Service Agency (FSA) county offices, and insurance companies. Their daily work requires that they stay well informed about land values and cash rents in Indiana.
These professionals provide an estimate of the market value for bare poor, average, and top quality farmland in December 2010, June 2011, and the expected value for December 2011. They also provide an estimate of the current cash rent for each land quality. To assess the productivity of the land, respondents provide an estimate of long-term corn yields. Respondents also provide a market value estimate for land transitioning out of agriculture and recreational land.
Responses from 305 professionals are contained in this year’s survey representing all but five Indiana counties. There were 51 responses from the North region, 50 responses from the Northeast region, 64 responses from the W. Central region, 69 responses from the Central region, 34 responses from the Southwest region, and 37 responses from the Southeast region. Figure 1 illustrates the counties in each region.
Appraisers accounted for 20% of the responses, farm loan professionals represented 58% of the responses, farm managers or farm operators provided 12% of the responses, and other professionals provided 10% of the responses.
The data reported here provide general guidelines regarding farmland values and cash rent. To obtain a more precise value for an individual tract, contact a professional in your area that has a good understanding of the local situation.
We express appreciation to Marsha Slopsema of the Department of Agricultural Economics for her help in conducting the survey.
Pasture Rent, Irrigated Farmland, Established Hay, and Grain Storage Rent
The information on pasture rent, rental of irrigated farmland, and rental of on-farm grain storage was updated. The 2011 averages for pasture rent, the market value of and cash rent for irrigated farmland, and the rental of on-farm grain storage are presented in Tables 6, 7, and 9, respectively. The survey this year also included information on the rental rate of established hay ground (Table 8).
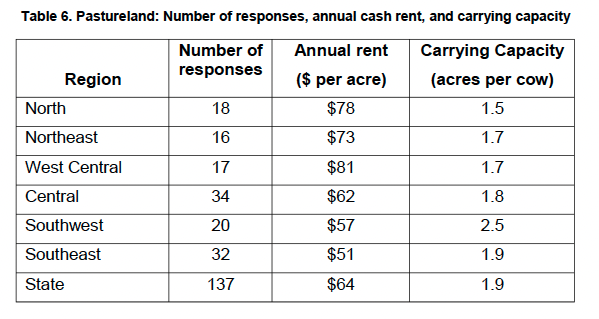
Table 6. Pastureland: Number of responses, annual cash rent, and carrying capacity
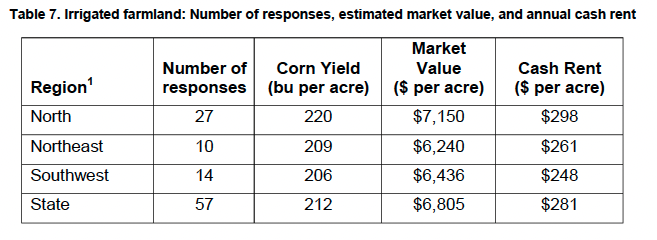
Table 7. Irrigated farmland: Number of responses, estimated market value, and annual cash rent
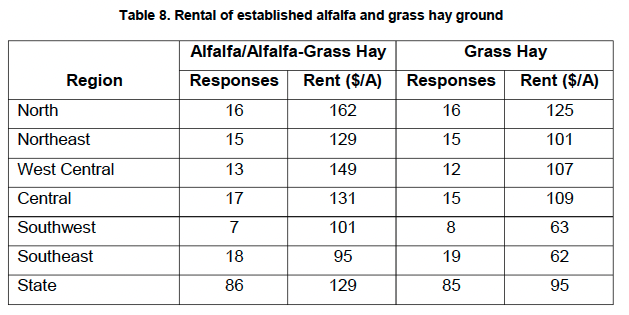
Table 8. Rental of established alfalfa and grass hay ground
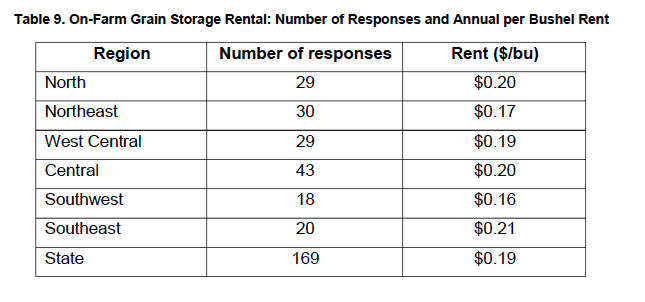
Table 9. On-Farm Grain Storage Rental: Number of Responses and Annual per Bushel Rent
![]()
![]()
![]()
![]()
![]()
