Indiana Farmland Prices Continue to Rise in 2023
August 7, 2023
PAER-2023-26
Todd H. Kuethe, Professor and Schrader Chair in Farmland Economics
![]()
![]()
![]()
![]()
![]()
Indiana farmland prices once again hit a new record high in 2023, according to the recent Purdue Farmland Value and Cash Rent Survey. Statewide, the average price of top quality farmland is $13,739 per acre, up 7.3% from June 2022 (Table 1). Average and poor quality farmland also hit new highs at $11,210 and $8,689 per acre, with an annual increase of 5.8% and 0.7%, respectively. While farmland prices reached a new peak in 2023, the appreciation rate from 2022 to 2023 was much lower than the record high price growth observed between 2021 and 2022.
State-level averages, however, mask the variability in farmland price changes across Indiana (Figure 1). In the Southeast region, for example, farmland prices grew by exceptionally high levels across all three quality grades (36.8%, 45.4%, and 55.8% for top, average, and poor quality lands), but, in the Southwest region, farmland prices fell across all three quality grades (–7.0%, –7.6%, and –10.5%). The highest land values were once again found in the Central region, with an average per acre price of $14,852 for top, $12,576 for average, and $9,657 for poor quality land.
Respondent expectations for the second half of 2023 also vary across regions and land qualities. Respondents expect modest increase in the Southwest region across all quality grades and for top and average quality land in the Southeast region. However, in the remaining classes in regions the respondents expect modest declines in values through December 2023.
The changes in values for farmland transitioning out of agricultural production and those of farmland used for recreational purposes also diverged in 2023. Statewide, the per acre value of farmland transitioning out of agricultural production increased by 4.1% between June 2022 and June 2023 to $25,228. However, the value of recreational land declined by –10.4% to $8,170 per acre.
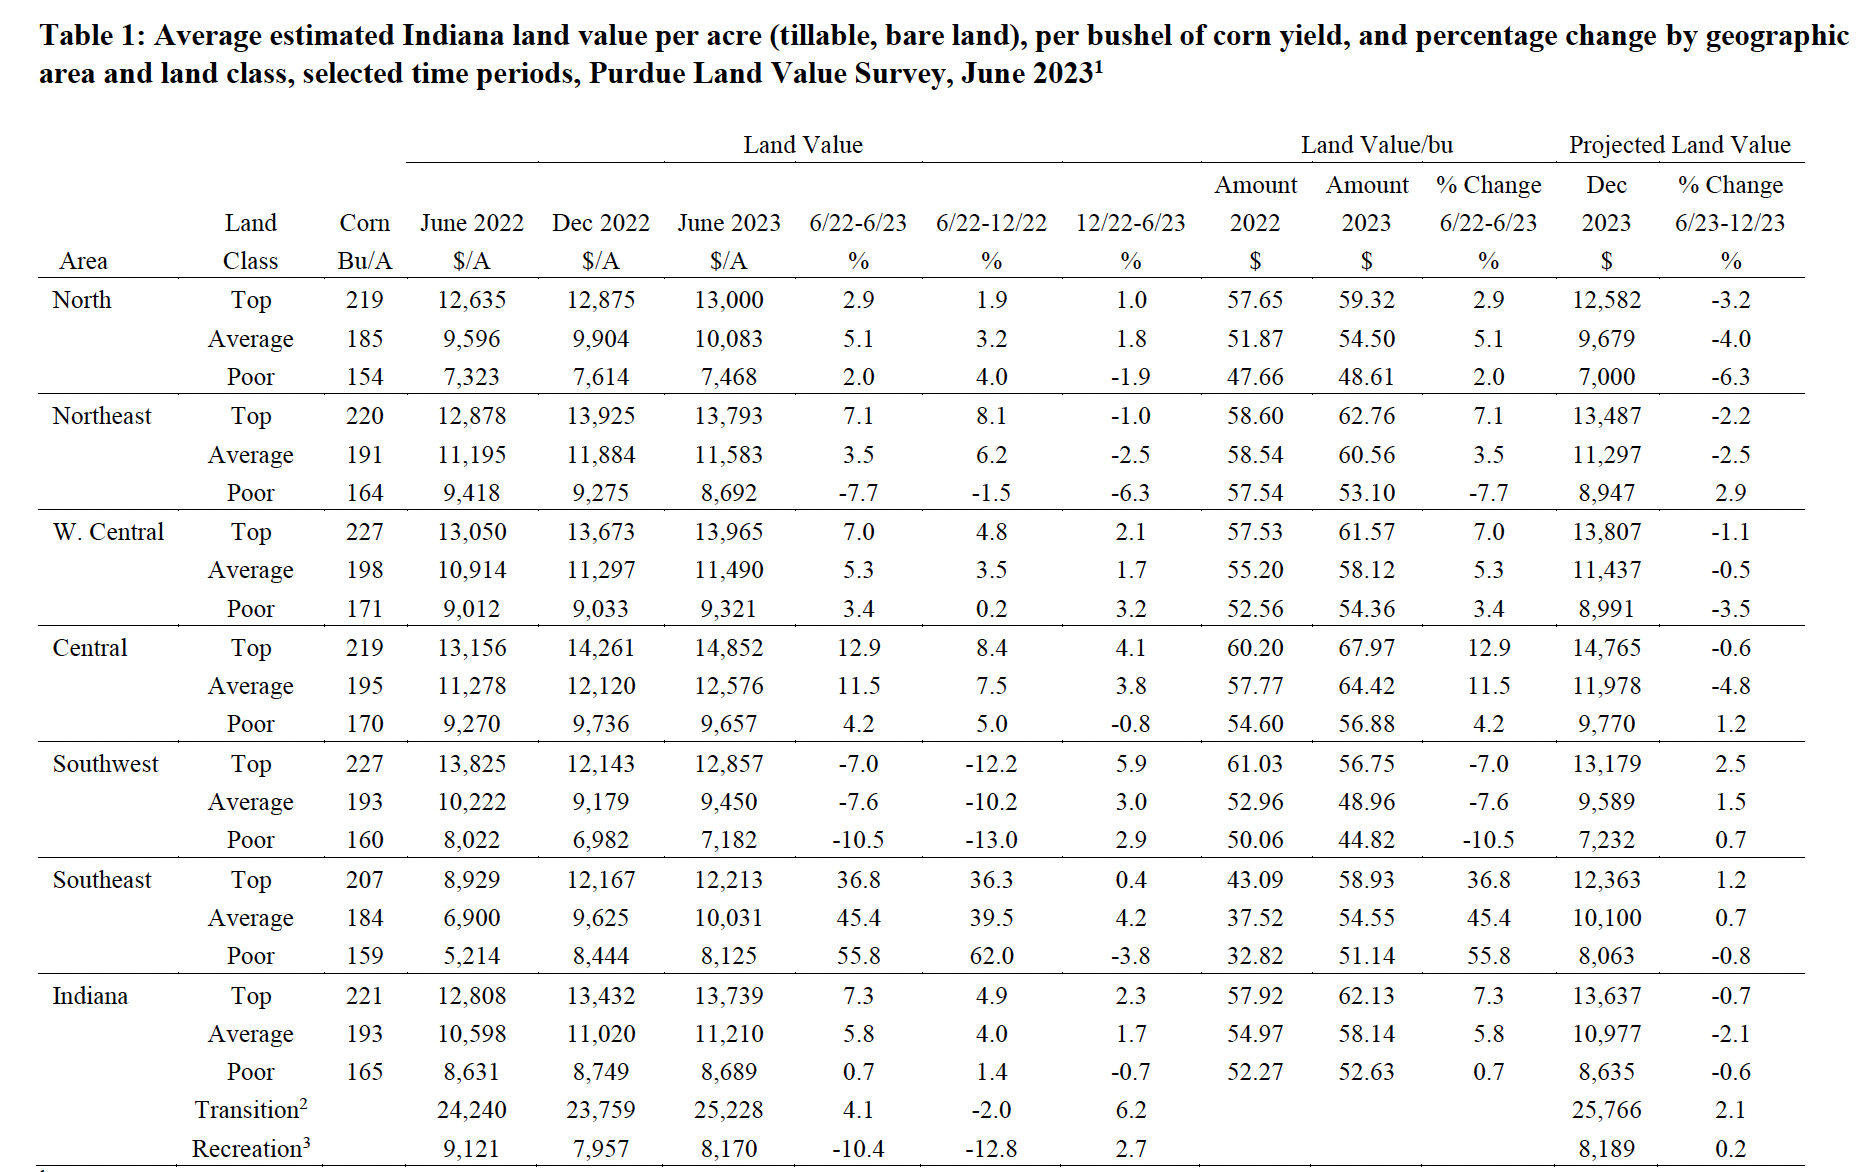
Table 1: Average estimated Indiana land value per acre (tillable, bare land), per bushel of corn yield, and percentage change by geographic area and land class, selected time periods, Purdue Land Value Survey, June 20231
1 The land values contained in this summary represent averages over several different locations and soil types. Determining the value for a specific property requires more information than is contained in this report and should include an evaluation by a professional appraiser.
2 Transition land is land moving out of production agriculture into other, typically higher value, uses.
3 Recreation land is land located in rural areas used for hunting and other recreational uses.
Farmland Market Forces
Respondents were asked to evaluate the importance of ten market forces that may potentially influence the farmland market: (1) current net farm income, (2) expected growth rate in farm returns, (3) crop price level and outlook, (4) livestock price level and outlook, (5) current and expected interest rates, (6) returns to alternative investments, (7) outlook for U.S. agricultural export sales, (8) U.S. inflation rate, (9) cash liquidity of buyers, and (10) current U.S. agricultural policy. Respondents rate each market force on a scale of –5 to +5, with –5 being the strongest negative influence. A positive influence is given a value between 1 and 5, with 5 representing the strongest positive influence. A score of 0 indicates the force was not influential. An average for each item was calculated, and averages for 2021, 2022, and 2023 are included in Figure 2. The horizontal axis shows the item from the list above.
In 2022, the only market force placing downward pressure on land values was interest rates. The 2023 survey suggests even stronger downward pressure, as both short term interest rates and farm mortgage rates increased. Rising interest rates are associated with increased costs of borrowing which puts downward pressure on purchases financed through mortgages. One respondent noted, “the farmland market could be cooling a bit due to higher mortgage rates. Even with a substantial down payment, the higher principal payments eat into cash returns from the additional land.” However, another noted that “higher interest rates have not seemed to affect the farmland market at all yet because of farmers’ strong cash position.” As can be seen in Figure 2, farm sector liquidity is still placing upward pressure on land prices but to a lesser degree than in 2022. The positive influence of a number of other factors, such as commodity prices and inflation, has also subsided in 2023. These declines likely inform the muted expectations for farmland prices in the remainder of 2023. The only other factor placing downward pressure on farmland prices is agricultural exports, yet the respondents report a very small level of influence compared to prior years.
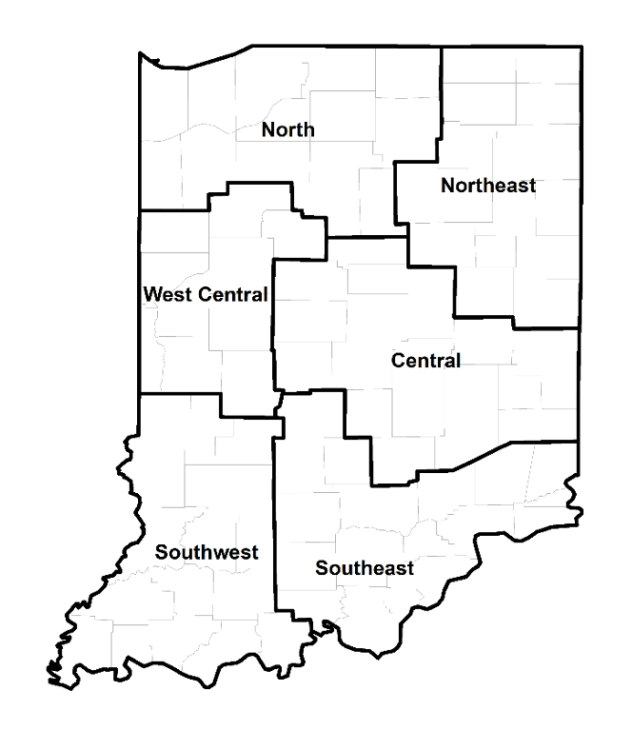
Figure 1: County clusters used in Purdue Land Values survey to create geographic regions
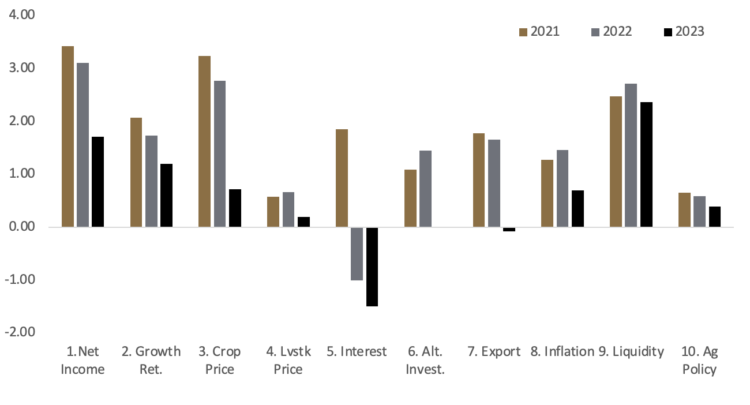
Figure 2: Influence of drivers of Indiana farmland values
Half of all respondents observed the amount of farmland for sale in 2023 was more or less equal to the amount observed in 2022. However, only 3% report an increase in the amount of land for sale in 2023, which further supports land price appreciation.
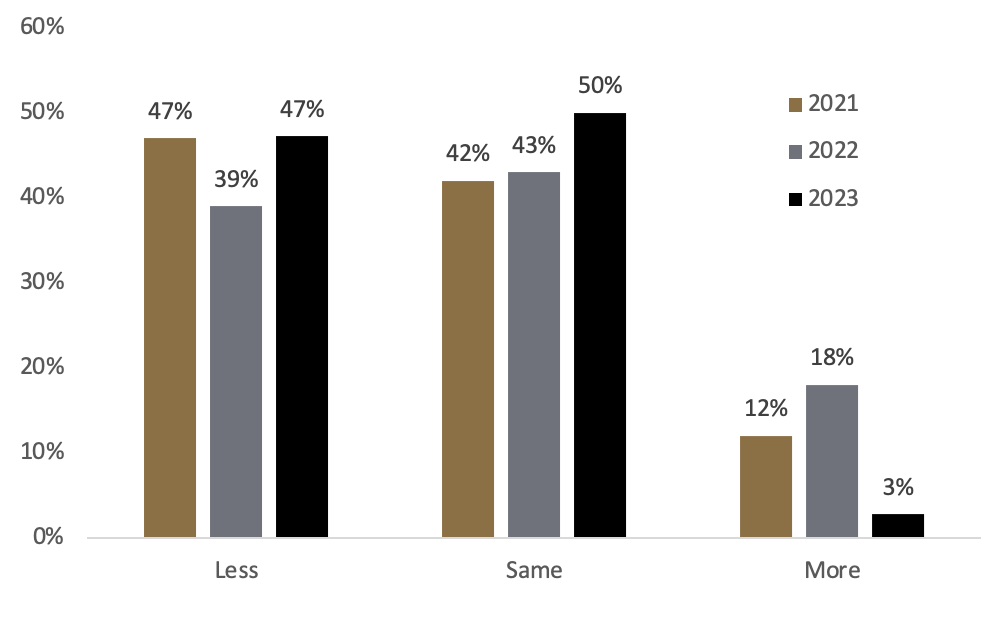
Figure 3: Percentage of respondents indicating less, same, or more farmland on the market than in the previous June
Five-Year Forecasts
Respondents were asked to forecast the five-year average corn price, soybean price, mortgage rate, and inflation rate (Table 2). Respondents are slightly less optimistic about commodity prices than they were a year ago. The projected corn and soybean prices fell by $0.10 and $0.03 between the 2022 and 2023 surveys. They also project further increases in interest rates but expect inflation to moderate slightly from the high levels observed in the wake of the COVID-19 pandemic.
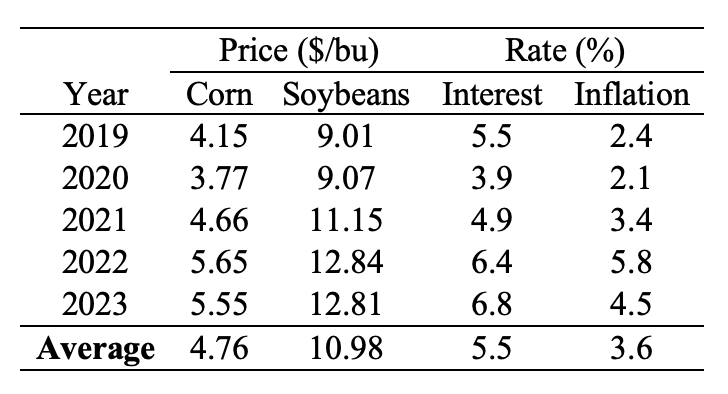
Table 2: Projected five-year average corn and soybean prices, mortgage interest, and inflation

Table 3: Average estimated Indiana cash rent per acre, (tillable, bare land) 2022 and 2023, Purdue Land Value Survey, June 2023
Cash Rent
Statewide, cash rents increased by a modest amount between 2022 and 2023. However, in nominal terms, statewide cash rents for all three quality grades are at an all time high. Per acre cash rental rates for top, average, and poor quality land exceed the previous highs set in 2013, 2014, and 2021, respectively. Indiana per acre cash rent for top quality land increase by 1.99% to $306. Cash rental rates for average and poor quality land increase by 2.09% and 2.50% to $257 and $212, respectively. Again, these modest changes at the state level mask some of the larger variation across land qualities and regions. For example, cash rental rates grew by 32.8% to 47.2% in the Southeast region for top, average, and poor quality land, but cash rental rates fell by –2.2% to –10.7% in the Southwest region. The highest cash rents, across all three quality grades, were observed in the West Central region. Across all regions and quality grades, rent as share of land value (the capitalization rate) held relatively steady between 2022 and 2023.
Looking Ahead
State-wide farmland prices in Indiana once again hit a new record high in 2023. The growth, however, was relatively modest compared to the record high appreciation observed in 2022. The continued growth in farmland prices was supported by a number of factors, such as farm incomes and liquidity. The experience, however, was not shared across all regions or quality grades. For example, farmland prices grew substantially in 2023 across the Southeast region yet fell by a modest degree in the Southwest region. Generally, respondents expect modest declines in the remainder of 2023, but, in the current economic climate, the future direction of farmland prices is difficult to determine, as one respondent notes, “future prices and values are very uncertain right now.”
Purdue Farmland Value and Cash Rent Survey
The Purdue Farmland Value and Cash Rents Survey is conducted each June. The survey is possible through the cooperation and contribution of numerous professionals knowledgable of Indiana’s farmland market. These professionals include farm managers, rural appraisers, land brokers, agricultural loan officers, farmers, and Farm Service Agency (FSA) county office directors. These professionals were selected because their daily work requires they stay well informed about farmland values and cash rents.
These professionals provide an estimate of the market value for bare poor, average, and top quality farmland in December 2020, June 2021, and a forecast for December 2021. To assess productivity of the farmland, respondents provide an estimate of long-term corn yield for top, average, and poor productivity farmland. Respondents also provide a market value estimate for land transitioning out of agriculture and for recreational land.
The data reported here provide general guidelines regarding farmland values and cash rent. To obtain a more precise value of an individual tract, contact a professional appraiser or farm manager that has a good understanding of the local market.
Prior reports are located at: https://purdue.ag/paer_archive.
![]()
![]()
![]()
![]()
![]()