Indiana Farmland Prices Grow at Record Pace in 2022
August 10, 2022
PAER-2022-22
Todd Kuethe, Associate Professor and Schrader Chair in Farmland Economics
![]()
![]()
![]()
![]()
![]()
Indiana farmland prices grew at a record pace between June 2021 and June 2022, according to the recent Indiana Farmland Value and Cash Rent Survey. Statewide, the average per acre price for top quality farmland increased by 30.9% to $12,808 (Table 1). The average per acre price of average quality farmland similarly increased by 30.1% to $10,598. Poor quality farmland prices exhibited the largest increase of 34.0% to $8,631. Across all quality grades, farmland prices exceeded the previous highs set in 2021. In addition, the price appreciation rates surpassed the previous record growth rates observed in 2011.
High farmland price growth was observed in almost all regions across Indiana (Figure 1). The average price for top quality farmland in the North region grew by 39.3%. In the Northeast region, average quality farmland prices increased by 38.5%, and in the Southeast region poor quality farmland prices increased by 41.9%. The highest average prices by land quality class included top quality land in the Southwest region ($13,825 per acre), average quality land in the Central region ($11,278 per acre), and poor quality land in the Northeast region ($9,418 per acre).
Respondents generally expect continued price growth through the remainder of 2022 but at a more muted pace. Statewide, respondents expect prices to increase by 1.1 to 2.7% through December 2022. However, respondents expect prices to decline by about one percentage point across some regions and quality grades.
The survey also found very high appreciation rates for farmland transitioning out of agricultural production or sold for recreational purposes. Statewide, the average price of transitional land was up 36.5% from June 2021, with an average price per acre of $24,240. Recreational land prices grew by 21.8% to an average per acre price of $9,121. For the remainder of 2022, respondents expect transitional land to increase modestly by 2.3%, while the value of recreational land is expected to hold relatively stable.
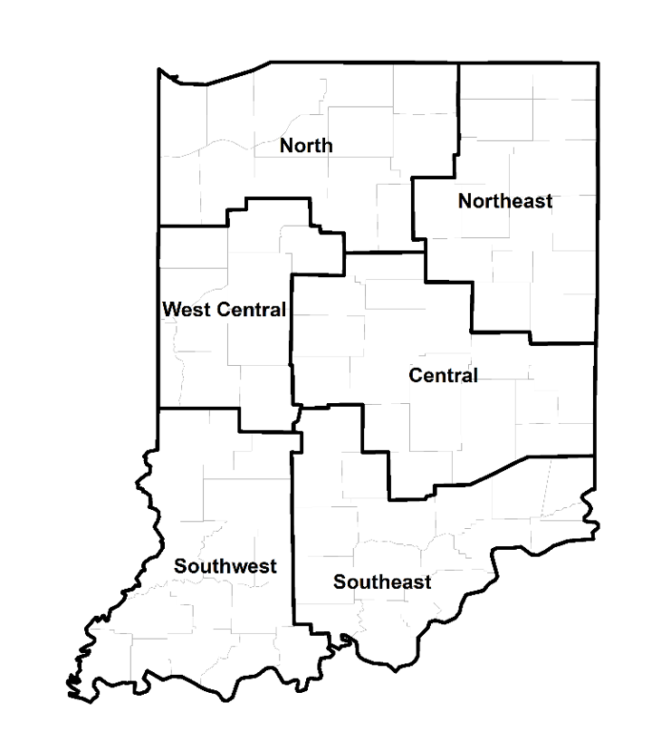
Figure 1: County clusters used in Purdue Land Values survey to create geographic regions
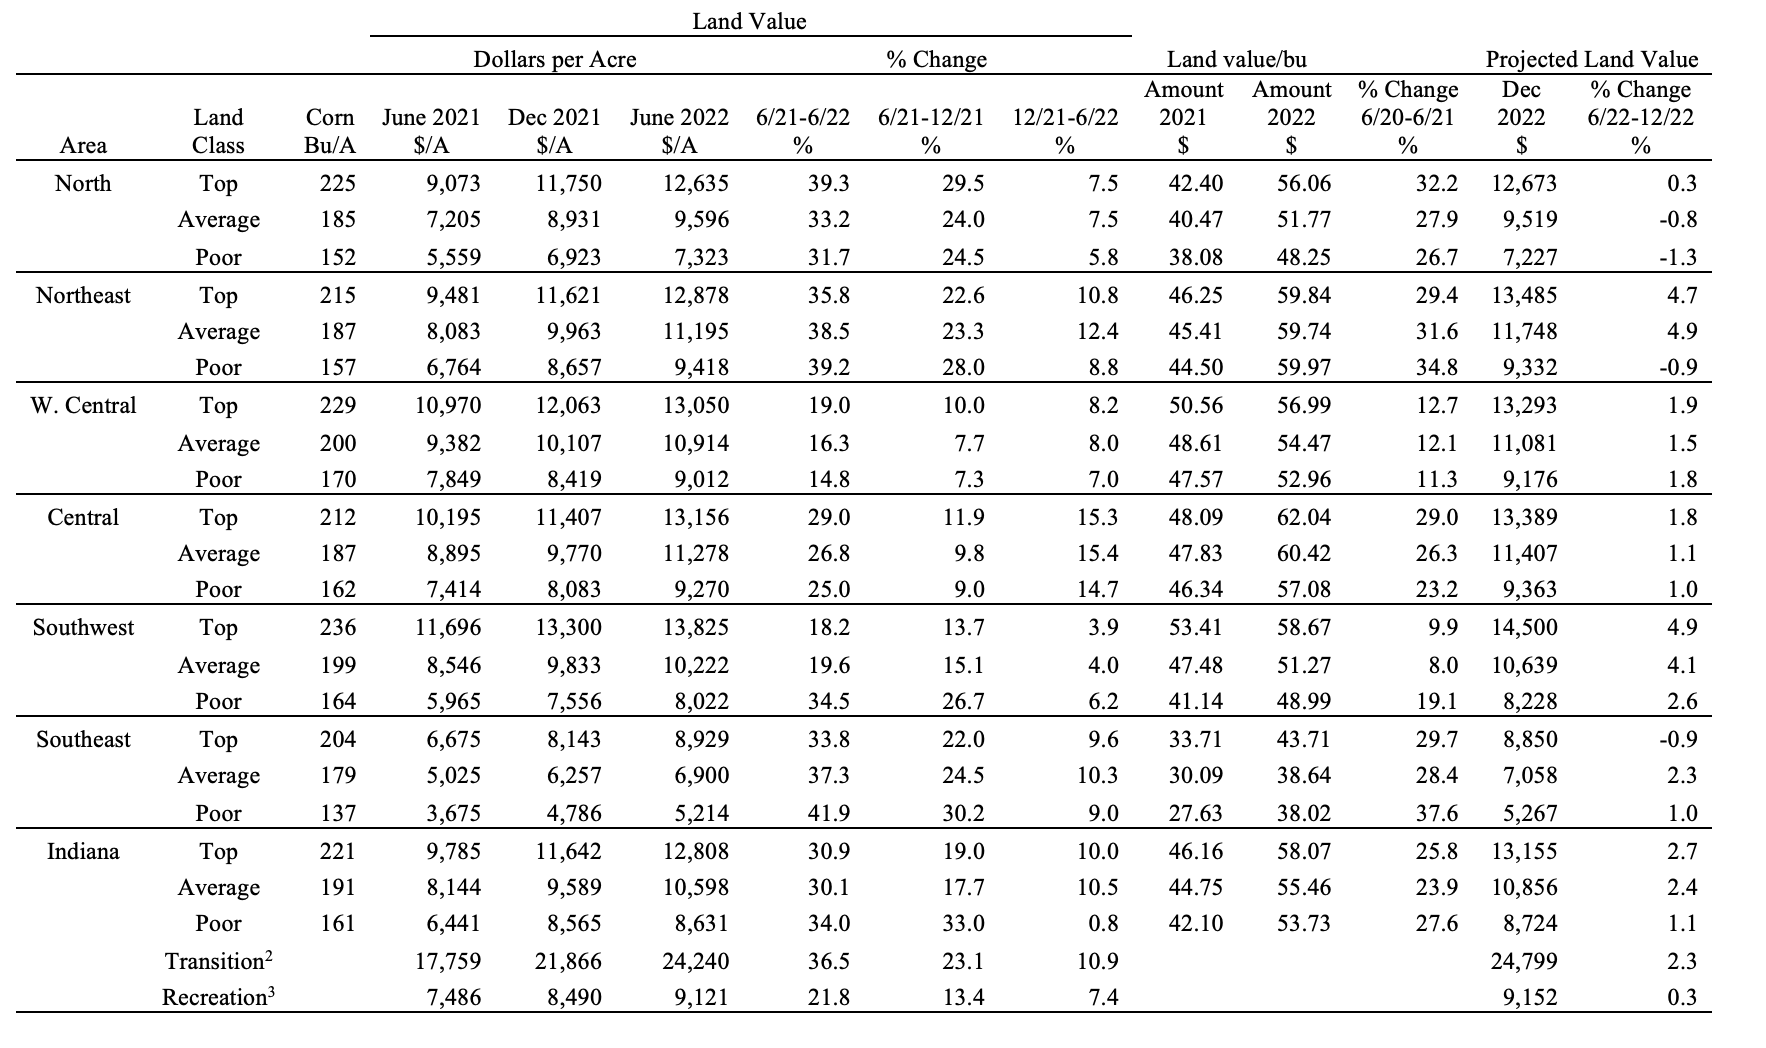
Table 1: Average estimated Indiana land value per acre (tillable, bare land), per bushel of corn yield, and percentage change by geographic area and land class, selected time periods, Purdue Land Value Survey, June 2022. 1. The land values contained in this summary represent averages over several different locations and soil types. Determining the value for a specific property requires more information than is contained in this report and should include an evaluation by a professional appraiser. 2 Transition land is land moving out of production agriculture into other, typically higher value, uses. 3 Recreation land is land located in rural areas used for hunting and other recreational uses.
Farmland Market Forces
Respondents were asked to evaluate the importance of ten market forces that may potentially influence the farmland market: (1) current net farm income, (2) expected growth rate in farm returns, (3) crop price level and outlook, (4) livestock price level and outlook, (5) current and expected interest rates, (6) returns to alternative investments, (7) outlook for U.S. agricultural export sales, (8) U.S. inflation rate, (9) cash liquidity of buyers, and (10) current U.S. agricultural policy. Respondents rate each market force on a scale of –5 to +5, with -5 being the strongest negative influence. A positive influence is given a value between 1 and 5, with 5 representing the strongest positive influence. A score of 0 indicates the force was not influential. An average for each item was calculated, and averages for 2020, 2021, and 2022 are included in Figure 2. The horizontal axis shows the item from the list above.
In 2021, all ten market forces placed upward pressure on farmland prices. In 2022, nine of the ten market forces exhibited upward pressure on farmland prices. In contrast to recent years, rising interest rates is putting downward pressure on farmland prices. As one respondent noted, “farmland prices are very high right now with a lot of cash to go around, but interest rates have people concerned.” Rising interest rates are associated with increased costs of borrowing which puts downward pressure on purchases financed through mortgages. The remaining factors all positively influence farmland prices: positive net farm incomes, relatively strong commodity prices, inflation, and high farmer liquidity.
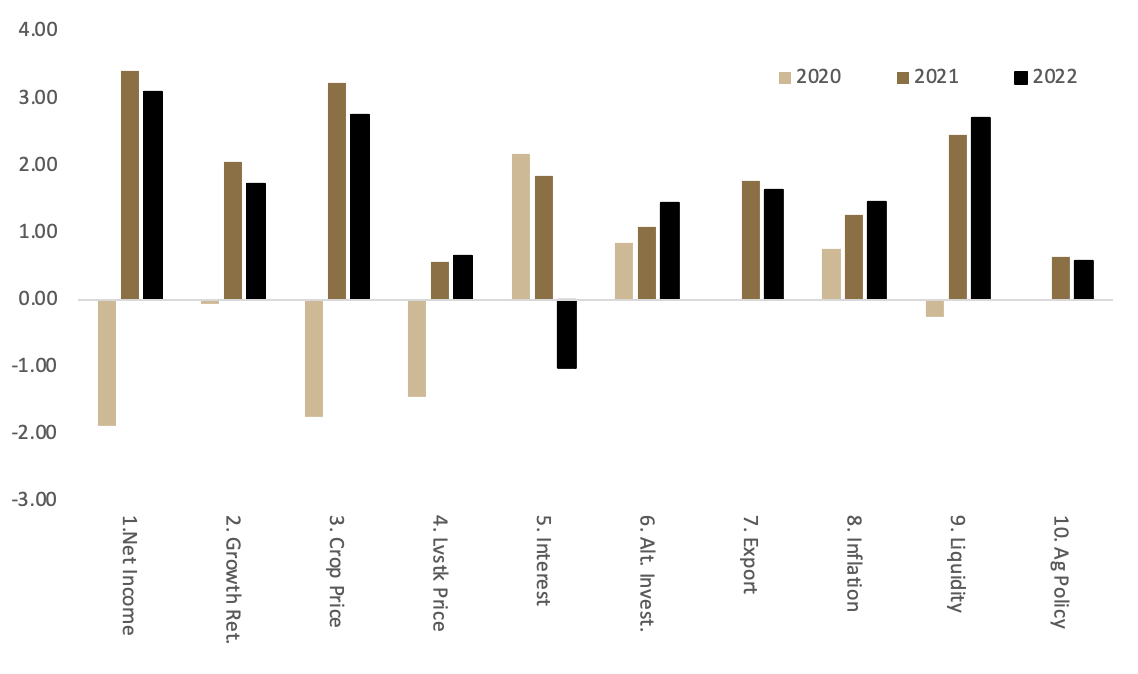
Figure 2: Influence of drivers of Indiana farmland values
The higher prices are accompanied by increase in land available for sale, relative to 2021 (Figure 3). The share of respondents reporting more land for sale increased to 18%, while 39% reported a smaller amount of land on the market.
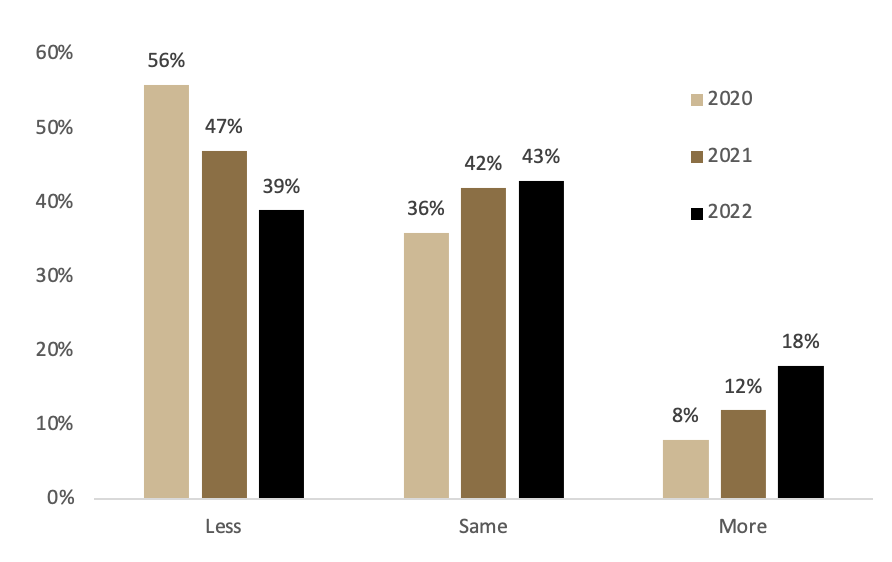
Figure 3: Percentage of respondents indicating less, same, or more farmland on the market than in the previous June
Five-Year Forecasts
Respondents were asked to forecast the five-year average corn price, soybean price, mortgage rate, and inflation rate (Table 2). Respondents project a five-year average per bushel average price of corn to be $5.65, a $0.99 per bushel increase from 2021. Respondents were equally optimistic about soybean prices, with an expected five-year average price of $12.84, a $1.69 increase from 2021.
Respondents, however, expect an increased cost of farm mortgages, with a five-year average of 6.4%, compared to 4.9% in 2021. Respondents also expect more inflation, with a five-year average of 5.8%, up from 3.4% in 2021. Farmland is sometimes promoted as a hedge against inflation, as an increase in prices across the economy generally supports high commodity prices. However, higher inflation also represents a potential increase costs for farm inputs. As one respondent notes, “the tradeoff between the influences from rising interest rates and rising inflation will be very interesting to observe.”
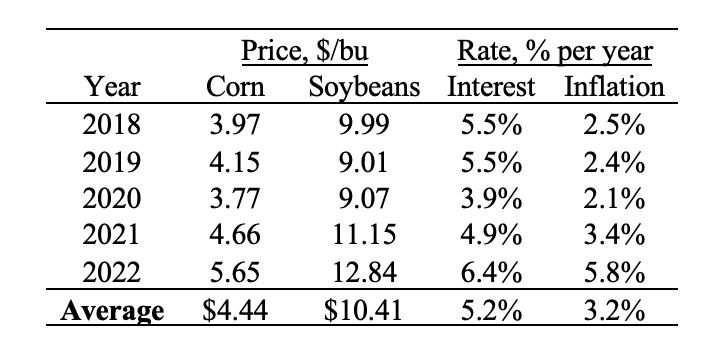
Table 2: Projected five-year average corn and soybean prices, mortgage interest, and inflation
Cash Rents
Statewide, cash rental rates increased across all land quality classes in 2022. Statewide average cash rents increased by 11.5% for top quality land, 10.8% for average quality land, and 13.2% for poor quality land. The increases in cash rents were the highest observed since the 2011–2012 period. Across the three quality grades, cash rents also reached a new record high in 2022 at $300 per acre for high quality farmland, $252 for average quality, and $207 for poor quality land. At the regional level, the largest cash rental rate increases for top and average quality land were in the Northeast (21.3% and 13.2%, respectively), and the largest increase for poor quality land was in the Southwest region (18.6%). Across all three quality grades, the highest per acre average cash rent was observed in the West Central region.
While rental rates in across all three quality grades increased in almost all regions, the cash rental rates grew at a slower rate than market prices. As a result, rent as a share of land value declined relative to 2021. Overall, respondents do not expect drastic changes to cash rental rates next year. As one respondent noted, “I fear that input prices will be slower to `return to normal’ than commodity prices will.” In other words, the threat of high input costs and modest returns may discourage renters from bidding rents higher in 2022.
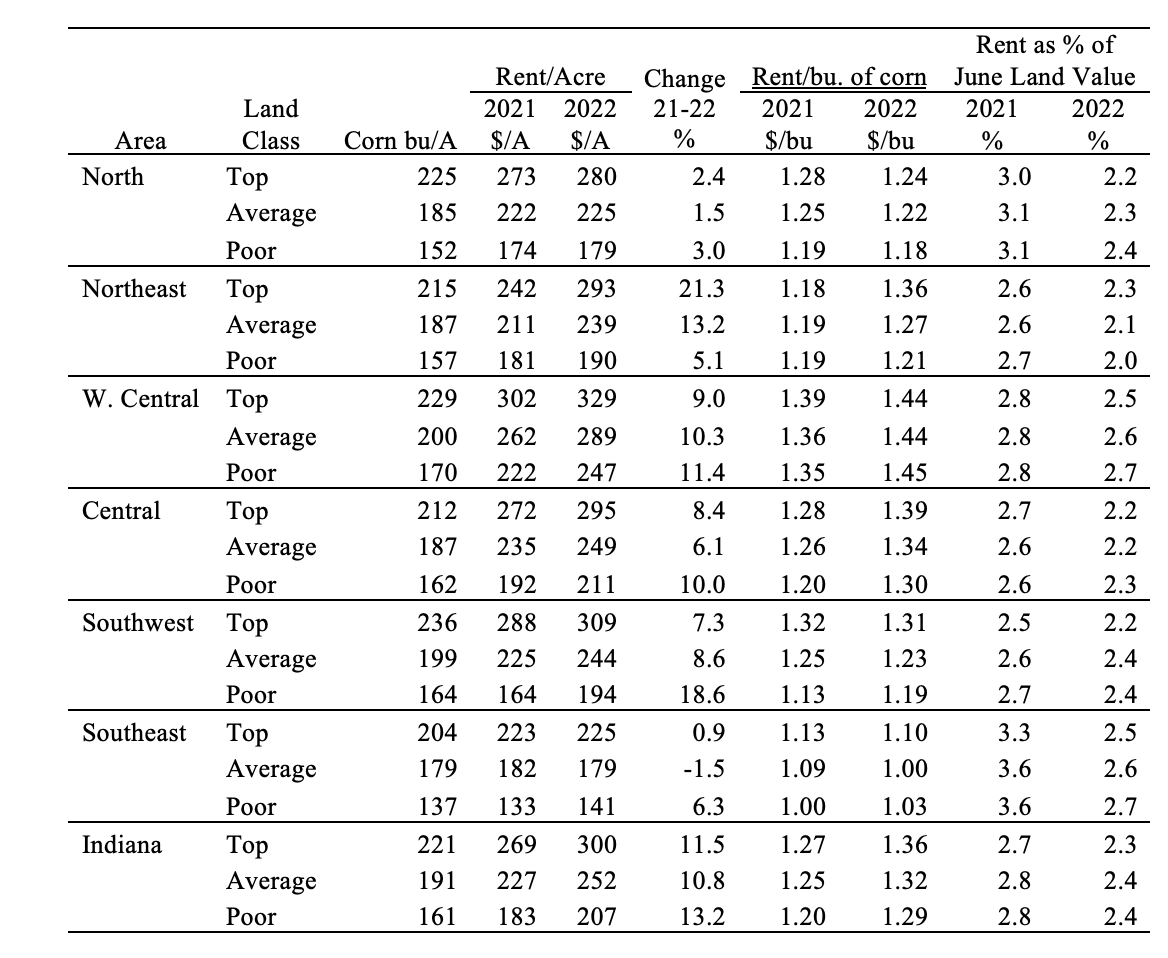
Table 3: Average estimated Indiana cash rent per acre, (tillable, bare land) 2021 and 2022, Purdue Land Value Survey, June 2022
Looking Ahead
Statewide farmland prices have risen at an increasing rate over the last three years. In 2022, Indiana farmland prices recorded both record high levels and record high growth rates. The pronounced growth in farmland prices has been supported by a combination of high incomes and high farm liquidity. While respondents of the Purdue Farmland Value and Cash Rent Survey are optimistic for continued growth for the remainder of 2022, broader economic uncertainty dampens expectations for continued record growth. Respondents are particularly concerned with the potential for high inflation and high interest rates, and the two economic forces are not independent of one another.
Farmland market participants who experienced the 1980s Farm Financial Crisis are reminded of an era when the Federal Reserve increased interest rates rapidly to fight inflationary pressure. The rising interest rates coincided with decrease in commodity prices and farm returns. As one respondent notes, “as a lender in the 1970s, we thought we were making 50% loan to value mortgages which turned out to be 90% in short time because income fell and interest rates spiked.” The respondent adds, “Hold on to your hat!”
Purdue Farmland Value and Cash Rent Survey
The Purdue Farmland Value and Cash Rent Survey is conducted each June. The survey is possible through the cooperation and contribution of numerous professionals knowledgeable of Indiana’s farmland market. These professionals include farm managers, rural appraisers, land brokers, agricultural loan officers, farmers, and Farm Service Agency (FSA) county office directors. These professionals were selected because their daily work requires they stay well informed about farmland values and cash rents.
These professionals provide an estimate of the market value for bare poor, average, and top quality farmland in December 2020, June 2021, and a forecast for December 2021. To assess productivity of the farmland, respondents provide an estimate of long-term corn yield for top, average, and poor productivity farmland. Respondents also provide a market value estimate for land transitioning out of agriculture and for recreational land.
The data reported here provide general guidelines regarding farmland values and cash rent. To obtain a more precise value of an individual tract, contact a professional appraiser or farm manager that has a good understanding of the local market.
Prior reports are located at: https://purdue.ag/paer_archive
![]()
![]()
![]()
![]()
![]()