Indiana Farmland Prices Hit New Record High in 2021
July 26, 2021
PAER-2021-9
Author: Todd H. Kuethe, Associate Professor and Schrader Endowed Chair in Farmland Economics
![]()
![]()
![]()
![]()
![]()
It is safe to say that the last year was unlike any other in recent memory. The COVID-19 pandemic caused significant disruption to our lives and the global economy. Surprisingly, many of the current economic forces put upward pressure on farmland prices. As one respondent noted, “short supply of farms for sale, investors and institutional buyers, farmers flush with money and equity, continued historic low interest rates and fear of increasing rates, an influx of government assistance, higher than anticipated commodity prices, fear of tax policy changes, and a willingness to accept lower required returns on investments… all equal a new historic land value.” This unique combination of economic forces led to new record high farmland prices in 2021, according to the recent Purdue Land Values and Cash Rent Survey.
Statewide, top quality farmland averaged $9,785 per acre, up 14.1% from June 2020 (Table 1). The high growth rate for top quality farmland was closely followed by the growth in average and poor quality farmland prices, which increased by 12.5% (to $8,144) and 12.1% (to $6,441), respectively. Across all land quality classes, 2021 per acre farmland prices exceeded the previous record set in 2014.
Many areas of the state experienced particularly high farmland price appreciation (Figure 1). The highest growth rates were observed in the Southwest region, ranging from 20% for average and poor quality land to nearly 28% for top quality farmland. High appreciation rates were also observed across all land quality classes in the Central and West Central regions. The West Central and Central regions also exhibited the highest value or cost per unit of productivity (per bushel of corn). In 2021, the highest per acre price for high quality farmland was in the Southwest portion of the state, and the highest per acre prices for average and poor quality farmland were in the West Central region.
The 2021 Purdue Land Values and Cash Rents Survey respondents are optimistic that the current land price growth will continue through the end of the year, yet at a slower pace than observed since December 2020. Statewide, respondents expect farmland prices to increase by 3.9% (top and average quality) to 4.2% (poor quality) by December 2021.
Figure 1: County clusters used in Purdue Land Values survey to create geographic regions
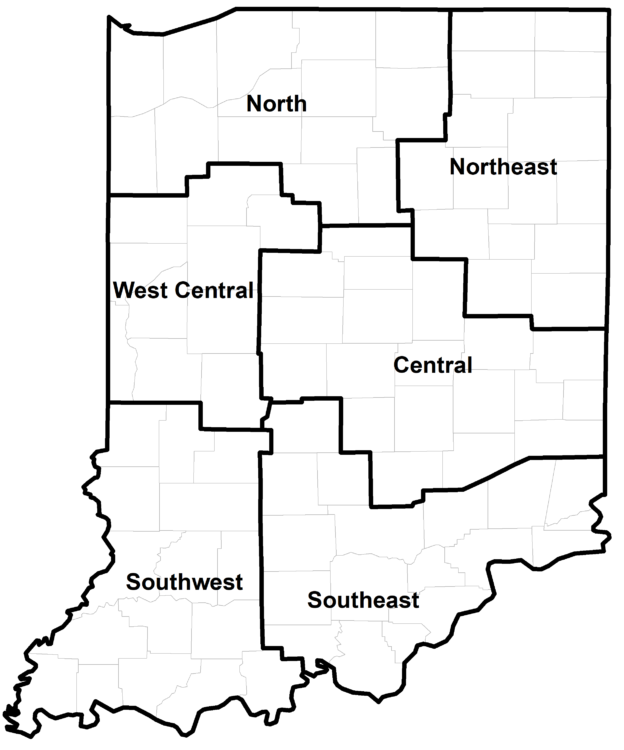
Figure 1: County clusters used in Purdue Land Values survey to create geographic regions
Table 1: Average estimated Indiana land value per acre (tillable, bare land), per bushel of corn yield, and percentage change by geographic area and land class, selected time periods, Purdue Land Value Survey, June 20211
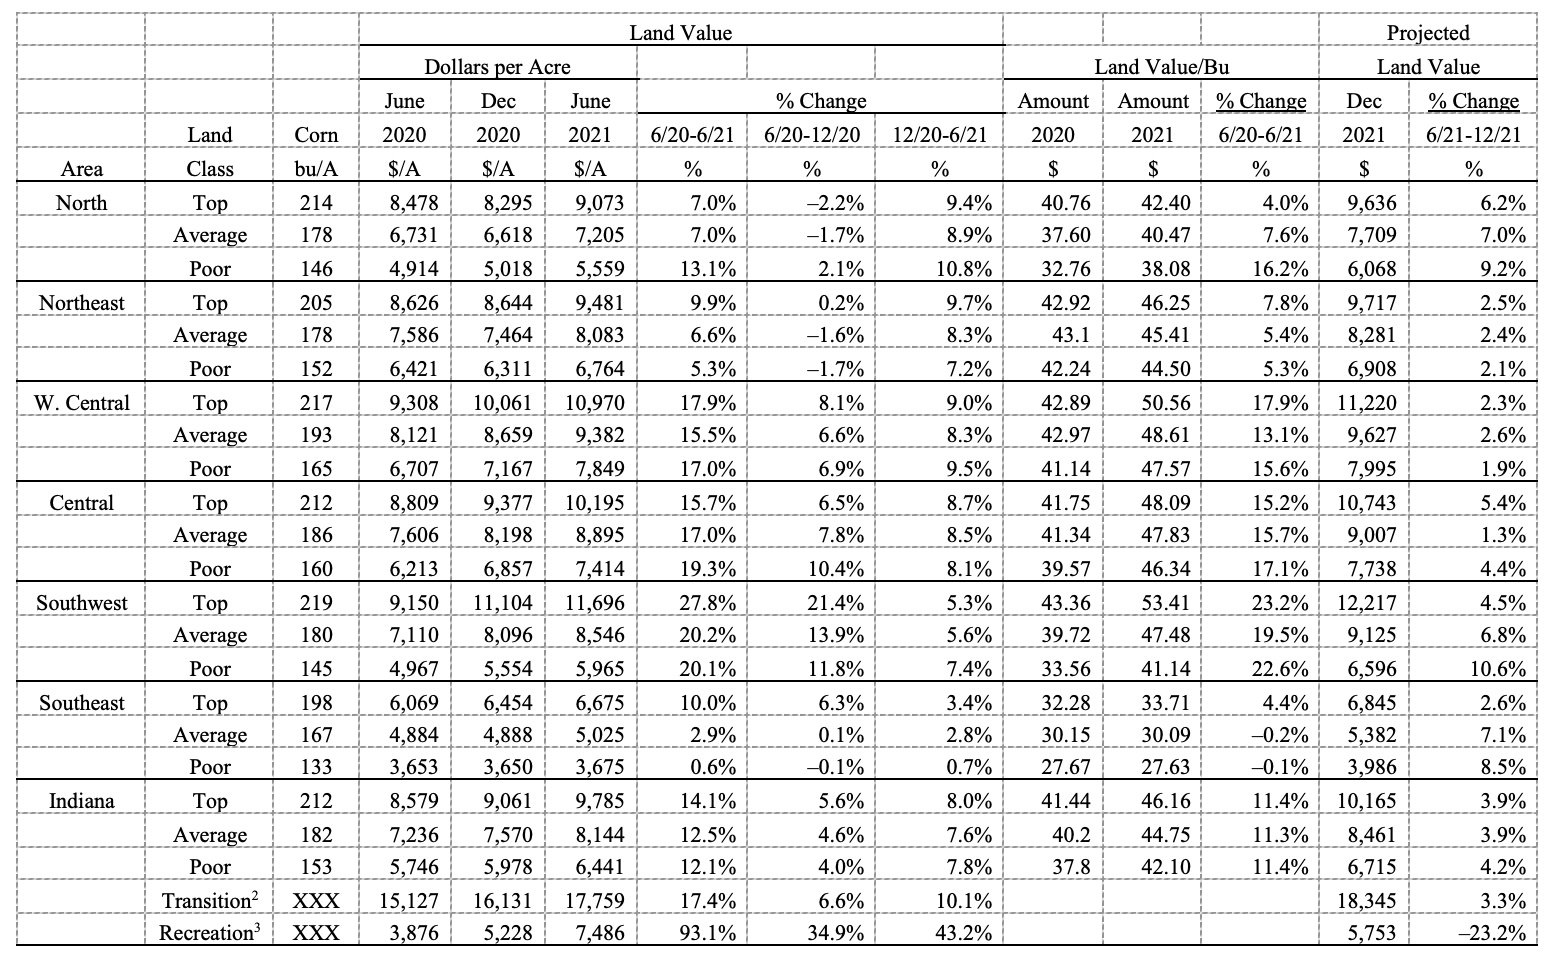
Table 1: Average estimated Indiana land value per acre (tillable, bare land), per bushel of corn yield, and percentage change by geographic area and land class, selected time periods, Purdue Land Value Survey, June 20211
1 The land values contained in this summary represent averages over several different locations and soil types. Determining the value for a specific property requires more information than is contained in this report and should include an evaluation by a professional appraiser.
2 Transition land is land moving out of production agriculture into other, typically higher value, uses.
3 Recreation land is land located in rural areas used for hunting and other recreational uses.
In addition to agricultural production, farm real estate prices are greatly influenced by the potential to develop land to nonagricultural commercial or residential uses. As a result, the survey collects information about the price of land moving out of agricultural production. The statewide average value of transitional land was $17,759 per acre, a 17% increase from June 2020. Rural land purchased for recreational purposes nearly doubled from $3,876 per acre in 2020 to $7,486 per acre in 2021. While respondents expect transitional land prices to continue to appreciate through December 2021, they expect recreational lands to decline in value.
The survey also collects information on the value of farmland moving into rural residences and subdivisions (Table 2). Respondents provide estimates of the value of rural home sites located on a blacktop or well-maintained gravel road with no accessible gas line or city utilities. These markets are characterized by a very wide range of values. As a result, responses are summarized by median values (the value dividing a series of ordered numbers in half). The median value of five-acre home sites also increase in 2021, with median values between $10,375 (Southeast) to $15,000 per acre (Northeast and Southwest). Similar values were observed for 10 acre home sites, ranging from $10,000 (North and Southeast) to $15,000 per acre (Northeast and Southwest).
Table 2: June median value of unimproved five-acre or less home sites and ten-acre or more subdivisions
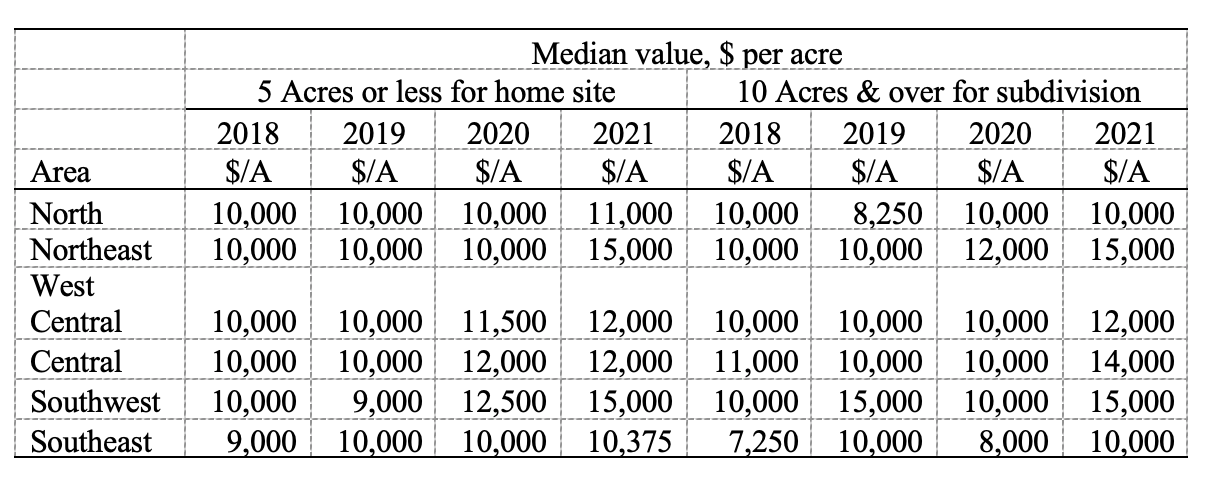
Table 2: June median value of unimproved five-acre or less home sites and ten-acre or more subdivisions
Farmland Market Forces
Respondents were asked to evaluate the importance of ten market forces that may potentially influence the farmland market: (1) current net farm income, (2) expected growth rate in farm returns, (3) crop price level and outlook, (4) livestock price level and outlook, (5) current and expected interest rates, (6) returns to alternative investments, (7) outlook for U.S. agricultural export sales, (8) U.S. inflation rate, (9) cash liquidity of buyers, and (10) current U.S. agricultural policy. Respondents rate each market force on a scale of –5 to +5, with -5 being the strongest negative influence. A positive influence is given a value between 1 and 5, with 5 representing the strongest positive influence. A score of 0 indicates the force was not influential. An average for each item was calculated, and averages for 2019, 2020, and 2021 are included in Figure 2. The horizontal axis shows the item from the list above.
In contrast to recent years, all ten market forces put positive pressure on farmland prices. The most influential market forces include net income, expected income growth, crop prices, and farmers’ liquidity. Many of these forces, particularly crop prices, were also highlighted in respondents comments. As one respondent notes, “land prices have risen dramatically since November 2020, following grain prices.”
While a number of respondents note the limited supply of land for sale this year, the share of respondents reporting more land for sale increased relative to 2019 and 2020 (Figure 3). The share of respondents reporting more land for sale increased to 12%, while 47% reported a smaller share of land for sale.
Figure 2: Influence of drivers of Indiana farmland values
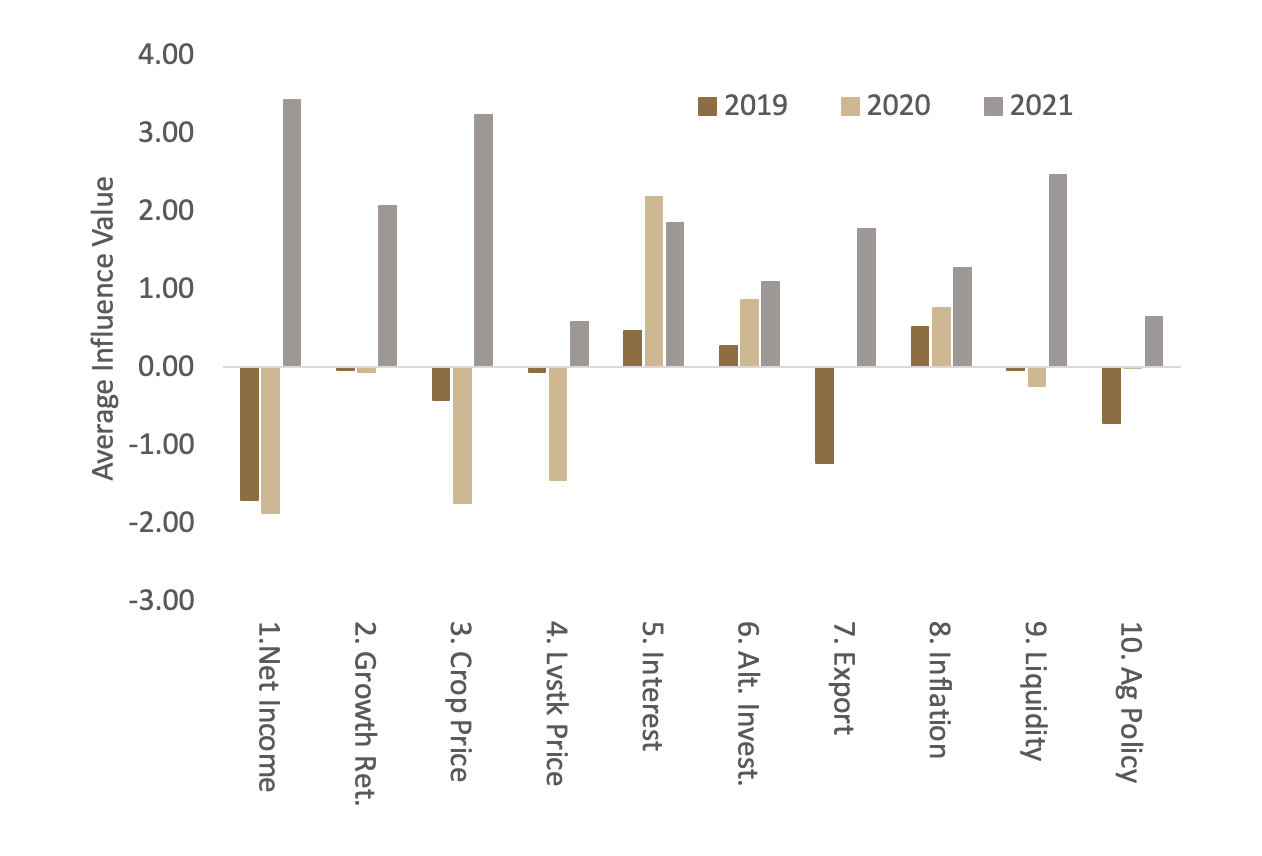
Figure 2: Influence of drivers of Indiana farmland values
Figure 3: Percentage of respondents indicating less, same, or more farmland on the market than in the previous June
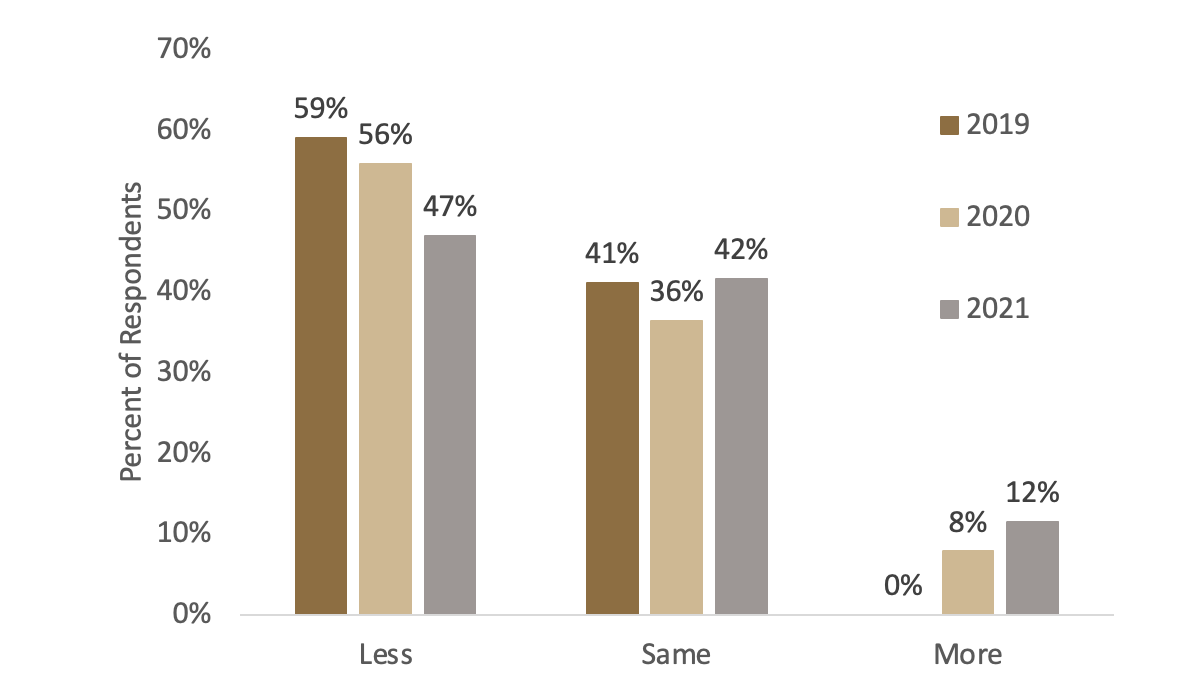
Figure 3: Percentage of respondents indicating less, same, or more farmland on the market than in the previous June
Five-Year Forecasts
Respondents were asked to forecast the five-year average corn price, soybean price, mortgage rate, and inflation rate (Table 3). Respondents estimated the five-year average per bushel average price of corn to be $4.66, an $0.89 per bushel increase from the 2020. The five-year per bushel soybean price was estimated to be $11.15, a $2.08 per bushel increase from 2020. In both cases, the respondents were much more optimistic compared to recent years.
As the economy continues to recover from the COVID-19 pandemic, respondents also expect a marked increase in both farm mortgage rates and inflation. The expected mortgage interest rate of 4.9% is higher than that of 2020 but still below average value expected over the last five years. The expected inflation rate of 3.4% is nearly a full percentage point higher than the average of the last five years. Many respondents also noted concerns of inflation risk in the survey comments.
Table 3: Projected five-year average corn and soybean prices, mortgage interest, and inflation
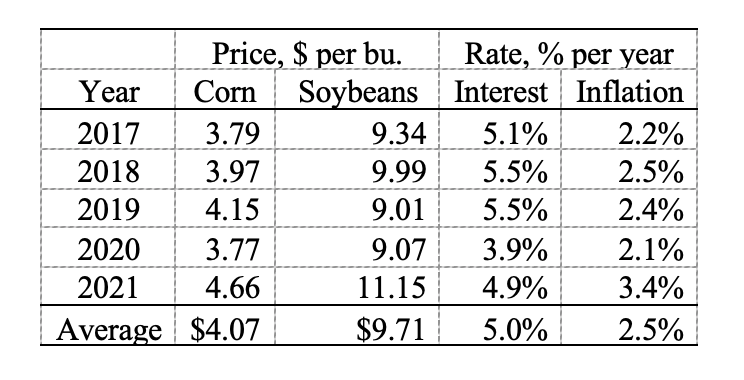
Table 3: Projected five-year average corn and soybean prices, mortgage interest, and inflation
Cash Rents
Statewide cash rental rates increased across all land quality classes in 2021. Statewide average rental rates increased by 3.9% for top quality land, from $259 to $269 per acre. The cash rental rates for average and poor quality lands both increased by 4.6% to $227 and $183, respectively. At the regional level, the largest rental rate increases for top and average quality land were both in the Southeast region (11.5% and 6.4%), and the largest rental rate increases for poor quality land were in the North region (5.5%). Across all three land quality classes, the highest per acre cash rent was observed in the West Central region.
Rent as a share of June land value decreased slightly in 2021, suggesting that cash rental rates appreciated slower than farmland prices. Some portion of the difference in appreciation rates may reflect changes in expectations between fall 2020, when 2021 rents were negotiated, and the 2021 growing season. However, at least one respondent suggests that “fear of input prices for 2022 is going to restrict cash rents going up sharply” in the coming year.
Table 4: Average estimated Indiana cash rent per acre, (tillable, bare land) 2020 and 2021, Purdue Land Value Survey, June 2021
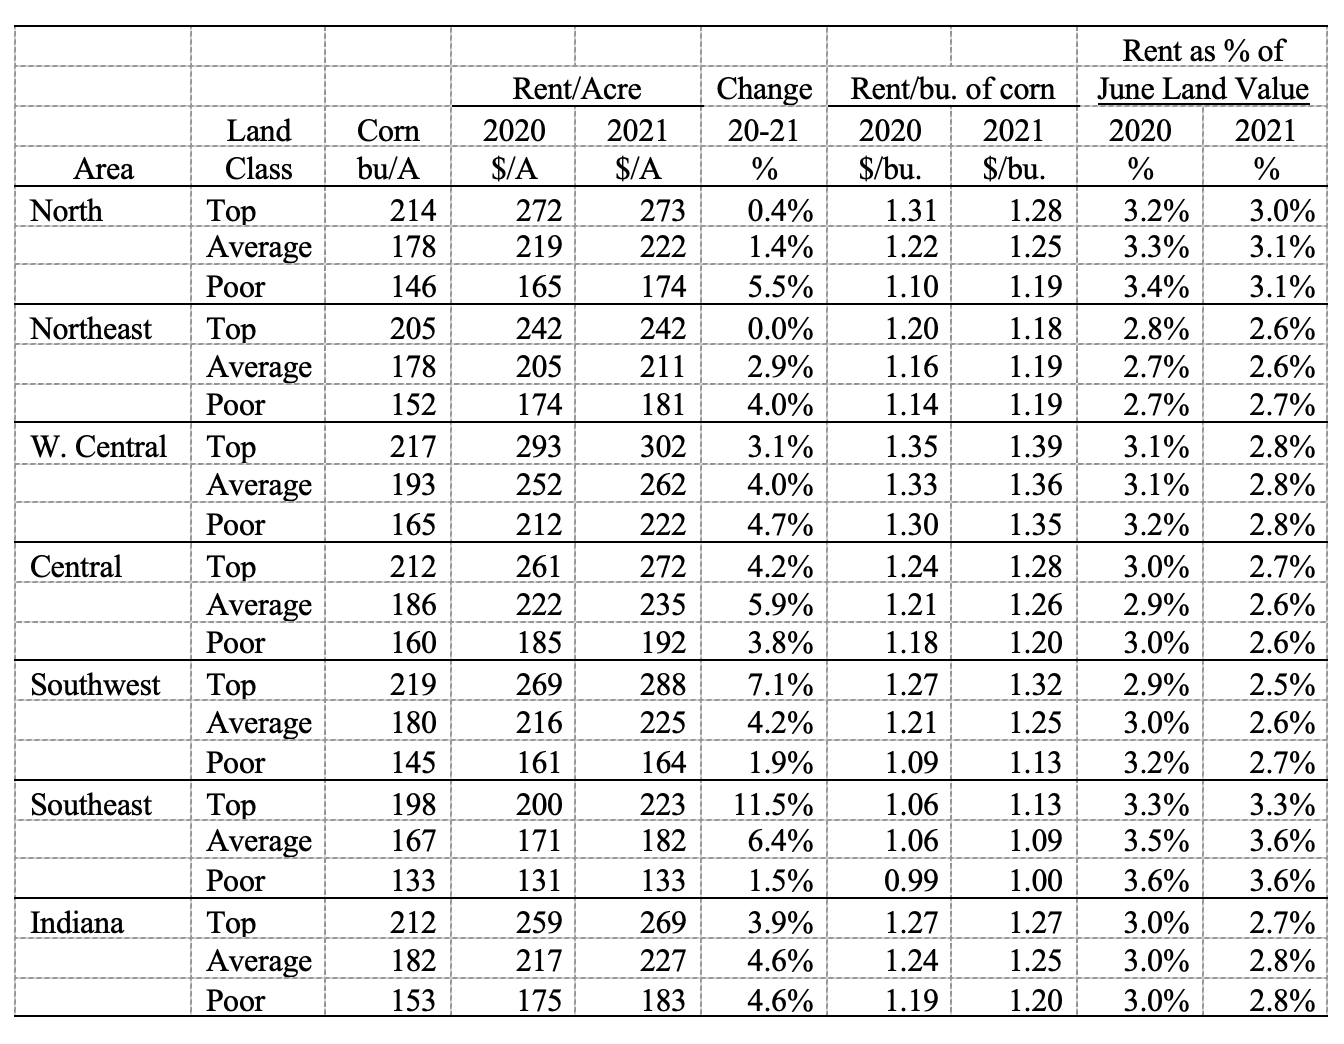
Table 4: Average estimated Indiana cash rent per acre, (tillable, bare land) 2020 and 2021, Purdue Land Value Survey, June 2021
Looking Ahead
Statewide farmland prices established a new record high in 2021, expanding on the growth from 2019 to 2020. The growth in farmland prices is driven by complex combination of economic forces, including high commodity prices, low interest rates, and low supply of land. While respondents are optimistic that these forces will continue to support farmland growth for the remainder of 2021, many of the respondents’ comments signal challenges on the horizon. Many of these challenges are related to economic adjustments as we continue to recover from the COVID-19 pandemic, but others include changing demand for land use through development in the form of housing or solar energy production. A closely related set of uncertainties are driven by agricultural, environmental, and economic policies, including discount rates, land use restrictions, and tax policy. Thus, while many farmland market participants are encouraged by the growth in land values in the first half of 2021, most recognize that the combination of economic forces driving current farmland price growth are not likely to remain for the long term.
Purdue Farmland Value and Cash Rent Survey
The Purdue Farmland Value and Cash Rent Survey is conducted each June. The survey is possible through the cooperation and contribution of numerous professionals knowledgeable of Indiana’s farmland market. These professionals include farm managers, rural appraisers, land brokers, agricultural loan officers, farmers, and Farm Service Agency (FSA) county office directors. These professionals were selected because their daily work requires they stay well informed about farmland values and cash rents.
These professionals provide an estimate of the market value for bare poor, average, and top quality farmland in December 2020, June 2021, and a forecast for December 2021. To assess productivity of the farmland, respondents provide an estimate of long-term corn yield for top, average, and poor productivity farmland. Respondents also provide a market value estimate for land transitioning out of agriculture and for recreational land.
The data reported here provide general guidelines regarding farmland values and cash rent. To obtain a more precise value of an individual tract, contact a professional appraiser or farm manager that has a good understanding of the local market.
Prior reports are located at: https://purdue.ag/paer_archive
![]()
![]()
![]()
![]()
![]()