Indiana Farmland Values and Cash Rents Continue to Adjust
August 15, 2017
PAER-2017-10
Authors: Craig Dobbins, Professor of Agricultural Economics and Kim Cook, Research Associate in Agricultural Economics
![]()
![]()
![]()
![]()
![]()
Midwest farmland value news has been mixed this summer. Some reports indicate current farmland values are the same or a little higher than last year or last quarter. Other reports indicate farmland values continue a downward adjustment. The May AgLetter issued by the Federal Reserve Bank of Chicago reported District farmland values for the first quarter of 2017 were unchanged.1 However, Illinois and Indiana values declined 1% and 2%, respectively. Farmland values in Iowa and Wisconsin increased 1% and 2%, respectively. The Iowa Chapter of the Realtors® Land Institute reported Iowa had a state-wide increase of 0.9% for the September 2016 to March 2017 period. For the period of March 2016 to March 2017, farmland values were down 2.8%. The 2017 Purdue Farmland Value Survey2 also contains a mixture of increases and decreases.
On a state-wide basis, year to year comparisons indicate top quality land remained steady (an increase of 0.2%), while average and poor quality farmland experienced modest declines of 1.6% and 1.4%, respectively (Table 1). This is a much different outcome than reported last year with a state-wide decline of 8.2% to 8.7% across farmland qualities. The 2017 changes in farmland values across regions of the state and quality of farmland was also a mixture of increases and decreases.
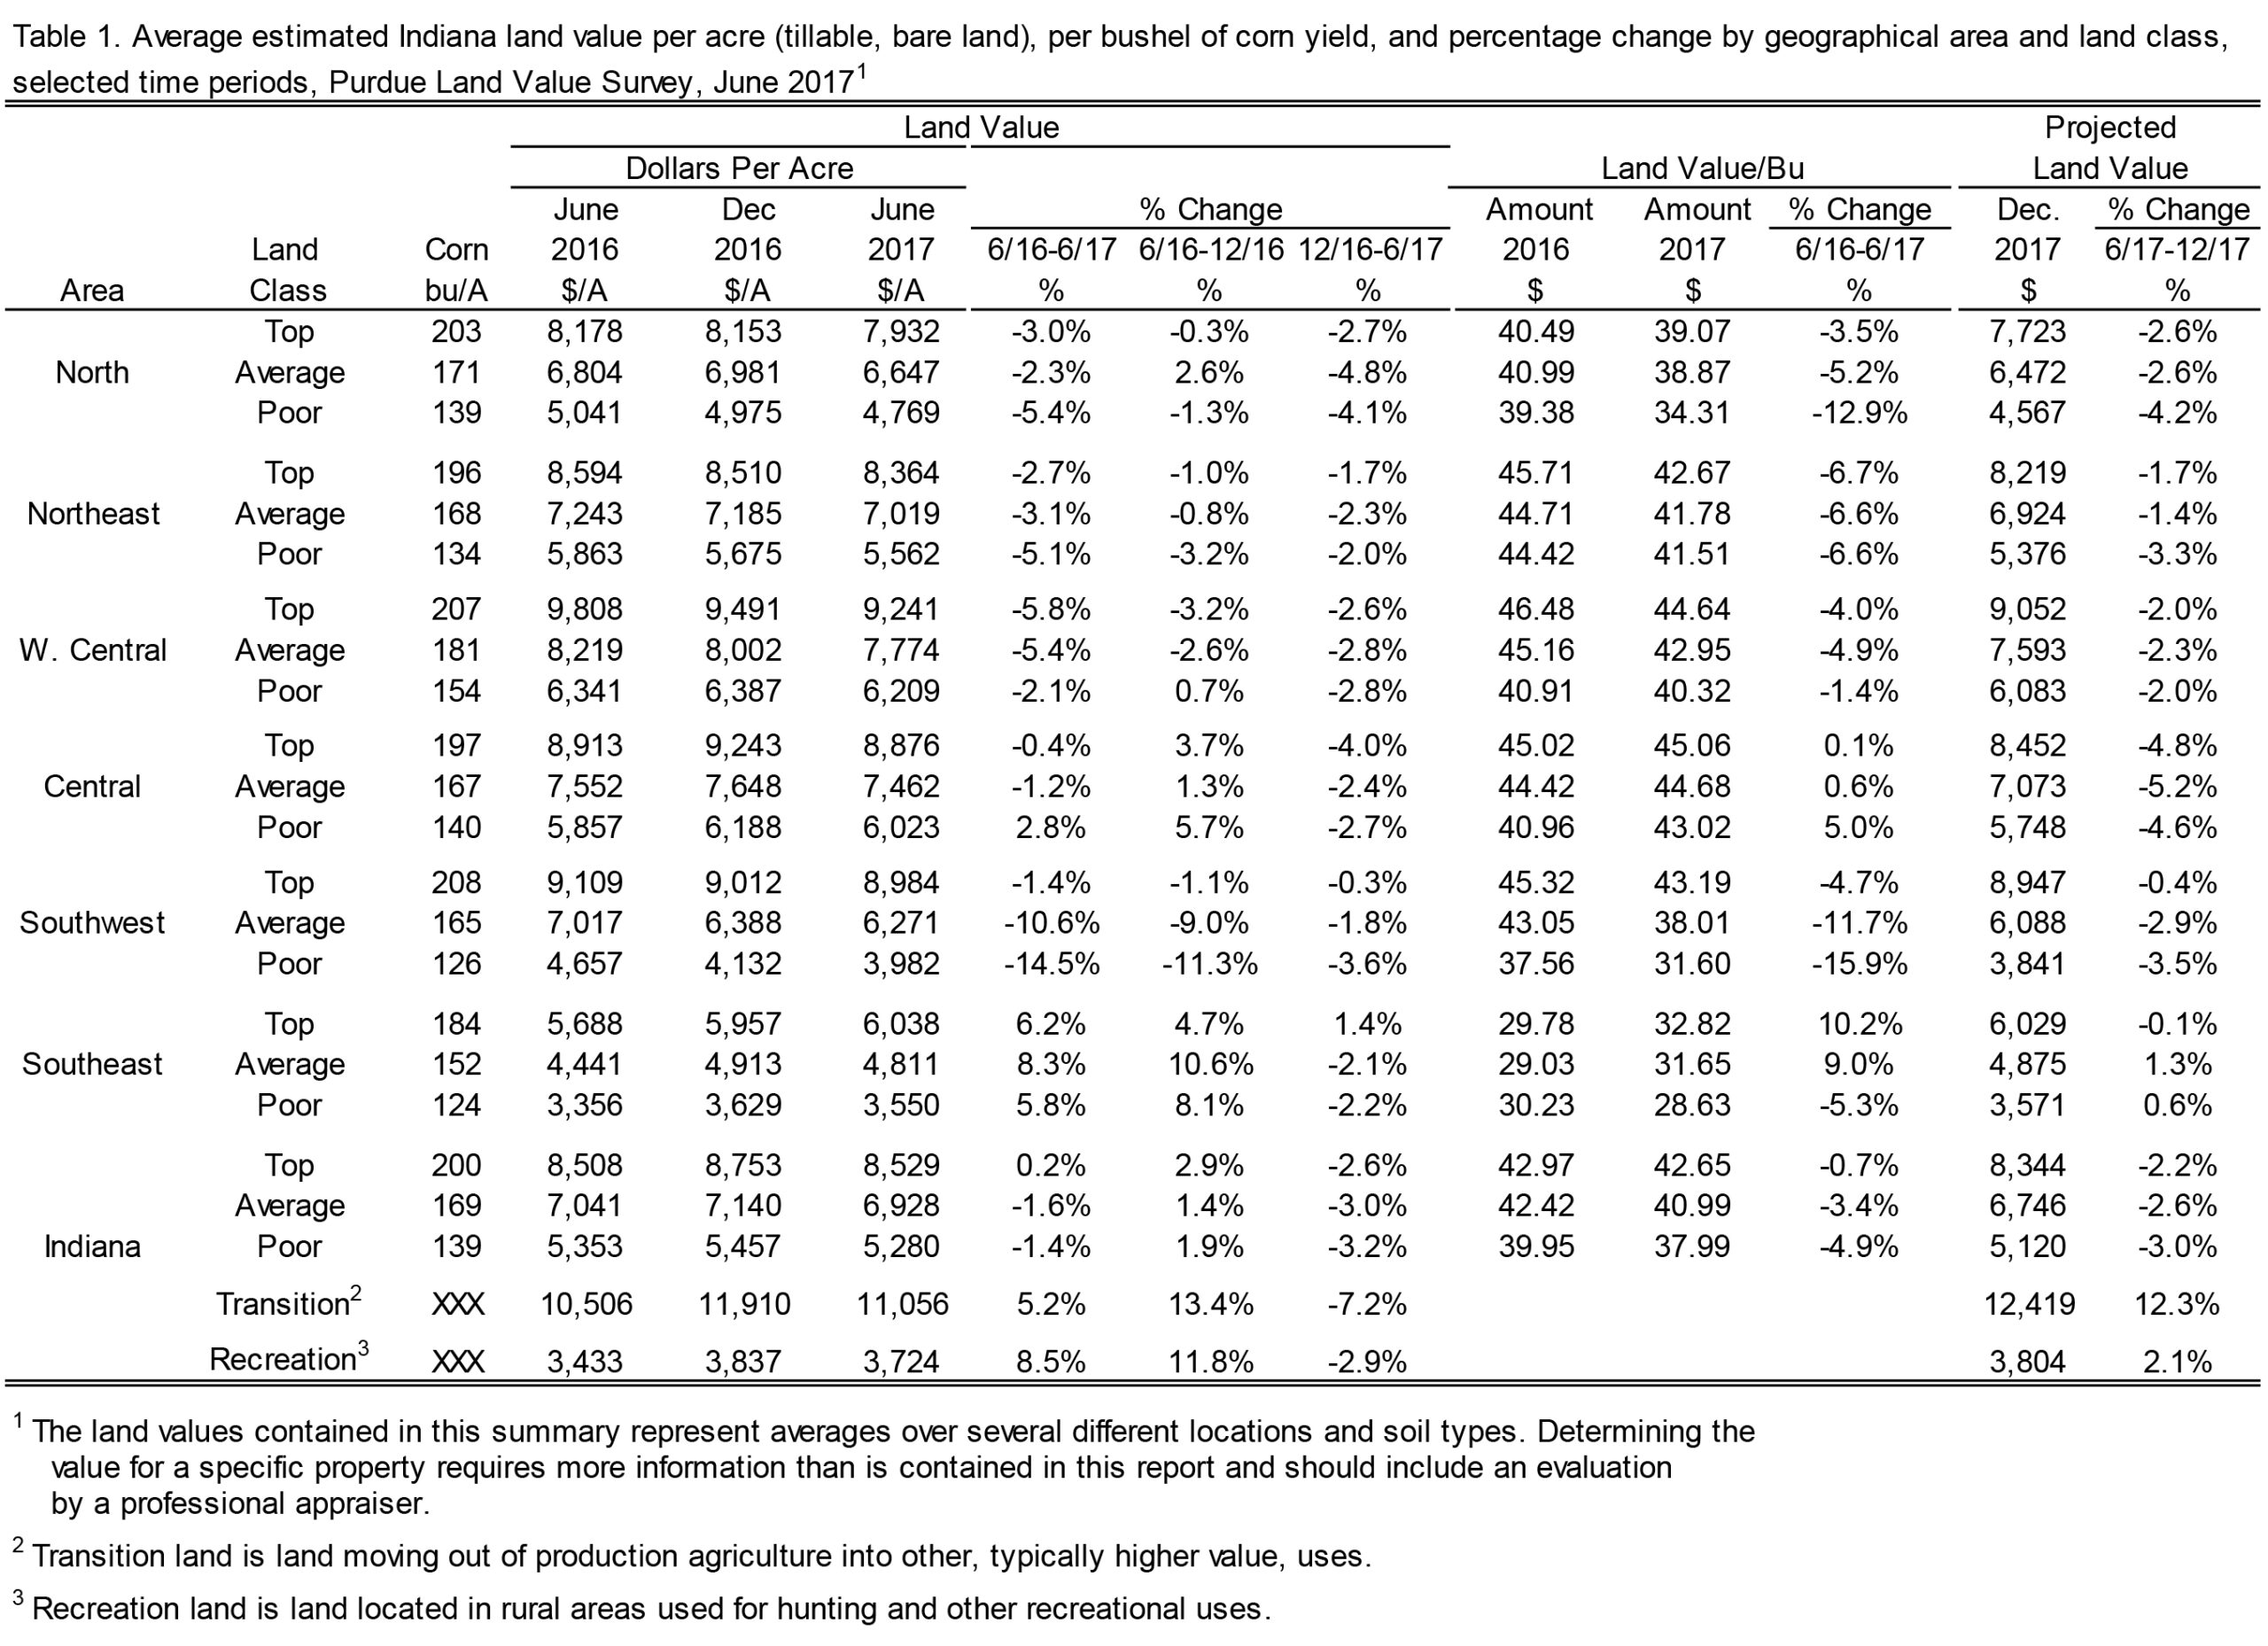
Table 1. Average estimated Indiana land value per acre (tillable, bare land), per bushel of corn yield, and percentage change by geographical area and land class, selected time periods, Purdue Land Value Survey, June 2017
Decreases in farmland values still outnumber increases. All regions of the state reported farmland value declines, except for the Southeast. While above trend yields for corn and soybeans last fall helped Indiana producers reduce their per unit cost of production, the continued high cost of many crop production inputs and low commodity grain prices kept margins tight. The one exception to high yields was in Southwest Indiana where corn yields were depressed due to disease pressure. This was likely a factor in the Southwest region having some of the largest value decreases.
Over the past 12 months from June 2016 to June 2017, farmland values tended to decline more in the latter half, December 2016 to June 2017. This was true for the state as a whole with values rising in the first half from June 2016 to December 2016, and then falling in the second half. More weakness in the second half was true for most districts with the exception of the Southwest where values were generally down sharply in the first half and less sharply in the second half. The Central region and the Southeast were also exceptions where they were up in the first half and then generally down in the second half.
The highest farmland values continue to be in the West Central region – ranging from $6,209 per acre for poor quality land to $9,241 per acre for top quality land. Farmland values in the Southeast region continue to be the lowest – ranging from $3,550 per acre for poor quality land to $6,038 per acre for top quality land.
The highest farmland value per bushel of corn are reported for the Central Region, ranging from $43.02 to $45.06 per bushel of long-term corn yield. This was followed by the West Central, and Northeast regions. Across all regions, the range in farmland values by quality was the largest in the Southwest with a difference of $11.59 per bushel. The smallest was the Northeast with a difference of $1.16 per bushel. In between these two regions, was the Central at $2.04, Southeast at $4.19, West Central at $4.32, and North at $4.76 per bushel. These differences indicate there is not a perfect match between productivity and farmland values, but there is a high positive correlation.
Survey respondents were asked to project the value of farmland for December 2017. For the state as a whole, respondents are pretty clear they expect farmland values to continue their decline. These declines ranged from 2.2% to 3.0% depending on land quality. The only positive changes expected for the six-month period are in the Southeast region where respondents anticipate values will be flat (-0.1%) to up 1.3%. The largest declines, 4.6% to 5.2%, are expected in the Central region.
Information about the value of farmland moving out of production agriculture into commercial and residential uses (transition land) was also gathered. The June state wide average value of transition land increased to $11,056 per acre. From the previous June, this was an increase of 5.2%. The state-wide average value of recreational land had an even larger increase, climbing from $3,433 per acre to $3,724 per acre, an increase of 8.5%. The recreational land value was higher in December 2016, but like cropland values declined after December.
The transition and recreation markets are characterized by having a very wide range of values in which location plays a big role in the value of the property. In markets of this type, the median value (the value dividing a series of ordered numbers in half) can provide additional information about the central tendency of the farmland values distribution. The statewide median for transition land values was $10,000 per acre. The statewide median for recreational land values was $3,500.
Respondents were asked to estimate the value of rural home sites located on a blacktop or well-maintained gravel road with no accessible gas line or city utilities. Like transitional farmland and recreational farmland, these properties have a very wide range in value. Because of this wide range, median values are reported (Table 2). The median value for five-acre home sites ranged from $9,125 per acre in the West Central region to $10,000 per acre in the Central, Southwest, and Southeast regions. Reported per acre median values of the larger tracts (10 acres) ranged from $8,000 per acre in the Southeast and West Central region to $10,000 per acre in the Central, North, and Northeast region.
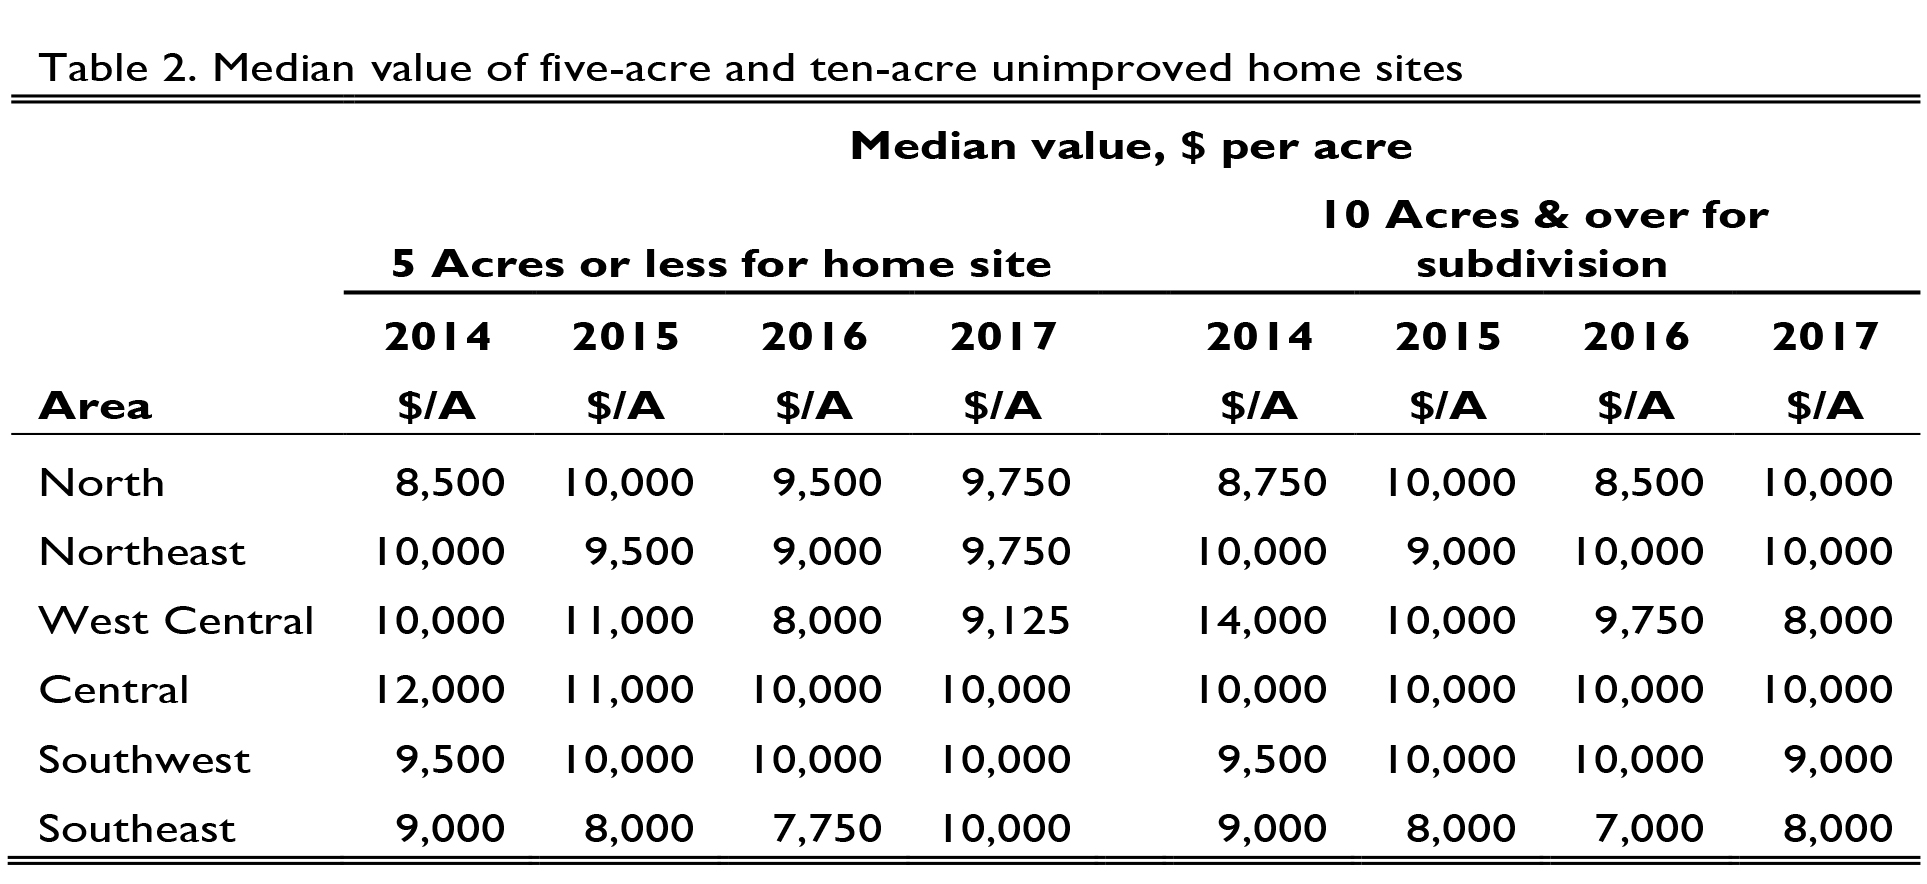
Table 2. Median value of five-acre and ten-acre unimproved home sites
Farmland Market Forces
Respondents were asked to evaluate the importance of eleven market forces having the potential to influence the farmland market. These items included: 1) current net farm income, 2) expected growth in returns to land, 3) crop price level and outlook, 4) livestock price level and outlook, 5) current and expected interest rates, 6) returns on alternative investments, 7) outlook for U.S. agricultural export sales, 8) U.S. inflation rate, 9) current supply of land for sale, 10) cash liquidity of buyers, and 11) current U.S. agricultural policy.
Respondents used a scale from -5 to +5 to indicate the effect of each item on farmland values. A negative influence is given a value from -1 to -5, with a -5 representing the strongest negative influence. A positive influence was indicated by assigning a value between 1 and 5 to the item, with 5 representing the strongest. An average for each item was calculated. In order to provide a perspective on changes in these influences across time, data from 2015, 2016, and 2017 are presented in Figure 2. The horizontal axis indicates the item from the list above.
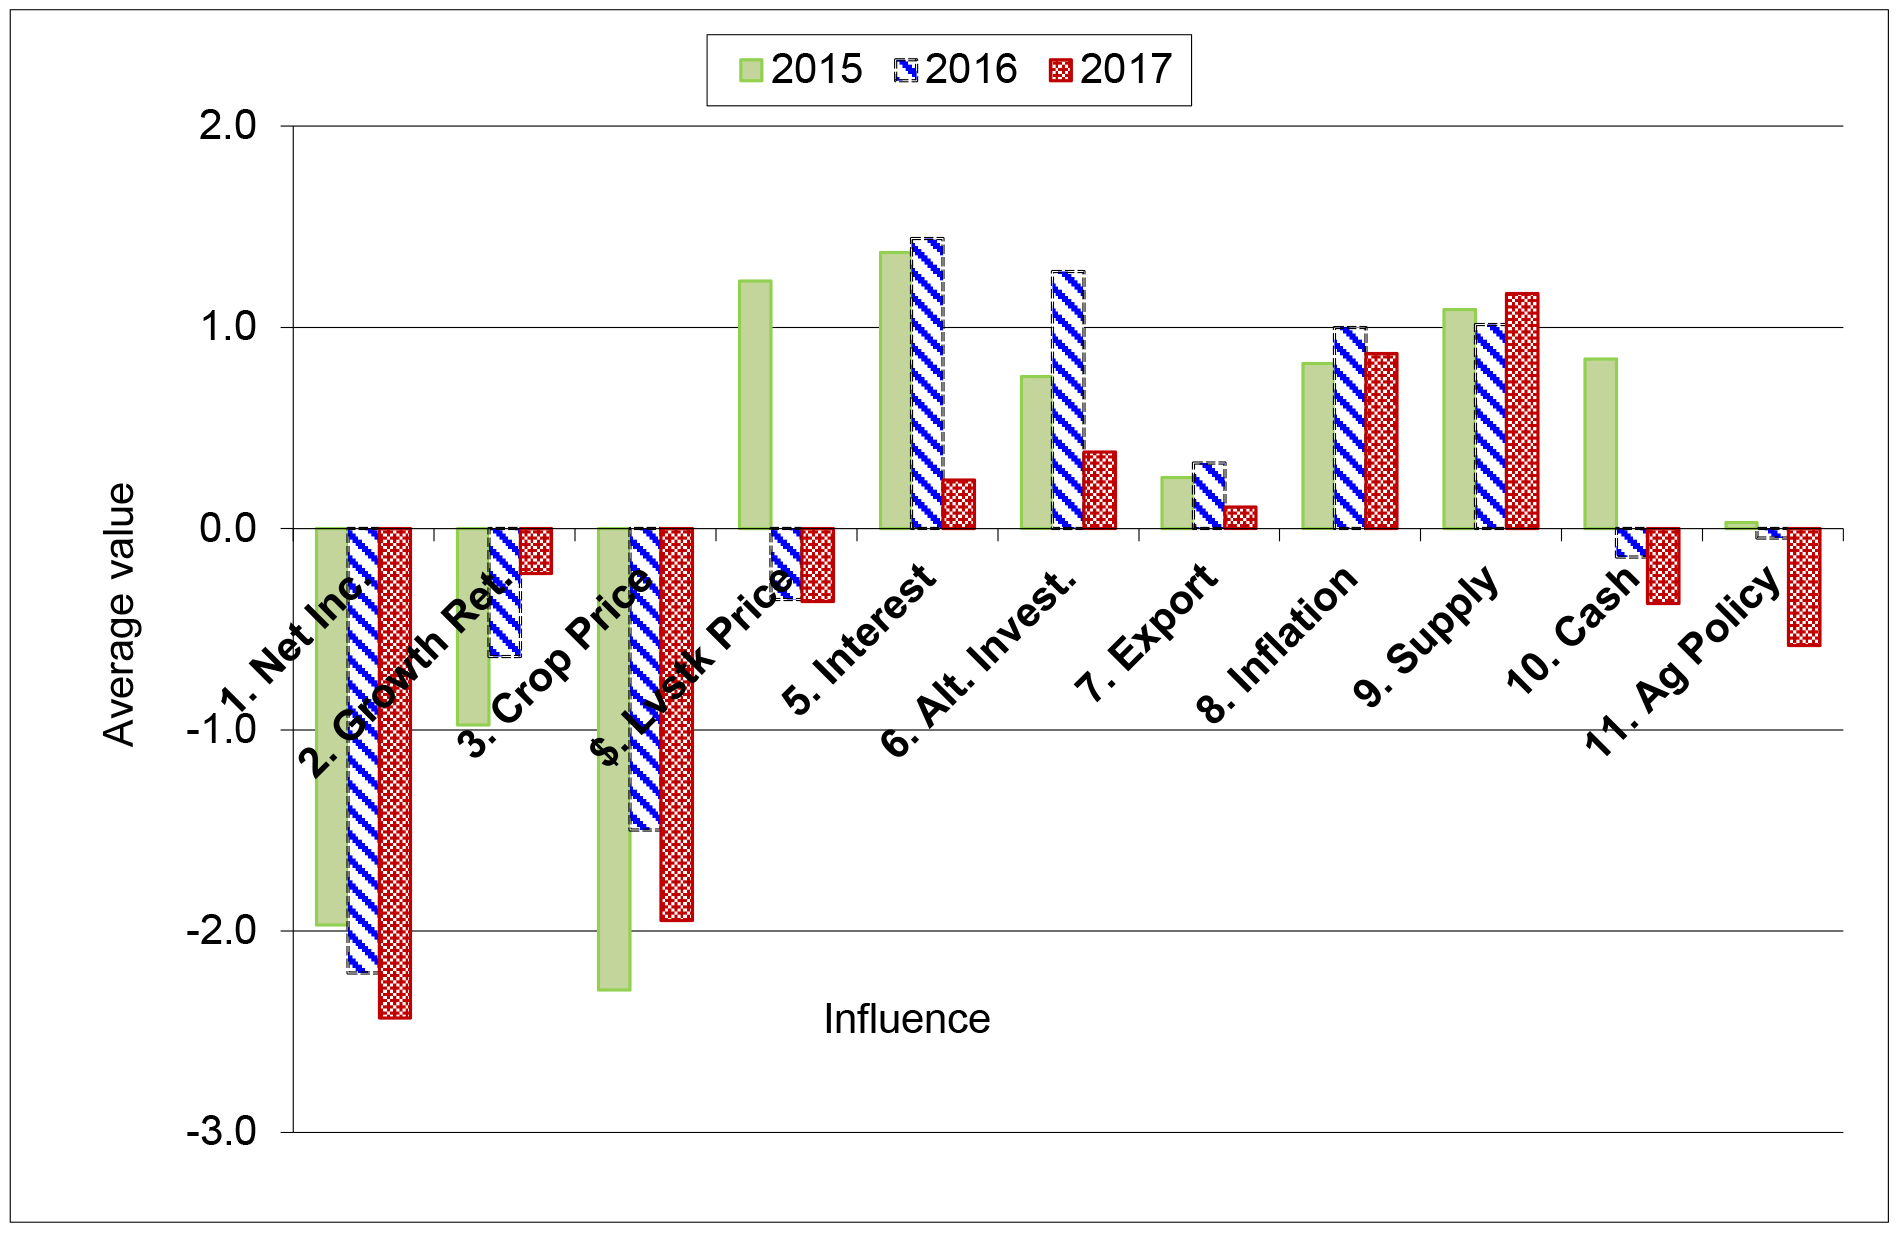
Figure 2. Influence of eleven market forces in 2015, 2016, & 2017
Given the large declines in grain prices and net farm income over the past three years, it is not surprising respondents placed negative influences on net farm income, expected growth in returns, crop prices, and livestock prices. While respondents have become more negative about net income (#1) over three years, the expected growth in returns to land (#2) has become less negative. The less negative influence of the expected growth in returns may be influenced by the cyclical nature of production agriculture. Low prices signal the need for a smaller supply and over time supply does decline helping to increase price. The passage of time also allows producers to reduce the per unit cost of production. The improving view of expected return to farmland may indicate that margin pressure is expected to lessen because the adjustment process is in its third year.
Both the cash liquidity of buyers and the role of agricultural policy have become more negative during this three-year period. In 2012 and 2013 the cash position of buyers was strongly positive and was at its peak. The liquidity of buyers has eroded since 2013. Since we began asking about market influences in 2001, the influence of agricultural policy was negative for the first time in 2016. The negative influence increased in 2017.
The positive influence of interest rates, alternative investments, and exports declined in 2017. Increasing long-term interest rates have been expected for several years but those increases never occurred. The expectations of higher interest rates are now becoming reality as the Federal Reserve makes changes to their low interest rate policy. The supply of farmland on the market and expectations about inflation are the strongest positive influences on the 2017 farmland market. Of these 11 influencers of land values, respondents lowered their scores for 8 of them this year. One stayed constant, and only two rose.
To obtain more information on how the supply of farmland may have changed, respondents were asked to compare the amount of farmland on the market in June 2017 to a year earlier and indicate if it was less, the same, or more. Compared to June 2016, the results are very similar (Figure 3). The major difference was a further decline in the number of respondents indicating more farmland was on the market. Most of this reduction shifted to the group indicating the amount of farmland on the market was the same. For respondents reporting an increase in the quantity of farmland on the market, the 2017 response of 5% is the smallest number recorded. The previous low was in 2016 at 7%. For respondents reporting a decline in the amount of land on the market, 57% is the largest recorded number.
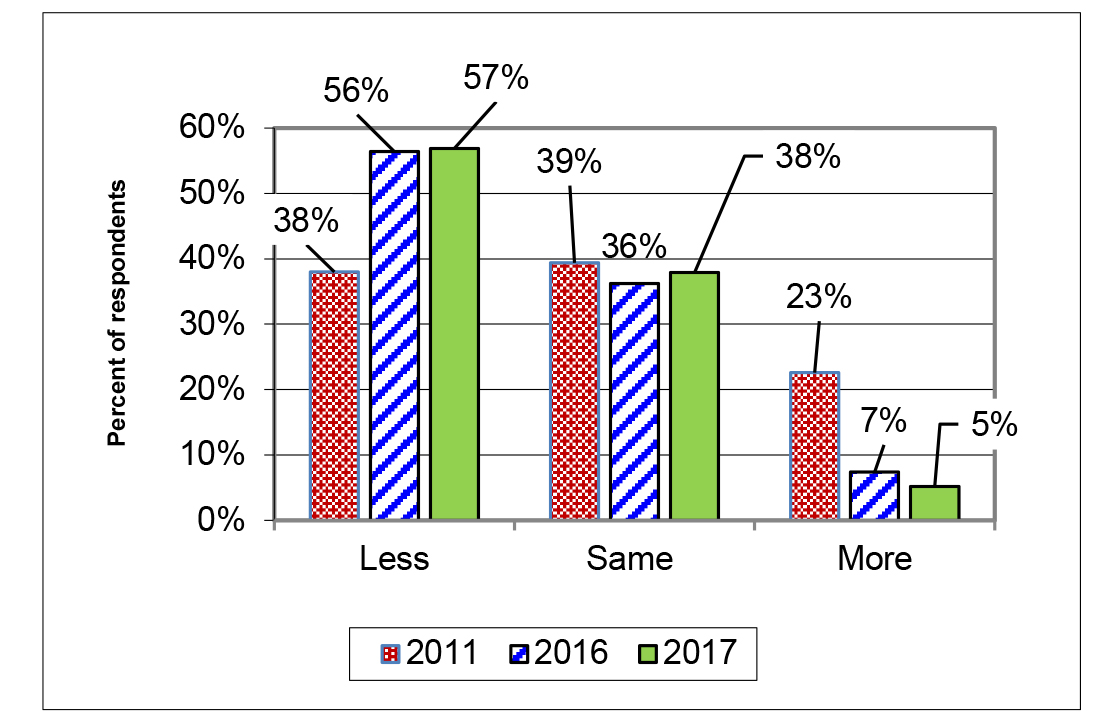
Figure 3. Percentage of respondents indicating less, same, or more farmland on the market than in the previous June
Figure 3 reports the results for 2011, 2016, and 2017. The largest number of respondents reporting an increase in the supply of farmland on the market was in 2011 at 23%. Reports of the same amount of farmland on the market are similar for all three years while reports of less land on the market was much lower in 2011.
Five-Year Forecasts
Respondents were asked to forecast the five-year average corn price, soybean price, mortgage interest rate, inflation rate, and finally the change in farmland value. The price and rate estimates for the past five years are presented in Table 3. The five-year average price of corn has been the most volatile. In 2013, respondents estimated the corn price would average $5.52 per bushel. This year the five-year average estimate is $3.79, a $1.73 lower. The five-year estimates for soybeans have fared better. For 2013 and 2014 respondents expected a five- year average just over $12.00 per bushel. Lower soybean prices led to a downward revision to the five-year estimate in 2015. Renewed strength in soybean prices resulted in a upward revision in 2016 to $10.23. The decline in soybean prices this year has resulted in lowering the 2017 five-year estimate.
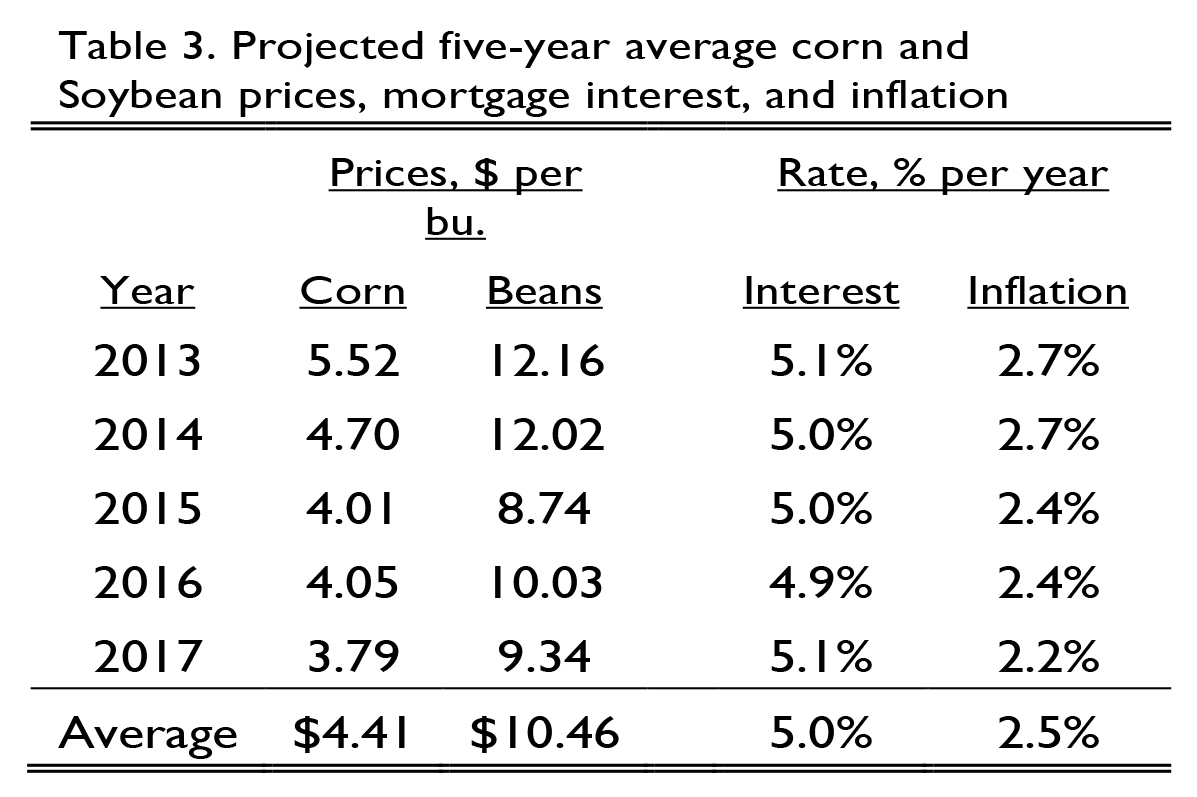
Table 3. Projected five-year average corn and Soybean prices, mortgage interest, and inflation
With an average mortgage interest rate of 5.1%, respondents expect interest rates to remain low for the next five years. Concern about rising inflation rates has declined. Over the past five years, inflation rate expectations have drifted slightly lower.
Given these estimates, where do respondents expect farmland values to be in five years? As expected, there is much less consensus about where farmland values will be in five years when compared to the estimates for the end of 2017. There were two closely balanced groups. One group expects farmland values to be lower in five years. This group was 26% of the respondents. The average decline was 13.6%. A second group expected farmland values to be close to their current value. This does not necessarily mean no change in farmland values. There could be ups and downs over five years, but in five years the value will be about where it is today. This was 29% of the respondents. The last group expects farmland values will be higher in five years. This was 45% of the respondents. While this is the largest group, history indicates a 9.5% increase on farmland values is a very modest increase. A pessimist might combine these groups to say only 45% expect farmland value to be higher in five years, while 55% expect farmland values to be the same or lower. An optimist might combine these groups to say 74% expect farmland value to be the same or higher in five years, while only 26% expect farmland values to be lower
Combining all three groups for the next 5 years provides a 0.7% increase expected in five years. Time will tell which might be correct, but this year’s survey does have a significant number of respondents expecting higher farmland prices in five years.
Cash Rent
The 2015 survey was the first survey since 1999 to report a state-wide decline in cash rents across all land qualities. State-wide cash rents in 2015 declined 1.3% to 2.4%. In 2016, the survey found a state-wide decline in cash rents of 9.8% to 10.9%.
This year there were only modest changes in cash rents, (Table 4). For 2017, top land had a cash rent of $253 per acre, a decline of 1.6%. Average quality land had a cash rent of $205 per acre, an increase of 0.5%. Poor quality land had a cash rent of $163 per acre, an increase of 3.8%.
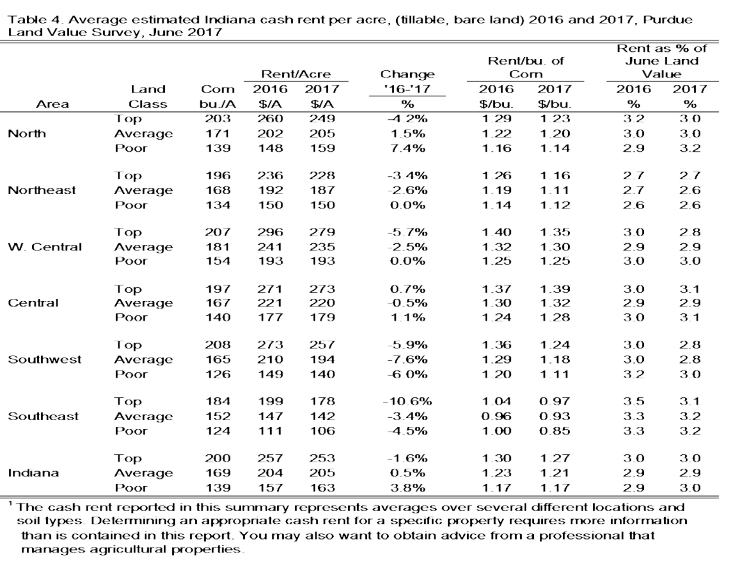
Table 4. Average estimated Indiana cash rent per acre, (tillable, bare land) 2016 and 2017, Purdue Land Value Survey, June 2017.
Comparing regional cash rent changes, there was a mixture of ups and downs across farmland quality in several regions. However, the Southwest and the Southeast reported declines in cash rent across all land qualities. Declines in the Southwest ranged from 5.9% for top quality land to 7.6% for average quality land. Declines in the Southeast ranged from 3.4% for average quality land to 10.6% for top quality land. All other regions reported a mixture of increases and decreases. The region with the smallest year-to-year change was the Central region where cash rent declined by 0.5% for average quality land and increased by 1.1% for poor quality land.
The West Central region consistently has the highest cash rents with top quality land having a 2017 average cash rent of $279 per acre, average quality land was at $235 per acre, and poor quality land had a cash rent of $193 per acre. The region with the second highest cash rent for top quality land was the Central region followed by the Southwest, North, Northeast, and Southeast regions. For average quality land, the order from highest cash rent to lowest was the West Central, Central, North, Southwest, Northeast, and Southeast. For poor quality land, the order was the West Central, Central, North, Northeast, Southwest, and Southeast. Cash rent in the Southeast region continued to be the lowest for all three land qualities.
State-wide cash rent per bushel declined for top and average quality land but remained the same for poor quality land. State-wide top quality farmland cash rent per bushel of long-term corn yield was $1.27, while cash rent per bushel for average land was $1.21, and cash rent per bushel for poor land was $1.17 per bushel. Cash rent per bushel decreased or remained the same for all land qualities except for the Central region. In the Central region cash rent per bushel increased across all land qualities.
The difference in cash rent per bushel across land quality continues to be small. For the state as a whole, the difference is only $0.10 per bushel. The largest regional difference in cash rent per bushel across land quality was $0.13 in the Southwest region and $0.12 in the Southeast. The smallest was $0.05 in the Northeast region. The North had a difference of $0.09. The difference in the West Central region was $0.10 and the Central was $0.11 per bushel. As with farmland values, this indicates a high positive correlation between productivity and cash rent.
On a state-wide basis, rent as a percent of land value remains around 3%. This is the fourth year in a row the relationship between gross cash rent and farmland value has been around 3%. For the last 30 years, this value has been steadily declining. Looking across regions, the largest return is in the Southeast and North region with annual gross returns of 3.0% to 3.2%. The Southwest, Central, and West Central region reported returns of 2.8% to 3.1% The Northeast reported returns between 2.6% and 2.7%.
Expected Changes in Cash Rent
Information was presented previously about expected corn and soybean prices, mortgage interest rates, the rate of inflation, and their influence on farmland values. These items also influence cash rent. Respondents were asked to indicate if they expected 2018 cash rents to be higher, the same, or lower. If they expected an increase or decrease, they were asked to indicate the percentage change. Only 7% of the respondents thought 2018 cash rents would be higher. The average increase expected was 8.2%. The group expecting no change in cash rent accounted for 34% of the respondents. The remaining 59% of the respondents expect cash rent to be lower in 2018. The average decline for the group was 9.3%. If one combines all responses about cash rent changes, respondents indicate a 4.9% decline in cash rent.
These expectations indicate continued tight margins putting downward pressure on cash rents and on other crop production inputs. 2017 saw a bit of a pause in the downward movement of cash rents. This is not surprising after the roughly 10% decline in 2016 cash rents. A 10% downward adjustment is an infrequent event. A smaller adjustment typically follows a large change in cash rents. But, most respondents are expecting 2018 rents to be flat or lower with an overall average decrease of 4.9%.
Combining Farmland Values and Cash Rent
One of the principles of economics and finance is that capital assets derive their value from the net cash return generated by the asset. The simplest form of this relationship can be expressed as V = E ÷ C, where V is the expected value of the asset, E represents the net annual earnings from the asset and C represents the capitalization rate. The capitalization rate is influenced by interest rates, risk premiums associated with being a landowner, expected rates of inflation, and expected growth rates in the net return.
Doing a few algebraic manipulations, the expression above can be expressed as V ÷ E = 1 ÷ C. This expression indicates the value-earnings ratio (or the price-earnings ratio) is equal to one divided by the capitalization rate. This relation tells us how many times annual earnings buyers are willing to pay to be landowners. It also tells us the value-earnings ratio is determined by the factors influencing the capitalization rate. As earnings rise and fall, the asset value will rise and fall, but if the capitalization rate remains constant, the ratio of value to earnings will remain the same. The value-earnings ratio for 1975 to 2017 is presented in Figure 4.
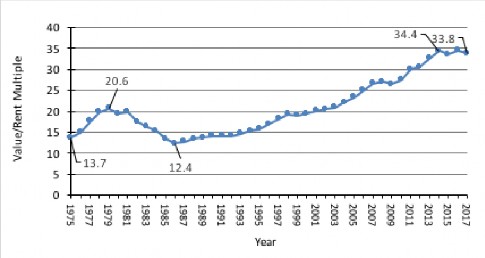
Figure 4. Value to Earnings Multiple for Average Indiana Farmland, 1975 to 2017
In 1975, people were willing to pay 13.7 times current cash rent to be landowners. This increased to 20.6 in 1979. With the sharp rise in long-term interest rates in the late 70s and early 80s the multiple dropped to 12.4 in 1986 (higher interest rates increase the capitalization rate). With the downward trend in interest rates (and lower capitalization rates) since 1986, the multiple rose to 34.4 in 2014. There was a dip in the value in 2015 to 33.5, but the value rebounded in 2016. 2017 indicates another small dip. If long-term interest rates continue to climb, it is expected this multiple will decline. If other factors such as earnings stay the same, then higher interest rates would result in lower farmland values.
Summary
Continued low grain prices and high costs are squeezing contribution margins forcing continued adjustments through the agricultural economy. The 2017 Purdue Farmland Value Survey found a state-wide increase of 0.2% for top quality farmland and a decrease of 1.6% and 1.4% for average and poor quality soils respectively.
While the underlying reasons for multiple years of tight contribution margins today are not the same as in the 1980s, a series of years with downward adjustments in farmland values and cash rents still seems likely this time as well. The adjustment in farmland values in the 1980s lasted for eight years. Currently, this is the third year of downward adjustment since the 2014 peak. Since that peak, state-wide farmland values have declined 12.7% for top quality land, 13.1% for average land, and 14.3% for poor quality land. The current outlook for continued tight contribution margins would suggest more years of downward adjustment.
Survey respondents are projecting lower five-year average corn and soybean prices than last year. Respondents are expecting long term interest rates over the next five years to be 20 basis points above last year’s estimate. Annual inflation rates are expected to remain stable. If respondents are correct, the per unit cost of production needs to be lowered even more. Lowering per unit production cost to this point has taken a combination of adjustments in lower input costs, higher yields, and lower cash rents and farmland values, each contributing a small change.
Many of this year’s respondents indicate they believe declining farmland values and cash rents are likely to continue being part of reducing per unit production costs. Over the last three years, Indiana state wide farmland values have declined about 13% to 14%. While this is only about one-half of the adjustment amount for the first three years of decline in the 1980s, declines this large are rare in the farmland market. Still, survey respondents continue to expect further declines of 2% to 3% during the last half of 2017 for state-wide averages.
State-wide cash rents for 2017 were 1.6% lower for top quality land, but 0.5% and 3.8% stronger for average and poor quality soils. The relatively strong showing for cash rents was likely related to generally strong Indiana yields in 2016. However, for 2018 respondents are expecting near a 5% decline in cash rents thus returning to the pattern of multiple years of downward adjustment.
This survey information brings important questions for individual producers. How will a continuation of declining farmland values and rents alter your situation or impact your business? What has been your historic breakeven point? What crop prices allow you to cover cash costs and total costs? How is your current financial position going to be influenced by continued low margins?
If the difference between market price and total breakeven cost per bushel is small, then making small-to- moderate changes on the part of tenants may get the breakeven costs down to, or below, the expected market price. However, if the distance between the market price and total breakeven costs per bushel is large, then more dramatic changes will need to occur.
Purdue Farmland Value and Cash Rent Survey
The Purdue Farmland Value and Cash Rent survey is conducted each June. The survey is possible through the cooperation of numerous professionals knowledgeable of Indiana ‘s farmland market. These professionals include farm managers, rural appraisers, land brokers, agricultural loan officers, Purdue Extension educators, farmers, and representatives of the Farm Service Agency (FSA) county offices. These professionals were selected because their daily work requires they stay well informed about farmland values and cash rents.
These professionals provide an estimate of the market value for bare poor, average, and top quality farmland in December 2016, June 2017, and a forecast value for December 2017. To assess the productivity of the farmland, respondents provide an estimate of long-term corn yield. Respondents also provide a market value estimate for land transitioning out of agriculture and recreational land.
We express a special appreciation to the support staff of the Department of Agricultural Economics. Tracy Buck coordinated survey mailings and handled data management. Without her capable assistance the survey would not have happened.
The data reported here provide general guidelines regarding farmland values and cash rent. To obtain a more precise value for an individual tract, contact a professional appraiser or farm manager that has a good understanding of the local situation.
Prior reports are located at: https://ag.purdue.edu/agecon/Pages/Purdue-Agricultural-Economics-Report-Archive.aspx
[1]The Chicago District includes Iowa and Michigan, and parts of Wisconsin, Illinois, and Indiana.
[2]The Purdue Farmland Value Survey was first published in August 1974. Individuals surveyed include rural appraisers, commercial bank and Farm Credit Mid- America agricultural loan officers, FSA personnel, farm. managers, and farmers. Survey results provide information about the general level and trend in farmland values and cash rents. It does not indicate the specific values for an individual farm
![]()
![]()
![]()
![]()
![]()
