2004 Indiana Farmland Values & Cash Rents Continue to Climb
August 1, 2004
PAER-2004-7
Craig L. Dobbins and Kim Cook
![]()
![]()
![]()
![]()
![]()
The June 2004 Purdue Land Values Survey found that on a state-wide basis bare Indiana cropland ranged in value from $2,131 per acre for poor land, to $3,278 per acre for top land
(Table 1). Average bare Indiana cropland had an estimated value of$2,693 per acre. For the 12-month period ending in June 2004, this was an increase of 8.4%, 7.3% and 8.0%, respectively for poor, average, and top land. Increases this large have not been experienced since 1996-1997 when the Purdue Land Values Survey reported a state wide increase of 12% to 15%.
Part the difference in land values reflects productivity differences. As a measure of productivity, survey respondents provide an estimate of long-term corn yields. The average reported yield was 105, 135, and 165 bushels per acre, respectively for poor, average, and top land. The value per bushel for different land qualities was very similar, ranging from $19.88 to $20.34 per bushel.
The average value of transitional land, land moving out of agriculture, increased 9.0% this year. The average value of transitional land in June 2004 was $7,561 per acre. Due to the wide variation in estimates for transitional land, the median value* may give a more meaningful picture than the arithmetic average. The median value of transitional land in June 2004 was $6,000 per acre.
Statewide Rents
Cash rents increased statewide $2 to $3 per acre (Table 2), continuing the steady increase of the past several years. The estimated cash rent was $150 per acre on top land, $122 per acre on average land, and $96 per acre on poor land. This was an increase in rental rates of 3.2% for poor land, 1.7% for average land, and 2.0% for top land. State wide, rent per bushel of estimated corn yield ranged from$0.90 to $0.92 per bushel.
Cash rent as a percentage of value continued to decline. For top farm-land, cash rent as a percentage of farmland value was 4.6%. For poor and average farmland, cash rent as a percentage of farmland was 4.5%. These values are the lowest reported in the 28-year history of the Purdue Land Value Survey.
Area Land Values
Survey responses were organized into six geographic areas of Indiana (Figure 1). While all regions of the state reported increases in farmland values for the year, these increases varied across the state (Table 1). The North and Northeast regions exhibited the strongest increases, ranging from 10.7% to 12.9%. The West Central region also reported strong price increases, ranging from 8.8% to 9.8%. Increases in the Central region ranged from 6.4% to 6.9%. With the exception of the poor land in the Southwest region, the increases in the Southwest, and Southeast regions were more modest.
The highest valued land continues to be the top-quality land in the Central region, $3,551 per acre. This region was followed by North ($3,382), West Central ($3,351), Northeast ($3,192), Southwest ($2,909), and Southeast ($2,874).
Land value per bushel of estimated long-term corn yield (land value divided by bushels) is the highest in the Central region, ranging from $20.91 to $22.59 per bushel. This was followed by the West Central, North, and Northeast with values ranging from $19.62 to $20.65. The Southwest had the lowest land value per bushel, ranging from $15.91 to $17.98 per bushel.
Respondents were asked to estimate the value of rural home sites with no accessible gas line or city utilities and located on a black top or well-maintained gravel road. The median* value for five-acre home sites ranged from $5,000 to $8,000 per acre (Table 3). Estimated per acre median values of the larger tracts (10 acres) ranged from $5,000 to $7,900 per acre.
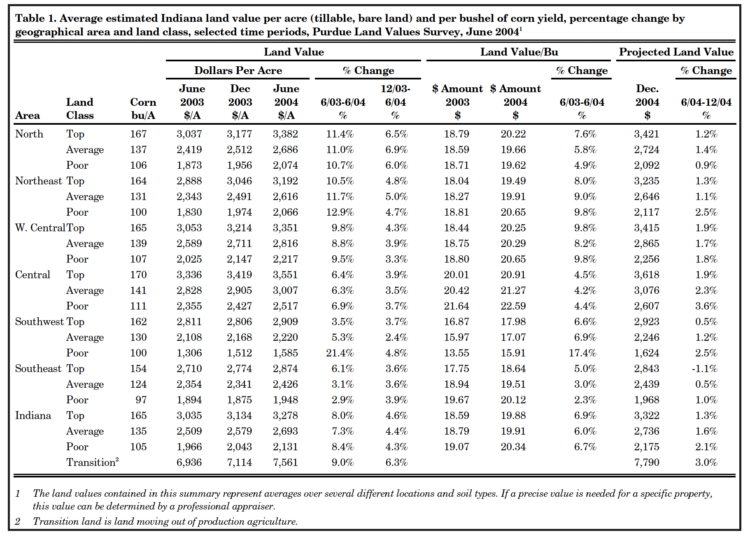
Table 1. Average estimated Indiana land value per acre (tillable, bare land) and per bushel of corn yield, percentage change by geographical area and land class, selected time periods, Purdue Land Values Survey, June 2004
Area Cash Rents
All areas of the state reported increases in cash rent (Table 2). The only reduction in cash rent was for top land in the Southwest region. The strongest increase in cash rent occurred in the North region.
Cash rents are the highest in the Central and West Central regions. The cash rents in these two regions were very similar for all three land qualities. There was no difference in top land and only $1 difference in poor land. There was $4 difference in average land. Cash rents per bushel for the West Central and Central regions ranged from $0.94 to $1.02 per bushel. These per bushel rents are the highest in the state. The next highest per-bushel rent was in the North and Southwest, ranging from$0.88 to $0.90. Per bushel rents in the Northeast ranged from $0.81 to
$0.85. The lowest per bushel cash rents were $0.74 to $0.77, reported for the Southeast.
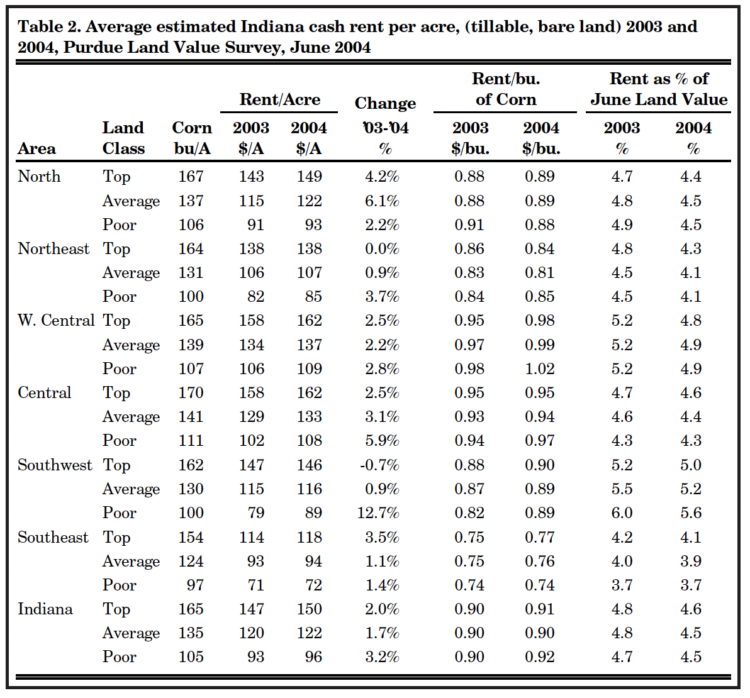
Table 2. Average estimated Indiana cash rent per acre, (tillable, bare land) 2003 and 2004, Purdue Land Value Survey, June 2004
Farmland Supply & Demand
The supply of land on the market and the number of interested buyers and their expectations are important influences in the farmland market. To assess the supply of land on the market, respondents were asked to provide their opinion about the amount of farmland on the market now compared to a year earlier. The respondents were asked to indicate if the amount of land on the market now compared to a year earlier was more, the same or less. At 17%, the 2004 results had a few more respondents indicating more land on the market than last year (Figure 2). However, 83% of the respondents indicated that the amount of land on the market at the current time was the same or less than a year ago. These results continue to indicate the quantity of land for sale remains limited.
Respondents were also asked to provide their perceptions of changes in who was interested in buying farmland. Compared to a year earlier, respondents were asked to indicate if interest by farmers, rural residents, or nonfarm investors in making a farmland purchase had increased, decreased, or remained the same. Interest from farmers showed the largest change. This year, just over 61% of the respondents indicated that when compared to the previous year there was increased interest from farmers (Figure 3). This continues an upward trend in the number of respondents indicating increased farmer interest in farmland purchases.
The demand for rural residents continues to be strong, 73% of the respondents indicated an increase in demand for rural residences. Twenty-four percent indicated that demand for rural residences remained the same. Three percent of the respondents indicated a decline in the demand for rural residents. These responses are similar to those of past years and indicate that demand for rural residences remains strong.
The stock market has shown some recovery from its steep decline, but interest rates continue to be low. Interest from nonfarm investors in acquiring farmland for their portfolios appears to be strong with 51% of the respondents indicating increased interest compared to last year (Figure 4). While still strong, it is not as strong as reported last year. Only 9% of the respondents indicated a decline in the number of interested nonfarm investors.
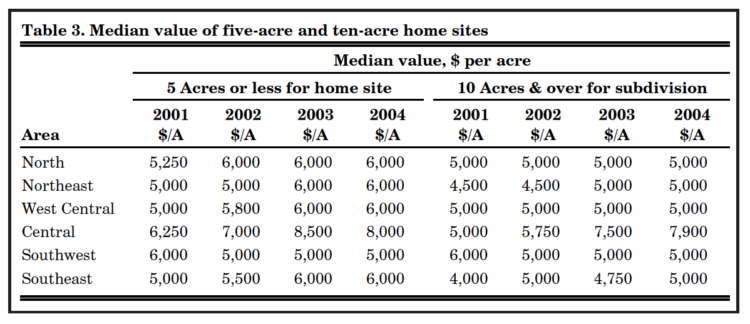
Table 3. Median value of five-acre and ten-acre home sites
Future grain prices, interest rates, inflation, changes in farmland values
Making a farmland purchase is a long-term commitment. An important component of the current price is the expected future earnings. As a result, expectations regarding crop prices over the next few years have a strong influence on farmland values. In order to gain insight into price expectations, respondents were asked to estimate the annual average on-farm price of corn and soybeans for the period 2004 to 2008.
This year saw a significant increase in the expected five-year average price of corn and soybeans (Table 4). Average corn price expectations for the next five years increased $0.27 per bushel to $2.54. The average price for soybeans increased nearly a dollar to $6.40. It has been six years since respondents have been this optimistic about corn and soybean prices. These price expectations indicate a more positive revenue outlook. Only the passage of time will determine if this optimism is well founded.
At this time, changes in interest rates are a hot topic in the business news. Unlike past discussions, the current discussion is about increases rather than decreases. In late June, the Federal Reserve raised the federal funds rate by 0.25%. Not surprising, the expected five-year average interest rate increased this year. While this ended the downward trend of the past several years, the increase was only 0.4%. At 6.9% the expected farm mortgage interest rate is still well below the series average of 9.5%.
Survey respondents are also expecting the inflation rate over the next five years to be a little higher. The increase in the expected rate of inflation to 2.8% ended the steady decline of the last several years.
Another important expectation that influences current farmland price is the expected future change in farmland values. Table 1 indicates that for the six-month period from June to December 2004, survey respondents expect values to continue to increase. On a state wide basis this increase is expected to range from 1.3% to 2.1%. As with current values, there are regional differences. The strongest changes are expected in the Central region. The only expected decline is for top land in the Southeast region.
Respondents were also asked to project farmland values five years from now. Eighty percent of the respondents expect farmland values to be higher, 12% of the respondents expect farmland values to be the same, and 8% expect farmland values to be lower. For those expecting land values to increase, the average expected increase was 9.5%. For those expecting land values to decline over the next five years, the average decline was 9.2%. Combining all estimated increase, decrease, and no change responses provided in an expected increase in farmland values over five years of 6.8%.
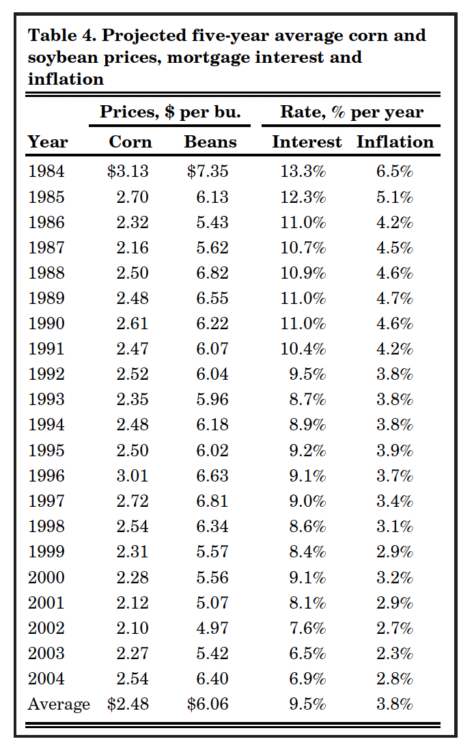
Table 4. Projected five-year average corn and soybean prices, mortgage interest and inflation
Summary
Over the past year, Indiana farmland values have moved strongly higher. The limited supply of land for sale combined with strong demand for farm expansion, country residences and nonfarm development, and continued interest from nonfarm investors in farmland purchases continues to provide strength to Indiana’s farmland market.
To obtain a more comprehensive assessment of the relative strength that various influences exert on farmland values, survey respondents were asked to assess the influence
of 11 different items on farmland values. These items included:
- Current net farm income,
- Expected growth in returns,
- Crop prices & outlook,
- Livestock prices & outlook,
- Current & expected interest rates,
- Returns on competing investments,
- S. agricultural export sales,
- S. inflation/deflation rate,
- Current inventory of land for sale,
- Current cash liquidity of buyers, and
- Current U.S. agricultural policy.
Respondents were asked to use a scale from -5 to +5 to indicate the effect each item has on current farmland values. If the item had a major negative influence, it would be given a -5. If the item had a small negative influence, it would be given a -1. Positive influences were assessed in the same way, except positive weights were used. An average for each item was calculated.
In order to provide a perspective on the changes in these influences, both 2003 and 2004 data are presented in Figure 5. The numbers on the horizontal axis of the chart indicate the number of the influence in the above list.
In 2004, all factors were positive. In contrast to 2003, the item with the highest average influence was the crop price level and outlook (3). This was followed by current net farm income (1), the current inventory of land for sale (9), and the current cash liquidity of buyers (10). Current and expected interest rates (5) and returns on competing investments (6) continue to have positive influences, but they are less important than in 2003.
At the current time, there are a number of positive influences in Indiana’s farmland market pointing to increased values. What could derail a continued increase in farmland values? One possibility is a sharp decline in grain prices. In June 2003 the market was hoping for some price improvement. That hope was more than realized, not only for grains but livestock. Prices have also quickly declined. Another possibility is a sharp rise in inflation and interest rates. A sharp rise in long-term interest rates would slow development demand, provide more attractive alternative investments, as well as increase the cost of borrowed money. Still another possibility is a sharp rise in production costs. The tight supply of natural gas has resulted in higher nitrogen prices. There are also higher fuel prices. Interest rates on operating loans are also likely to increase. If these and other input costs rise, margins from crop production are likely to narrow, reducing the income capitalized into farmland values.
While the likelihood of these events or their impact may seem low, it is important to remember that a farmland investment is a long-term investment. The wisdom of a farm-land investment will be determined not by the income of next year but the next several years. Prudent planning requires investigating if there is a sufficient cushion to allow the business to withstand unexpected events that reduce net revenue. It is also important to remember that farmland is an illiquid investment. Selling a tract that should not have been purchased can often take longer than anticipated. If a farmland purchase or sale is planned, the data reported here provides general guidelines regarding farmland values. Before a purchase or sale is made, you will want to carefully research the alternative to obtain a more precise value.
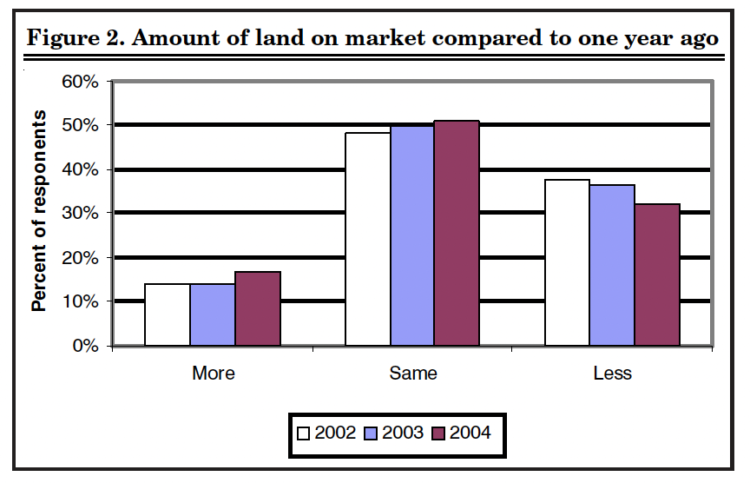
Figure 2. Amount of land on market compared to one year ago
Pasture rent
Occasionally we include extra questions in our survey to obtain information about a particular topic. This year, we asked about pasture rent. We received 119 responses to this question. The number of responses, the average annual cash rent for the pasture, and the average acres required per cow are presented below.
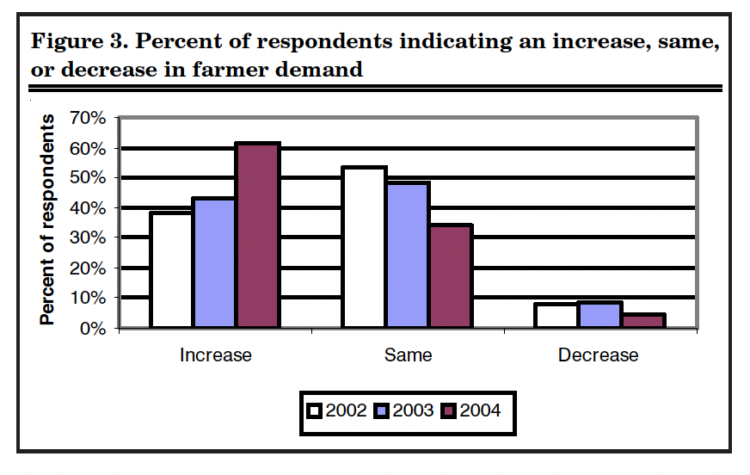
Figure 3. Percent of respondents indicating an increase, same, or decrease in farmer demand
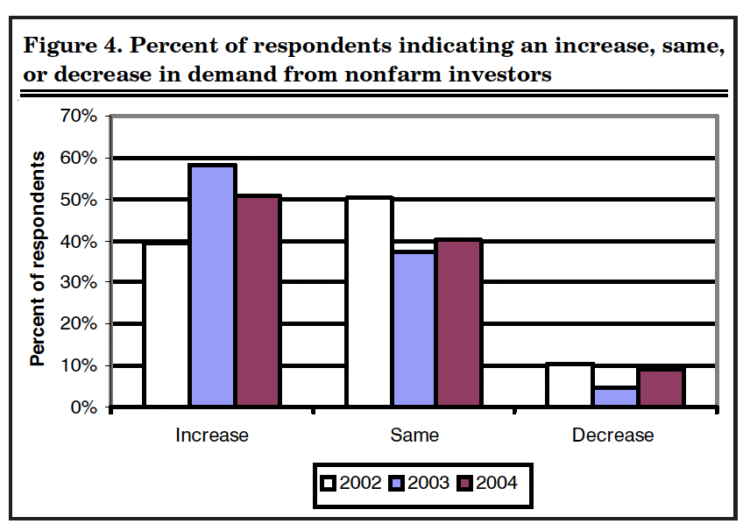
Figure 4. Percent of respondents indicating an increase, same, or decrease in demand from nonfarm investors
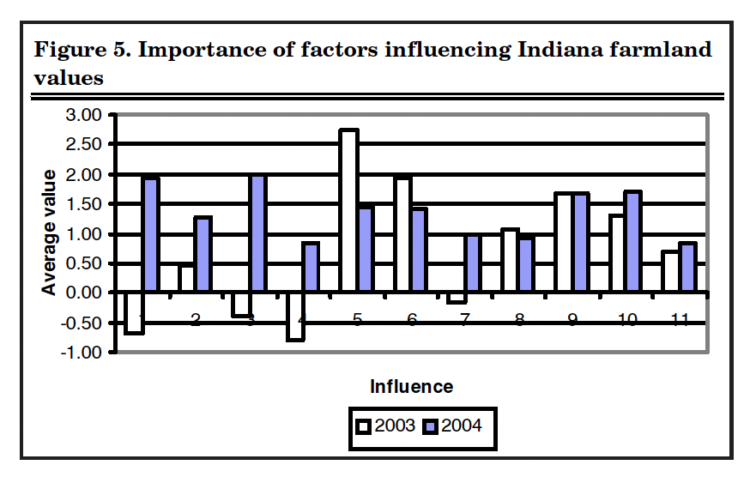
Figure 5. Importance of factors influencing Indiana farmland values
Purdue Land Value and Cash Rent Survey
The Purdue Land Value and Cash Rent Survey is conducted each June. The survey was made possible through the cooperation of numerous professionals that are knowledgeable of Indiana’s farmland market. These professionals include farm managers, appraisers, land brokers, bankers, Purdue Extension educators, farmers, and persons representing the Farm Credit System, the Farm Service Agency (FSA) county offices, and insurance companies. Their daily work requires that they stay well informed about land values and cash rents in Indiana.
These professionals are asked to provide an estimate of the market value for poor, average, and top quality farmland in December 2003, June 2004, and the expected value for December 2004. They are also asked to provide an estimate of the current cash rent for each land quality. To assess the productivity of the land, respondents provide an estimate of long term corn yields. Respondent are also asked to provide a market value estimate for land transitioning out of agriculture.
Responses from 321 professionals are contained in this year’s survey represent all but one Indiana county. There were 64 responses from North region, 53 responses from the North-east region, 72 responses from the W. Central region, 64 responses from the Central region, 35 responses from the southwest region, and 31 responses from the Southeast region. Figure 1 illustrates the counties in each region.
The data reported here provides general guidelines regarding farm-land values and cash rent. To obtain a more precise value for an individual tract, contact professionals in your area that have a good understand of the local situation.
We express appreciation to Carolyn Hunst of the Department of Agricultural Economics for her help in conducting the survey.
* The median value is the value of the data item which divides data arranged in ascending or descending numerical order in half.
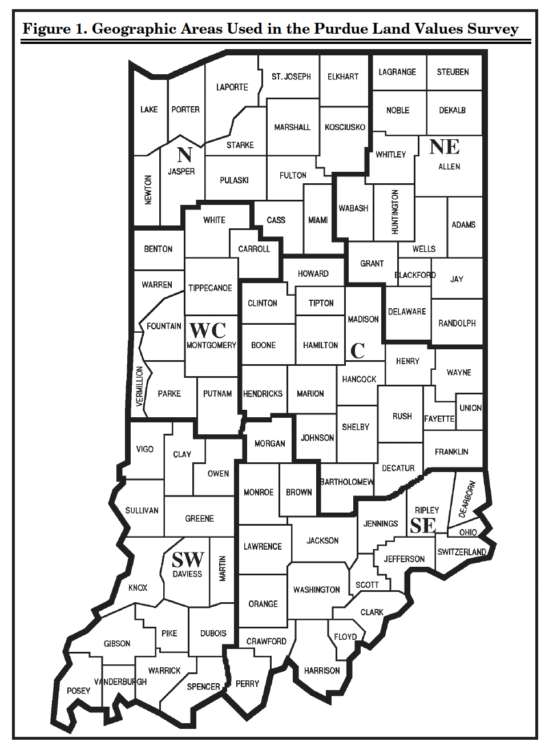
Figure 1. Geographic Areas Used in the Purdue Land Values Survey
![]()
![]()
![]()
![]()
![]()
