2007 Indiana Farmland Values & Cash Rents Jump Upward
August 1, 2007
PAER-2007-07
Craig L. Dobbins, Professor; Kim Cook, Research Associate
![]()
![]()
![]()
![]()
![]()
What a difference a year can make. Last year at this time, there were questions about whether or not farmland values were nearing a top. There are no such discussions this year. This year the question is “How high might farmland values and cash rent go?”
State-wide Land Values
Higher corn and soybean prices brought about by the increased demand for these crops are being translated into higher farmland values and cash rents. The June 2007 Purdue Land Value Survey found that farmland values in all areas of the state took a sharp turn upward. On a state-wide basis, the average value of bare Indiana cropland ranged from $2,991 per acre for poor quality land to $4,407 per acre for top quality land (Table 1). Average quality Indiana cropland had an estimated average value of $3,688 per acre. For the 12-month period ending in June 2007, this was an increase of 19.2%, 16.6%, and 16.9%, respectively for poor, average, and top quality land. One needs to go back to 1977 to find a larger annual increase in Indiana farmland values.
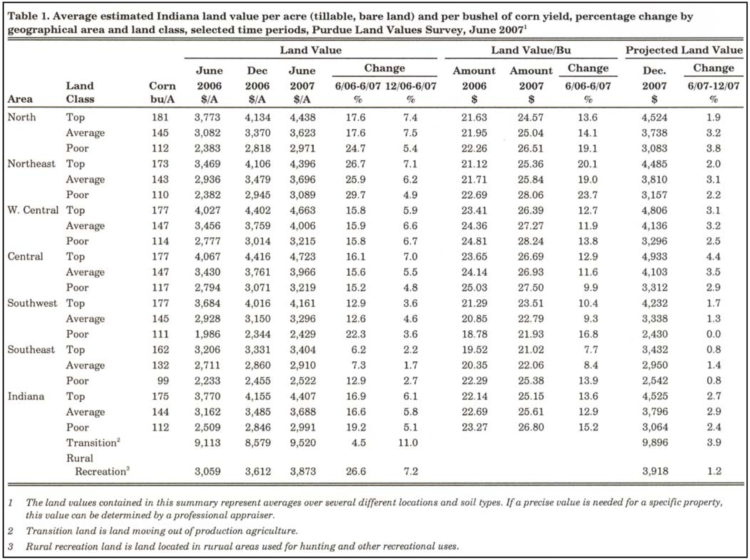
Table 1. Average estimated Indiana land value per acre (tillable, bare land) and per bushel of corn yield, percentage by geographical area and land class, selected time periods, Purdue Land Values Survey, June 2007
Land quality was measured in the survey by asking survey respondents * The median is the middle observation in data that have been arranged in ascending or descending numerical order to provide an estimate of long-term corn yields. The average reported yield was 112, 144, and 175 bushels per acre, respectively for poor, average, and top quality land. State-wide, the value per bushel for different land qualities was very similar, ranging from $25.15 to $26.80 per bushel. On a per bushel basis, the most expensive land is the poor quality land with a value of $26.80 per bushel. Top quality land was the least expensive at $25.15 per bushel.
The average value of transitional land, land moving out of agriculture, increased 4.5% this year. The average value of transitional land in June 2007 was $9,520 per acre. However, there is a very wide range of values for transitional land – from twice its agricultural value to more than ten times its agricultural value. These values are strongly influenced by what the land is transitioning into and its location. Due to the wide variation in estimates for transitional land, the median value* may give a more meaningful picture than the arithmetic average. The median value of transitional land in June 2007 was $7,500 per acre.
Survey respondents indicated the value of rural recreational land, land used for hunting and other recreational uses, is $3,873 per acre across Indiana. This average is more than average quality farmland. But as with transitional land, there is a wide range of values for rural recreational land. The June values reported for recreational land varied from $975 to $10,000 per acre. The median value for rural recreational land in June was $3,500 per acre.
State-wide Rents
One important contributor to the value of farmland is the annual rent that can be obtained from ownership. State-wide, cash rents increased $10 to $16 per acre (Table 2). The largest dollar increase in rent was for top quality land. The smallest dollar increase in rent was for poor quality land. The estimated cash rent was $171 per acre on top quality land, $139 per acre on average quality land, and $110 per acre on poor quality land. This was an increase in rental rates of 10% for poor quality land, 9.4% for average quality land, and 10.3% for top quality land. Again, this is the largest annual increase in cash rent since 1977. State-wide, rent per bushel of estimated corn yield ranged from $0.97 to $0.99 per bushel.
Cash rent as a percentage of value continued to decline. For top quality farmland, cash rent as a percentage of farmland value was 3.9%. For average and poor quality farmland, cash rent as a percentage of farmland value was 3.8% and 3.7%, respectively. Over the 32-year history of the survey, rent as a percentage of farmland value has averaged 6.0%. The cash rent as a percentage of value in 2007 continues the downward trend in that began in 1987. It is important to remember that the rent used in this calculation is the gross rent. Subtracting ownership expenses such as real estate taxes, maintenance, management, etc. from the gross rent will make the net rent as a percent of land value even lower.
Area Land Values
Survey responses were organized into six geographic regions of Indiana (Figure 1). As in the past years, there are geographic differences in land value changes. This year Northeast Indiana reported the strongest percentage increases in land value. Bare farmland in these areas was estimated to have increased by 25.9% to 29.7% (Table 1). The increase in value in the North, West Central, Central, and Southwest were also strong. For most of the productivity levels, the rate of increase ranged from 12.6% to 17.6%. The exceptions to this were the changes in the value of poor quality land in the North and Southwest with changes of 24.7% and 22.3%, respectively. The increase in farmland values in the Southeast was more modest, ranging from 6.2% to 12.9%.
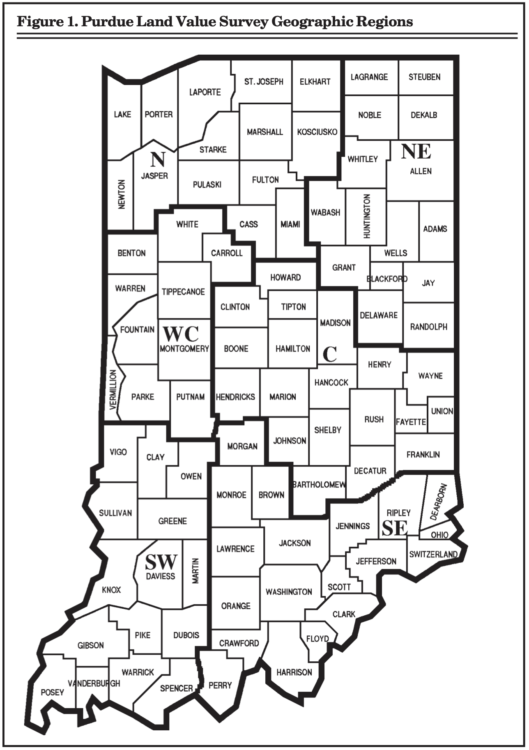
Figure 1. Purdue Land Value Survey Geographic Regions
The highest average farmland values are in West Central and Central Indiana. While the Central Indiana top and poor quality farm- land values are slightly higher than those in West Central Indiana, average quality land values are slightly higher in West Central Indiana. Land value per bushel of estimated long-term corn yield (land value divided by bushels) is the highest in the Central and West Central regions, ranging from $26.39 to $28.24 per bushel. This was followed by the Northeast, ranging from $25.36 to $28.06 per bushel and the North, ranging from $24.57 to $26.51. The Southwest and Southeast had the lowest land values per bushel and ranged from $21.02 to $25.38 per bushel.
Area Cash Rents
All areas of the state reported an increase in cash rent for all land qualities (Table 2). The strongest percentage increases were in the North and Northeast, ranging in value from 12.3% to 14.9%. This was followed by Central and West Central Indiana with changes of 7.6% to 10.9%. The changes in the Southwest and Southeast ranged from 3.2% to 8.7%.
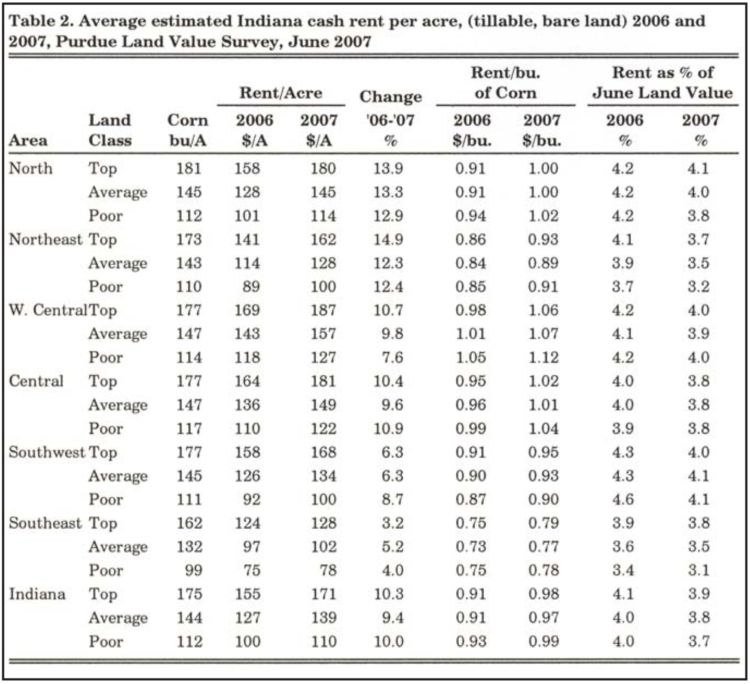
Table 2. Average estimated Indiana cash rent per acre, (tillable, bare land) 2006 and 2007, Purdue Land Values Survey, June 2007
Cash rents are the highest in the West Central region, followed by the Central region. Cash rent per bushel in West Central Indiana ranges in value from $1.06 to $1.12 per bushel. In the Central region, these values ranged from. $1.01 to $1.04 per bushel. Per bushel rents in these two regions are the highest in the state. Cash rents in the North are similar to those in Central and West Central Indiana. Cash rents in the North range from $114 to $180 per acre and $1.00 to $1.02 per bushel. The per bushel rent in the Northeast and Southwest ranged from $0.89 to $0.95. The lowest per bushel cash rents continue to be in the Southeast, ranging from $0.77 to $0.79 per bushel.
Rural Home Sites
Respondents were asked to estimate the value of rural home sites with no accessible gas line or city utilities and located on a black top or well-maintained gravel road. The median value for five-acre home sites ranged from $7,000 to $10,000 per acre (Table 3). Estimated per acre median values of the larger tracts (10 acres) ranged from $6,000 to $9,000 per acre.
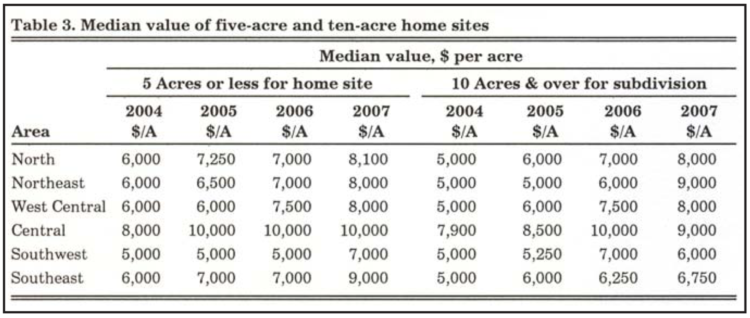
Table 3. Median value of five-acre and ten-acre home sites
Farmland Supply & Demand
To assess the supply of land on the market, respondents were asked to provide their opinion of the amount of farmland on the market now compared to a year earlier. The respondents indicated either more, the same, or less land was on the market than one year ago. Only 15.9% of the 2007 respondents indicated more land was on the market now compared to year-ago levels (Figure 2). The remaining 84.1% of the respondents indicated the amount of land on the market at the current time was the same or less than a year ago. Compared to 2005 and 2006, more respondents indicated that there was less land on the market and fewer indicated that there was the same amount or more land on the market.
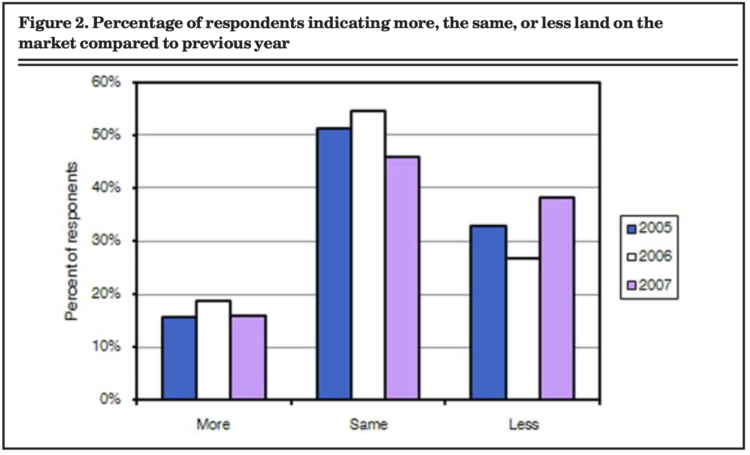
Figure 2. Percentage of respondents indicating more, the same, or less land on the market compared to previous year
Respondents were also asked to provide their perceptions about the changing sources of demand for farmland. One of the sources of demand for farmland is farmers. Respondents indicated if the demand from farmers had increased, remained the same or decreased when compared to a year earlier. The number of respondents indicating an increased demand from farmers had declined steadily since 2004, when 61.5% of the respondents indicated increased interest on the part of farmers. Last year just over 40% of the respondents indicated an increase in demand from farmers. This year, a total of 75.3% of the respondents indicated increased farmer demand (Figure 3). Only 21.7% of the respondents indicated that farmer demand remained the same. Respondents indicating a decline in farmer demand decreased to 3.0%.
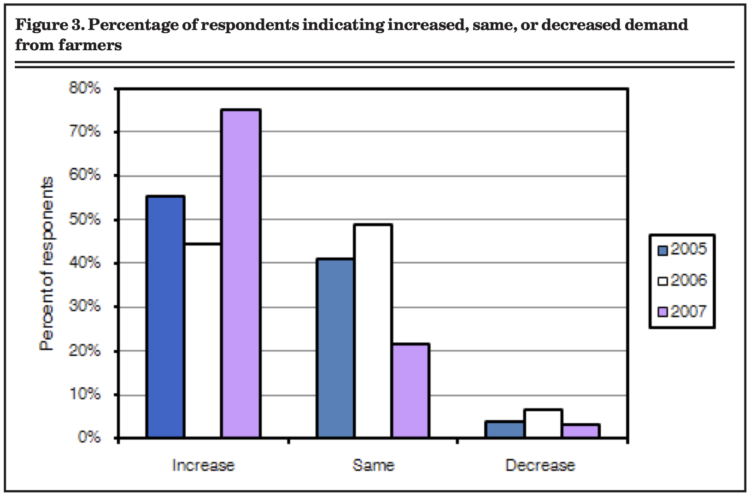
Figure 3. Percentage of respondents indicating increased, same, or decreased demand from farmers
Demand for rural homes is another use of farmland. The demand for rural homes continues to be strong. Approximately 56% of the respondents indicated that there was increased demand for rural residences. While the number of respondents indicating increased demand remains high, the number reporting increased demand has steadily fallen over the last three years (Figure 4). For the same time period, the number of respondents indicating that demand for rural residences is the same or decreasing has risen.
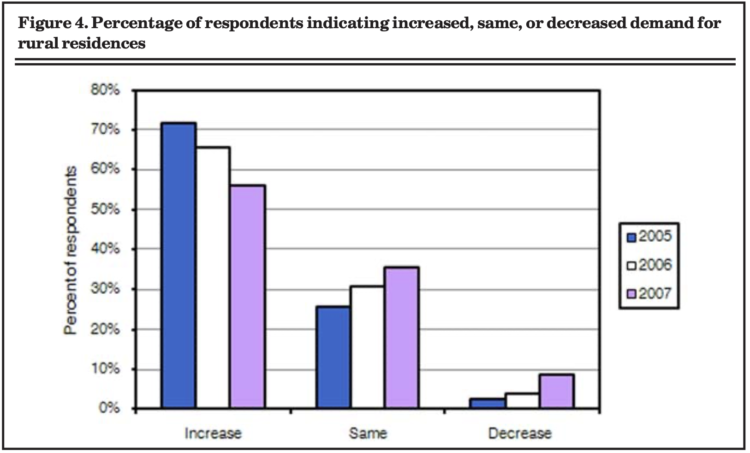
Figure 4. Percentage of respondents indicating increased, same, or decreased demand for rural residences
Nonfarm investors are another group that contributes to the demand for farmland. Respondents were asked to indicate if they perceived an increase, the same, or a decrease in demand from individual investors as well as organized investment efforts such as pension funds. Over the past few years, stock market returns have been improving. In addition, higher interest rates have provided increased competition for investor’s dollars. These changes may be reducing the demand for farmland from these sources. How- ever, in the 2007 survey, 48% of the respondents indicated an increase in demand from individual investors (Figure 5). A similar pattern occurred in demand for farmland from pension funds. In 2007, 27.5 % of the respondents indicated an increased demand from pension funds. This was an increase from 16.6% of the respondents in 2006.
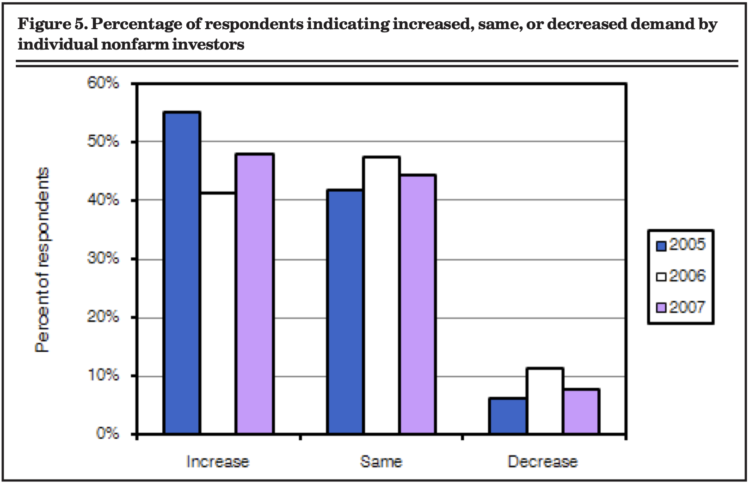
Figure 5. Percentage of respondents indicating increased, same, or decreased demand by individual nonfarm investors
Expected Grain Prices, Interest Rates, & Inflation
Making a farmland purchase is a long term commitment. As a result, expectations regarding crop prices over the next few years can have a strong influence on farmland values. Given the developments with ethanol and other biofuels, it is likely that these expectations have sharply changed. In order to gain insight into crop price expectations, respondents were asked to estimate the annual average on-farm price of corn and soybeans for the period 2007 to 2011. As expected, this year saw a large increase in the five-year average price of corn and soybeans. On average, survey participants expect corn prices to be $3.43 per bushel and soybean prices to be $7.31 per bushel, estimates that are well above the 15-year average (Table 4).
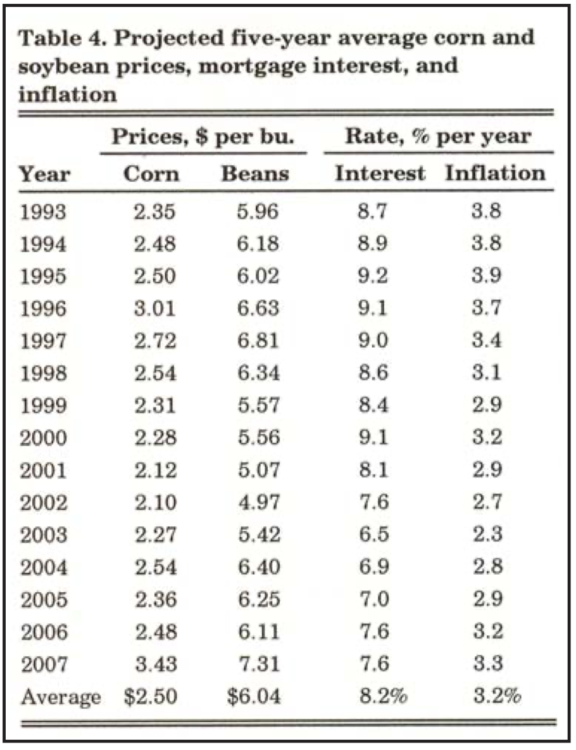
Table 4. Projected five-year average corn and soybean prices, mortgage interest, and inflation
Long-term interest rates have important implications for real estate markets. Increases in long-term interest rates have been forecast for a number of years. While long-term interest rates have increased from their lows of a few years ago, they continue to be modest. Survey respondents don’t seem to be expecting much change in long-term interest rates. The average estimate of 7.6% in 2007 was the same as the average in 2006. This is well below the long-term interest rate expectations in the 1990s, a period that saw a steady upward climb in farmland values.
There was very little change in inflation expectations. On average, survey respondents estimate annual inflation over the next five years will be 3.3%, just 0.1% above the average estimate in 2006.
Market Influences
To obtain a more complete picture of the strength that various influences exert on farmland values, survey respondents were asked to assess the influence of 11 different items on farmland values.
These items included:
- Current net farm income
- Expected growth in returns to land
- Crop price level and outlook
- Livestock price level and outlook
- Current & expected interest rates
- Returns on competing investments
- Outlook for U.S. agricultural export sales
- U.S. inflation/deflation rate
- Current inventory of land for sale
- Current cash liquidity of buyers 11. Current U.S. agricultural policy
Respondents were asked to use a scale from -5 to +5 to indicate the effect of each item on farmland values. A negative influence would be given a value from -1 to -5, with a -5 representing the strongest negative influence. A positive influence was indicated by assigning a value between 1 and 5 to the item, with 5 representing the strongest. An average for each item was calculated.
In order to provide a perspective on the changes in these influences, data from 2005, 2006 and 2007 are presented in Figure 6. The horizontal axis of the chart indicates the item in the above list. For this three year period, most of the items listed had positive influences. In 2005, all of the items had a positive average. In 2006, only current and expected interest rates were negative. In 2007, livestock prices and outlook was slightly negative. The major positive influences in 2007 included current net farm income, expected growth rate in returns, and crop prices and outlook. This is a sharp contrast to 2006 when current net farm income and crop prices and outlook provided only a small positive influence. This change indicates how quickly markets and expectations about markets can change. Last year we made the following observation “Over this three year period the most notable changes in market influence are the reduction in the positive influence of current net farm income, crop prices, ….” This year net farm income and crop prices are the dominant positive forces.
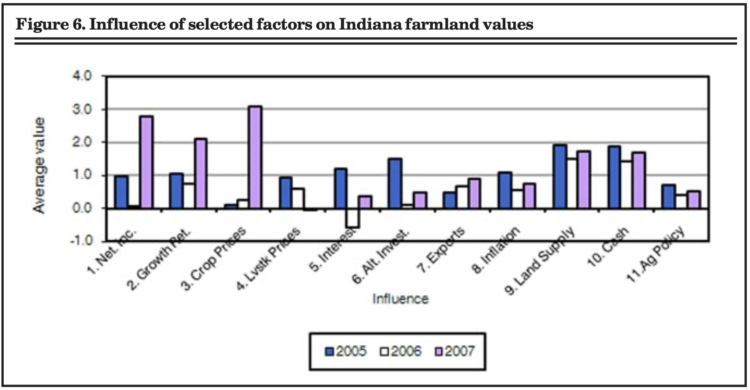
Figure 6. Influence of selected factors on Indiana farmland values
The current inventory of land for sale and the cash liquidity of buyers are also viewed as important contributors to the strength of the farmland market by the 2007 respondents. The average value of these two influences has been fairly consistent during this three year period. In 2005 and 2006, these two items were the highest weighted influences. If the income and crop price picture had not changed in such a dramatic fashion since the last survey, these two items would again have the largest average weight. As in the past, the liquidity of buyers continues to be enhanced through the use of 1031 or tax free exchanges. Section 1031 of the IRS regulations provides a process by which sellers of real estate can reinvest the revenue back into real estate without paying capital gains tax. This is often advantageous to individuals selling farmland for development.
Expected Future Land Values
The sudden increase in crop prices has created increased uncertainty. As an industry, markets are working through how the new margin from crop production will be shared among market participants. Expectations about corn and soybean prices, interest rates, and the rate inflation expressed by survey participants indicate that there may be future increases in farmland values. This is also indicated by survey respondents when asked to project land values for December 2007 and in five years.
On a state-wide basis, Table 1 indicates that for the six-month period from June to December 2007, survey respondents expect farmland values to increase 2.4% to 2.9%. Generally survey respondents in the North, Northeast, West Central, and Central regions expect increases larger than the state-wide average. The strongest increase is expected in the Central region with increases ranging from 2.9% to 4.4%. The increases in the Southwest and Southeast regions are expected to be less than the state average, ranging from zero to 1.7%. If these expectations are used to project an annual increase in land values, they indicate a slowing in the rate of increase. This is expected given the large increase this year.
Respondents were also asked to project farmland values five years from now. Ninety-two percent of the respondents expect farmland values to be higher, no one expects farmland values to be the same, and 8% expect farmland values to be lower. For those expecting land values to increase, the average expected increase for the period was 13.2%. For those expecting land values to decline over the next five years, the average decline was 10.2%. Combining all responses provided an expected total increase in farmland values over five years of 11.4%. For the five-year period from 2001 to 2006, average quality Indiana farmland increased in value about 40%. If 2007 is included, there was almost a 55% increase in average quality farmland for the five-year period from 2002-2007.
Pasture Rent, Irrigated Farmland, & Grain Storage Rent
Occasionally we included extra questions in our survey to obtain information about a particular topic. This year, we asked about pasture rent, the value and cash rent of irrigated farmland, and the rental of on-farm grain storage.
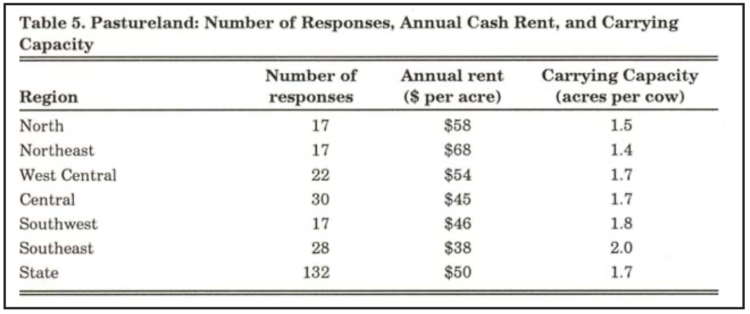
Table 5. Pastureland Number of Responses, Annual Cash Rent, and Carrying Capacity
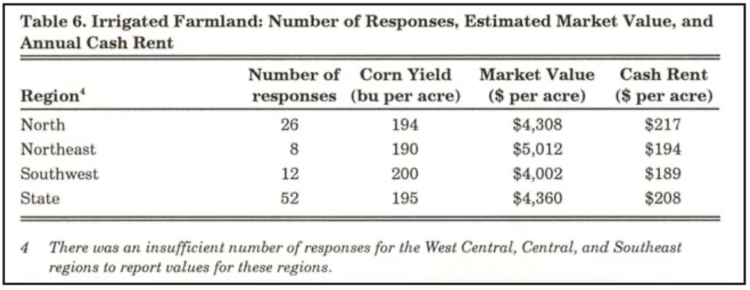
Table 6. Irrigated Farmland: Number of Responses, Estimated Market Value, and Annual Cash Rent
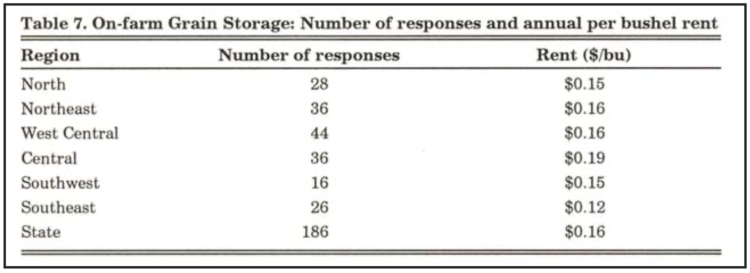
Table 7. On-farm Grain Storage: Number of responses and annual per bushel rent
Final Comment
The Purdue Farmland Value and Cash Rent Survey indicates that over the past year Indiana farmland values and cash rents have made a significant jump upward. There is a limited supply of land for sale or rent. There is a strong demand from farmers, investors, and people desiring to live in the country. The liquidity of buyers appears strong. Favorable commodity prices, interest rates, and inflation rates are anticipated by survey respondents. In addition, most of the respondents expect land values to increase over the next five years.
These items indicate that farm- land values are likely to continue to move higher. Will these factors result in another sharp increase in farmland values next year? What events could dim the bright outlook for continued strong increases in farmland values?
- One possibility is an increase in production costs. Input suppliers may look at this period of the larger crop production margins as a time to increase prices.
- Another possibility would be an increase in long-term interest rates. Such an increase would influence the market capitalization rate**. If the capitalization rate were to increase from 3.8% to 4.8%, the capitalized value of the state-wide rent for average quality land in 2007 ($139 per acre) would be $2,896 per acre. This is $762 per acre less value than when using a capitalization rate of 3.8%.
- Market participants may begin to view ownership of farmland as more risky than in the past. Agriculture has received important income support from commodity programs. Much of this support has been capitalized into farmland values. Currently corn, soybean, and wheat prices are well above the target prices established by this legislation. If the new Farm Bill does not provide the same level of down-side price protection as historical programs, the market may require a larger risk premium. This would again increase the capitalization rate and lower the capitalized value of current income.
- A sharp decline in crop prices. We have seen how quickly prices can rise. It is important to remember that they can decline as fast or faster. Farmers have responded quickly to the market signal that more corn needs to be produced. Increased supplies likely mean lower prices.
- A decline in oil prices and/or a change in energy policies designed to encourage biofuel production. Efforts to reduced U. S. dependence on imported oil through the development of biofuels have linked the agriculture sector with the energy sector. High oil prices encourage the continued increase in biofuel production and the demand for corn and soybeans. Legislation has also provided incentives for encouraging the expansion of biofuel production. A reduction in either oil prices or the federal incentive would slow the growth in corn and soybean use as a source of biofuels.
- Continued weakness in the housing market. The slowing of the housing market means less demand from developers and thus fewer tax free exchanges influencing the farmland market. Research indicates that farmland values are influenced by both agricultural returns and the non-farm factors. There is debate about the exact size of the non-farm influence, but it is important to recognize that in some areas of Indiana the non-farm influence has been a major contributor to rising farmland values. As one considers what might happen to future farmland values, it is important to account for non-farm influences.
- Finally, there could be some combination of the above items or some item that is not on the list.
It is difficult to know which events might occur. However, before undertaking a farmland purchase, preparing a list of what could go right and what could go wrong and developing subjective probabilities of their likelihood is an important part of sound business management.
* The median is the middle observation in data that have been arranged in ascending or descending numerical order.
** Income capitalization is a common method used to estimate the value
of farmland. This approach to estimating farmland value divides an estimate of annual income by the capitalization rate. If estimated income (rent) is $139 per acre and the capitalization rate (rent ÷ value) is 3.8%, this provides an estimated value of $3,658 per acre.
Purdue Land Value and Cash Rent Survey
The Purdue Land Value and Cash Rent Survey is conducted each June. The survey was made possible through the cooperation of numerous professionals that are knowledgeable of Indiana’s farmland market. These professionals include farm managers, appraisers, land brokers, agricultural loan officers, Purdue Extension educators, farmers, and persons representing the Farm Credit System, the Farm Service Agency (FSA) county offices, and insurance companies. Their daily work requires that they stay well informed about land values and cash rents in Indiana.
These professionals are asked to provide an estimate of the market value for poor, average, and top quality farmland in December 2006, June 2007, and the expected value for December 2007. They are also asked to provide an estimate of the current cash rent for each land quality. To assess the productivity of the land, respondents provide an estimate of long term corn yields. Respondents are also asked to provide a market value estimate for land transitioning out of agriculture.
Responses from 313 professionals are contained in this year’s survey representing all but three Indiana counties. There were 51 responses from the North region, 57 responses from the Northeast region, 72 responses from the W. Central region, 64 responses from the Central region, 35 responses from the Southwest region, and 34 responses from the Southeast region. Figure 1 illustrates the counties in each region.
Appraisers accounted for 14% of the responses, farm loan professionals represented 59% of the responses, farm managers or farm operators provided 13% of the responses, and other professionals provided 14% of the responses. The data reported here provide general guidelines regarding farmland values and cash rent. To obtain a more precise value for an individual tract, contact a professional in your area that has a good understanding of the local situation.
We express appreciation to Marsha Slopsema of the Department of Agricultural Economics for her help in conducting the survey.
![]()
![]()
![]()
![]()
![]()
