2005 Indiana Farmland Values & Cash Rents Jump Upward
August 1, 2005
PAER-2005-00
Craig L. Dobbins, Professor; Kim Cook, Research Assistant
![]()
![]()
![]()
![]()
![]()
Statewide Land Values
The June 2005 Purdue Land Values Survey found that on a state-wide basis bare Indiana cropland ranged in value from $2,367 per acre for poor land, to $3,556 per acre for top land (Table 1). Average bare Indiana cropland had an estimated value of $2,945 per acre. For the 12-month period ending in June 2005, this was an increase of 11.1%, 9.4% and 8.5%, respec- tively for poor, average, and top land. Increases this large have not occurred since 1996-1997 when the Purdue Land Values Survey reported a state wide increase of 12% to 15%.
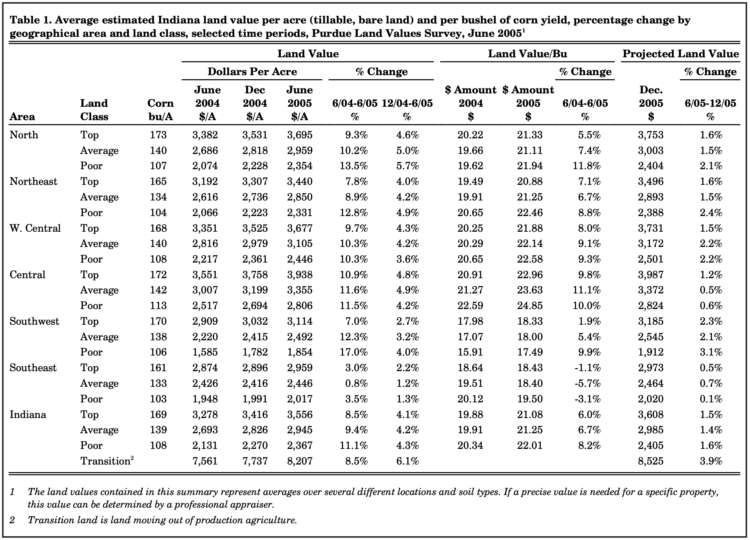
Table 1. Average estimated Indiana land value per acre (tillable, bare land) and per bushel of corn yield, percentage change by geographical area and land class, selected time periods, Purdue Land Values Survey, June 2005
Part of the difference in land values reflects productivity differences. As a measure of productivity, survey respondents provide an estimate of long-term corn yields. The average reported yield was 108, 139, and 169 bushels per acre, respectively for poor, average, and top land. The value per bushel for different land qualities was very similar, ranging from $21.08 to $22.01 per bushel.
The average value of transi- tional land, land moving out of agriculture, increased 8.5% this year. The average value of transitional land in June 2005 was $8,207 per acre. Due to the wide variation in estimates for transitional land, the median value* may give a more mean- ingful picture than the arith- metic average. The median value of transitional land in June 2005 was $7,000 per acre.
Statewide Rents
Cash rents increased statewide $3 to $4 per acre (Table 2), continuing the steady increase of the past several years. The estimated cash rent was $154 per acre on top land, $126 per acre on average land, and $99 per acre on poor land. This was an increase in rental rates of 3.1% for poor land, 3.3% for average land, and 2.7% for top land. State wide, rent per bushel of estimated corn yield ranged from $0.91 to $0.92 per bushel.
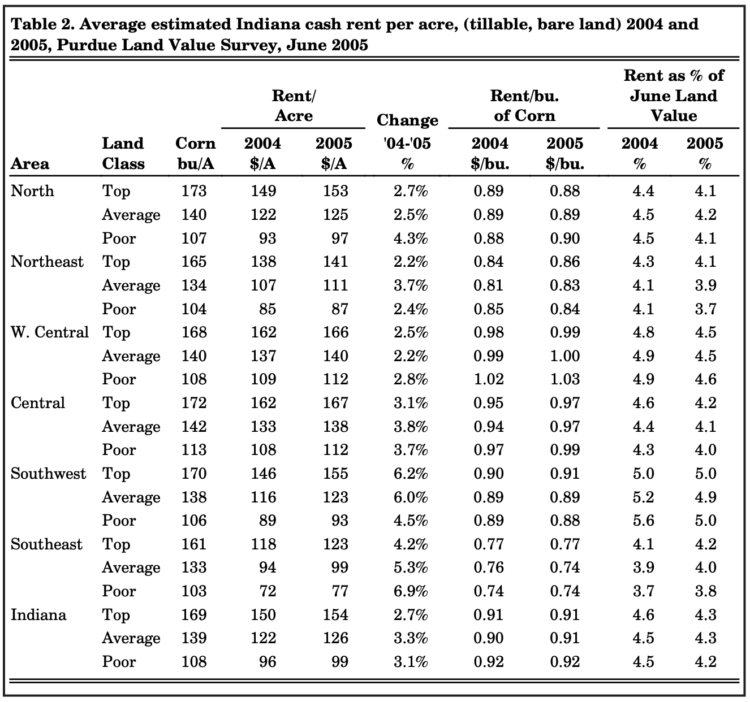
Table 2. Average estimated Indiana cash rent per acre, (tillable, bare land) 2004 and 2005, Purdue Land Value Survey, June 2005
Cash rent as a percentage of value continued to decline. For top and average farmland, cash rent as a percentage of farmland value was 4.3%. For poor farmland, cash rent as a percentage of farmland value was 4.2%. These values are the lowest reported in the 31 year history of the Purdue Land Value Survey.
Area Land Values
Survey responses were orga- nized into six geographic regions of Indiana (Figure 1). In past years, there have been definite geographic differences in land value changes. This year there is only one notable difference the change in land values in the Southeast was not as large as in other areas of the state (Table 1). The highest valued land continues to be in the Central region followed by the West Central, North, Northeast, Southwest, and Southeast.
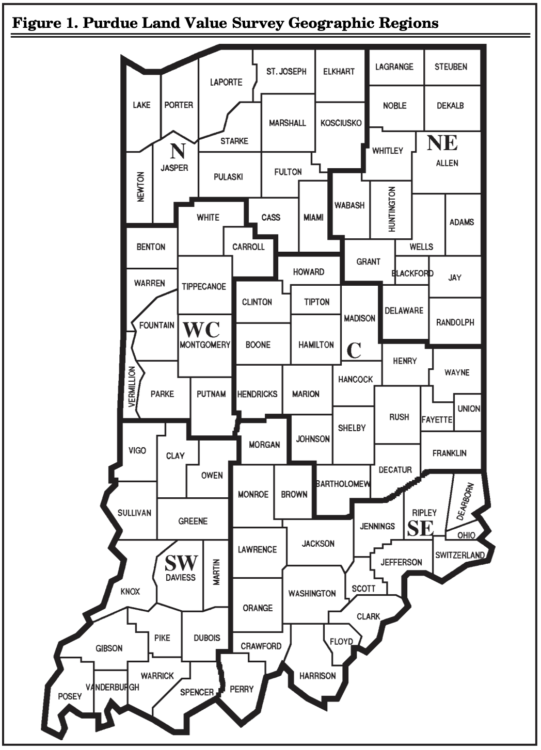
Figure 1. Purdue Land Value Survey Geographical Regions
The change in land values for each class of land is also reported in Table 1. The West Central and Central regions of the state had the most similar increases in value for the differ- ent land classes. In the West Central region, the increase in land value across the three land qualities ranged from 9.7% to 10.3%. In the Central region the increase in land values ranged from 10.9% to 11.6%. There were double-digit increases in land values in the North, Northeast, and Southwest, but these regions had a greater range in land value increase across land quality classes.
Land value per bushel of estimated long-term corn yield (land value divided by bushels) is the highest in the Central region, ranging from $22.96 to $24.85 per bushel. This was followed by the West Central, North, and Northeast with values ranging from $20.88 to $22.58. The Southwest and Southeast had the lowest land value per bushel, ranging from $17.49 to $19.50 per bushel.
Respondents were asked to estimate the value of rural home sites with no accessible gas line or city utilities and located on a black top or well-maintained gravel road. The median value for five acre home sites ranged from $5,000 to $10,000 per acre (Table 3). Estimated per acre median values of the larger tracts (10 acres) ranged from $5,250 to $8,500 per acre.
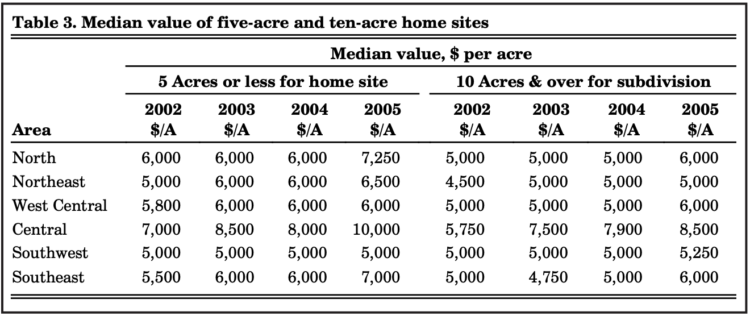
Table 3. Median value five-acre and ten-acre home sites
Area Cash Rents
All areas of the state reported an increase in cash rent for all land qualities (Table 2). The largest percentage increases in cash rent occurred in the Southern regions of the state.
Cash rents are the highest in the Central and West Central regions. Across all three land qualities, cash rents in these two regions were very similar. When looking at the cash rent per bushel for the West Central and Central regions, these values ranged from $0.97 to $1.03 per bushel. These per bushel rents are the highest in the state. The next highest per-bushel rent was in the North and Southwest, ranging from $0.88 to $0.91. Per bushel rents in the Northeast ranged from $0.84 to $0.86. The lowest per bushel cash rents were $0.74 to $0.77, reported for the Southeast.
Farmland Supply & Demand
The supply of land on the market and the number of interested buyers and their expectations has an important influence on farmland prices. To assess the supply of land
on the market, respondents were asked to provide their opinion of the amount of farm- land on the market now com- pared to a year earlier. The respondents indicated either more, the same, or less. Only 16% of the 2005 respondents indicated more land was on the market now compared to year-ago levels (Figure 2). The remaining 84% of the respondents indicated the amount of land on the market at the current time was the same or less than a year ago. These results indicate the quantity of land for sale remains limited.
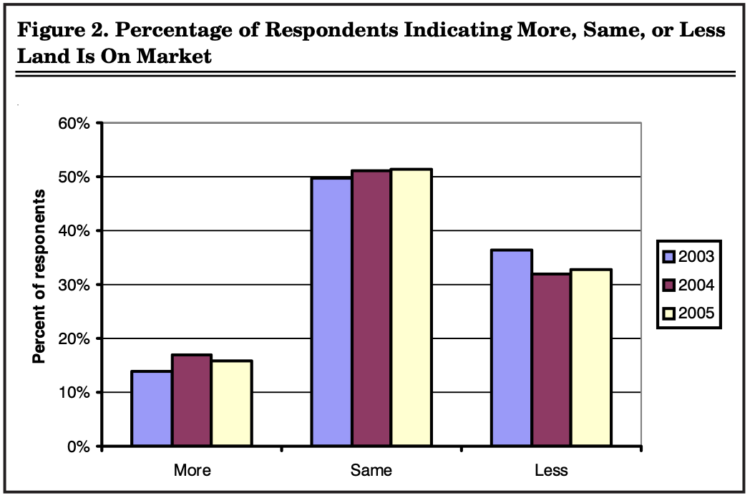
Figure 2. Percentage of Respondents Indicating More, Same, or Less Land Is On Market
Respondents were also asked to indicate if interest in a farmland purchase by farmers, rural residents, or non-farm investors had increased, decreased, or remained the same compared to a year earlier. A total of 55% of the respondents indicated increased farmer interest (Figure 3). Forty-one percent of the respondents indicted that farmer interest remained the same.
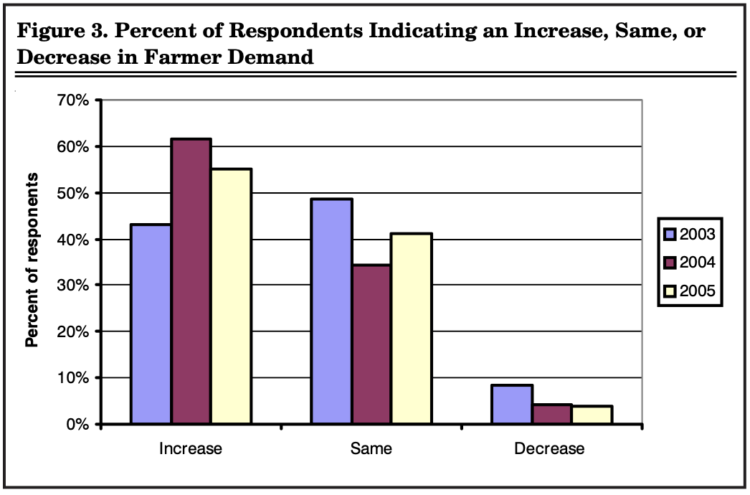
Figure 3. Percent of Respondents Indicating an Increase, Same, or Decrease in Farmer Demand
The demand for land for rural residents continues to be strong. Seventy-two percent of the respondents indicated an increase in demand for rural residences. Twenty-six percent indicated that demand for rural residences remained the same. Less than three percent of the respondents indicated a decline in the demand for rural resi- dences. These responses are similar to those of past years.
The stock market has shown some recovery from its steep decline in 2002, but long-term interest rates continue to be low. Demand for farmland from nonfarm investors seeking good investment opportunities also appears to be strong with 52% of the respondents indicating increased interest compared to lastyear(Figure 4),aslightly larger percentage in this cate- gory than last year. This is the third year that 50% or more of the respondents have indicated increased interest from nonfarm investors. Slightly more than 6% of the respondents indicated a decline in the number of inter- ested nonfarm investors.
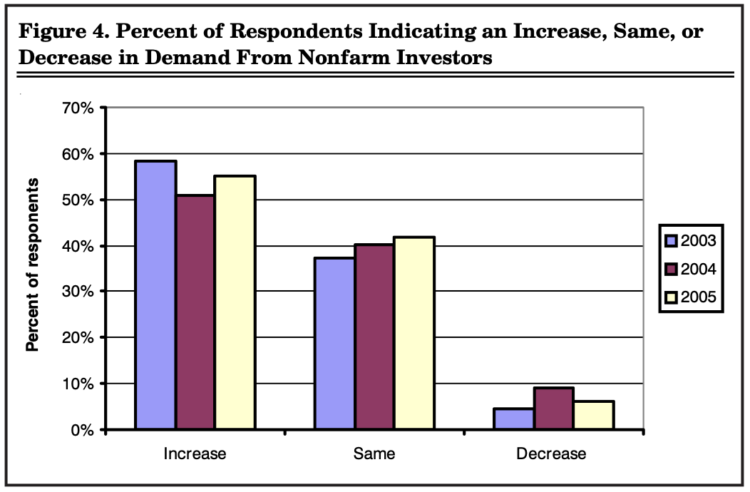
Figure 4. Percent of Respondents Indicating an Increase, Same, or Decrease in Demand From Nonfarm Investors
Expectations about future grain prices, interest rates, inflation, and changes in farmland values
Making a farmland purchase is a long term commitment. As a result, expectations regarding crop prices over the next few years can have a strong influ- ence on farmland values. In order to gain insight into price expectations, respondents were asked to estimate the annual average on-farm price of corn and soybeans for the period 2005 to 2009.
This year saw a decrease in the expected five-year average price of corn and soybeans (Table 4). Average corn price expectation for the next five years decreased $0.18 per bushel to $2.36. The average price for soybeans decreased $0.15 to $6.25.
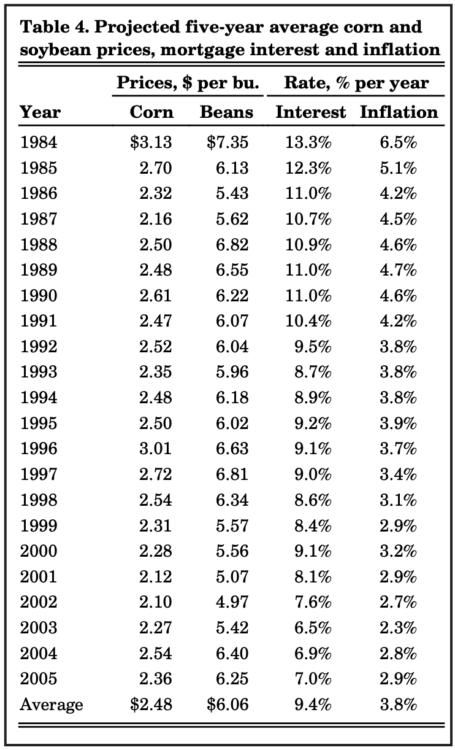
Table 4. Projected five-year average corn and soybean prices, mortgage interest and inflation
Changes in long-term interest rates have been a topic of discussion for a number of years. Interest rate watchers have been predicting that long-term interest rates are going to increase. At the beginning of the year, there was some upward movement but since then they have fallen back. Last year the average expected five-year interest rate increased by 0.4%. This year this rate changed only 0.1% to 7.0%, a rate well below the series average of 9.4%. Survey respon- dents are also expecting the inflation rate over the next five years to be moderate at 2.9%.
Another important expecta- tion that influences current farmland price is the expected future change in farmland values. Table 1 indicates that for the six-month period from June to December 2005, survey respondents expect values to continue to increase. On a state wide basis this increase is expected to range from 1.4% to 1.6%, a fairly modest increase given this past year.
Respondents were also asked to project farmland values five years from now. Seventy-four percent of the respondents expect farmland values to be higher, 12% of the respondents expect farmland values to be the same, and 14% expect farmland values to be lower.
For those expecting land values to increase, the average expected increase was 10.4%. For those expecting land values to decline over the next five years, the average decline was 11%. Combining all estimated increase, decrease, and no change responses provided an expected total increase in farmland values over five years of 6.8%, a very modest increase given recent changes.
Pasture & Irrigated Farmland
Occasionally we include extra questions in our survey to obtain information about a particular topic. This year, we asked about pasture rent and the value and cash rent of irrigated farmland.
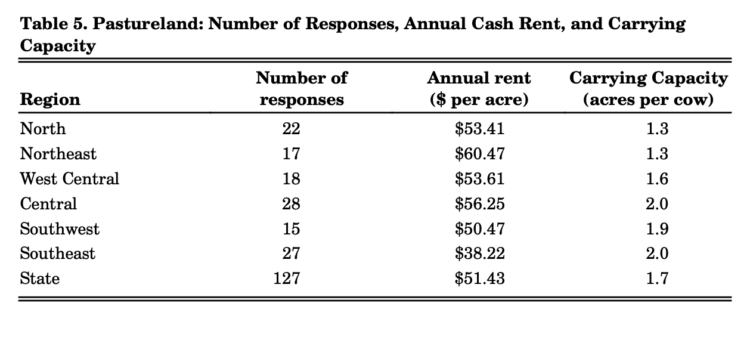
Table 5. Pastureland: Number of Responses, Annual Cash Rent, and Carrying Capacity
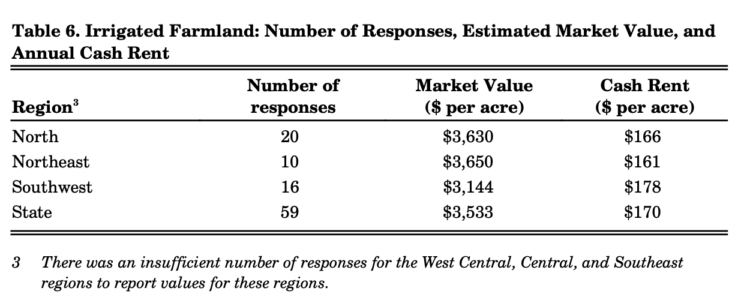
Table 6. Irrigated Farmland: Number of Responses, Estimated Market Value, and Annual Cash Rent
Market Influences
To obtain a more comprehensive assessment of the relative strength that various influences exert on farmland values, survey respondents were asked to assess the influence of 11 different items on farmland values. These items included:
1. Current net farm income,
2. Expected growth in returns,
3. Cropprices&outlook,
4. Livestockprices&outlook,
5. Current & expected interest rates,
6. Returns on competing investments,
7. U.S.agriculturalexport sales,
8. U.S. inflation/deflation rate,
9. Current inventory of land for sale,
10. Current cash liquidity of buyers, and
11. Current U.S. agricultural policy.
Respondents were asked to use a scale from -5 to +5 to indicate the effect of each on farmland values. If the item had a major negative influence, it would be given a -5. If the item had a small negative influence, it would be given a -1. A positive influence was indicated by assigning a positive weight between 1 and 5 to the item. An average for each item was calculated.
In order to provide a perspec- tive on the changes in these influences, both 2004 and 2005 data are presented in Figure 5. The labels on the horizontal axis of the chart indicate the influ- ence in the above list.
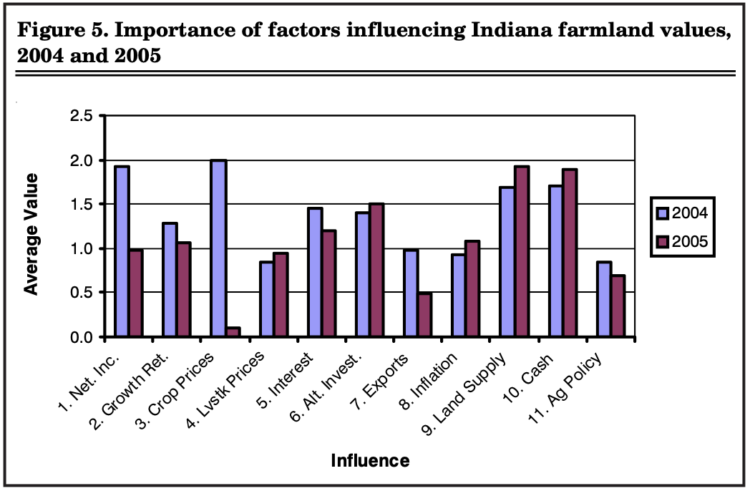
Figure 5. Importance of factors influencing Indiana farmland values, 2004 and 2005
In 2005, all factors were positive. This is the second year that all factors have been posi- tive influences. The factors given the most positive influence were the current inventory of land for sale (9) and the current cash liquidity of buyers (10). These were both important influences in 2004. The availability of farmland for sale was discussed previously. The liquidity of buyers continues
to be enhanced through the use of the Internal Revenue Code Section 1031- tax-free exchanges. Section 1031 in the federal tax law provides a process by which sellers (or traders) of real estate can reinvest the revenue from current holdings from real estate back into a “like-kind” real estate investment without paying capital gains tax. The tax deferment provided by Section 1031 is often advantageous to individuals selling farmland for development. Because there is a time limit allowed for reinvestment under Section 1031, this limit may place upward pressure on prices of land available for sale.
The most notable change in influence is the reduction in the positive influence of current farm income, crop and livestock prices, and the outlook regarding changes in income and prices. While the influence of crop prices (3) was still slightly positive, it was greatly reduced from last year. The influence of current farm income was also much less positive. The reduction in these influences may be part of what lies behind the respondents? expected modest increase in future farmland values.
Summary and Outlook
Over the past year, Indiana farmland values have moved strongly higher. The limited supply of land for sale combined with strong demand for farm expansion, country residences and nonfarm development, and continued interest from nonfarm investors in farmland purchases provide strength to Indiana?s farmland market. In the past two years, Indiana farmland values have surged upward by 17.2% to 21.4%. After such an increase, a moder- ating or cooling off period might be expected.
At the current time, there is a positive tone to the farmland market but not as positive as last year. This makes it more important to carefully watch for factors that could derail the upward trend in farmland prices. At this time, mid-July, hot dry weather is driving speculation about crop yields.
There is a growing nervousness about how this year might turn out for Indiana farmers. During the past couple years, per acre crop production costs have increased sharply. Reduced yields will lead to much higher per bushel costs. While a smaller than expected corn and soybean crop will result in higher than expected prices, continued dry weather could mean substan- tially lower income for some Indiana farmers. While farm income was expected to decline from its record level of last year, a sharply lower income is likely to have a dampening influence on the farmland market.
Another important factor to watch is the rate of inflation and long-term interest rates. Short-term interest rates have increased in response to Federal Reserve adjustments. This has raised the interest rates that farmers are paying on produc- tion loans. However the antici- pated increase in long-term interest rates is yet to material- ize. A sharp rise in long-term interest rates would slow development demand, provide more attractive alternative investments, as well as increase the cost of borrowed money.
Still another important factor to watch is the debate about the next farm bill and the agricul- ture budget. In an effort to reduce the federal budget deficit, the federal agriculture budget has been reduced. To date, this has not resulted in reduced funding for commodity price support programs. The debate about the next farm bill has begun. It is much too early to tell what might be contained in the next farm bill, but any reduction in funding of tradi- tional commodity programs is likely to have a negative impact on farmland values.
Purdue Land Value and Cash Rent Survey
The Purdue Land Value and Cash Rent Survey is conducted each June. The survey was made possible through the cooperation of numerous professionals that are knowledgeable of Indiana?s farmland market. These professionals include farm managers, appraisers, land brokers, bankers, Purdue Extension educators, farmers, and persons representing the Farm Credit System, the Farm Service Agency (FSA) county offices, and insurance compa- nies. Their daily work requires that they stay well informed about land values and cash rents in Indiana.
These professionals are asked to provide an estimate of the market value for poor, average, and top quality farmland in December 2004, June 2005, and the expected value for December 2005. They are also asked to provide an estimate of the current cash rent for each land quality. To assess the productivity of the land, respondents provide an estimate of long term corn yields. Respondents are also asked to provide a market value estimate for land transitioning out of agriculture.
Responses from 332 professionals are contained in this year?s survey representing all but six Indiana counties. There were 62 responses from the North region, 59 responses from the Northeast region, 68 responses from the W. Central region, 71 responses from the Central region, 41 responses from the Southwest region, and 31 responses from the Southeast region. Figure 1 illustrates the counties in each region.
Appraisers accounted for 14% of the responses, farm loan professionals represented 52% of the responses, farm managers
or farm operators provided 11% of the responses, and other profes- sionals provided 7% of the responses.
The data reported here provide general guidelines regarding farmland values and cash rent. To obtain a more precise value for an individual tract, contact a professional rural appraiser or other professionals in your area that have a good understanding of the local situation.
We express appreciation to Carolyn Hunst of the Department of Agricultural Economics for her help in conducting the survey.
![]()
![]()
![]()
![]()
![]()
