2002 Indiana Farmland Values & Cash Rents Move Higher
August 1, 2002
PAER-2002-7
Craig L. Dobbins, Professor and Kim Cook, Research Associate
![]()
![]()
![]()
![]()
![]()
The 2002 Purdue Land Values Survey indicates that the value of average bare Indiana cropland was $2,382 per acre in June 2002. This was $118 more than the value reported in June 2001, a 5.2% increase. Cash rents increased from 2001 to 2002 on average land by 2.7% to $116 per acre.
Statewide Land Values
For the six months ending in June 2002, the value of bare tillable land was reported to have increased 2.0% on top land, 2.1 percent on average land, and 2.5 percent on poor land
(Table 1). Forty-six percent of the survey respondents indicated that all classes of land (top, average, and poor) were the same or higher during the December 1, 2000 to June 1, 2001 period. Only 4% of the respondents indicated that some or all classes of land fell in value. Forty-two percent of the respondents indicated that land values remained unchanged during the December 1, 2001 to June 1, 2002 period.
The statewide 12-month increase in average land from June 2001 to June 2002 was 5.2% (Table 1). Top-quality land (162 bushel corn yield rating) was estimated to have increased by $90 per acre to $2,892 (Table 1). Average land (132 bushel corn yield rating) was valued at
$2,382, an increase of $118, while poor land (102 bushel corn yield rating) was estimated to be worth $1,869 per acre, an increase of $136.
The land value per bushel of corn yield rating also increased this year. For top-quality
land, the value per bushel of yield was $17.85, up by 1.0%. Average quality land value was $18.06 per bushel, while the poor-quality value was $18.25 per bushel (Table 1). The percentage increases were 3.0% on average land and 4.8% on poor land. These per-bushel figures are $0.18 higher than last year on top land, $0.53 higher on average land, and
$0.83 higher on poor land.
The average value of transition land (land that is moving out of agriculture) declined this year. This decline came after two years of increasing values. The average value of transitional land in June 2002 was $6,447, a decrease of 2.7% from June 2001. For the six-month period from June 2001 to December 2001 transitional land values declined even more. However, in the latter half of the year, December 2001 to June 2002, transitional land increased by 4.9% (Table 1). Due to the wide variation in estimates for transitional land, the median value may give a more meaningful picture than the arithmetic average. The median value of transitional land in June 2002 was $5,500 per acre, $250 more than reported in June 2001.
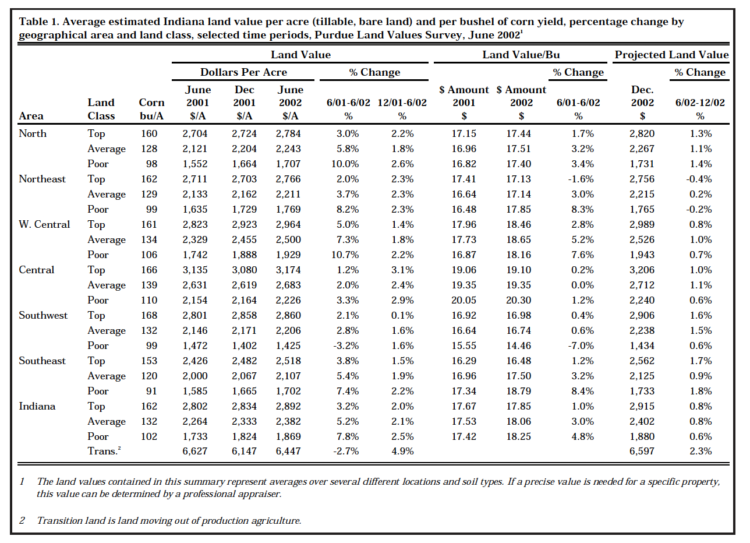
Table 1. Average estimated Indiana land value per acre (tillable, bare land) and per bushel of corn yield, percentage change by geographical area and land class, selected time periods, Purdue Land Values Survey, June 20021
Statewide Rents
Cash rents increased statewide from 2001 to 2002 by $2 to $4 per acre (Table 2). The estimated cash rent was $143 per acre on top land, $116 per acre on average land, and $91 per acre on poor land. Rent per bushel of estimated corn yield was $0.88 on top and average land and $0.89 on poor land. This was an increase for poor land, decrease for top land, and no change for average land. For 2002, cash rent as a percentage of value was 4.9% for all land classes. (Table 2).
Area Land Values
Changes in the value of farmland in the six different geographic areas of Indiana (Figure 1) for December 2001 to June 2002 ranged from a 0.1% increase for top land in South-west region to a 3.1% increase for top land in the Central region (Table 1). The Central region reported the strongest increases for this six-month period, ranging from 2.4 to 3.1%. The Northeast region also had increases larger than 2% for all land qualities.
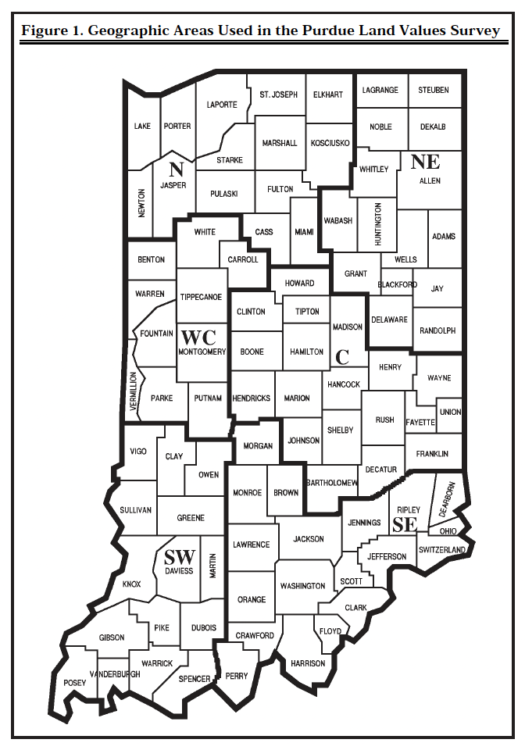
Figure 1. Geographic Areas Used in the Purdue Land Values Survey
For the year ending June 2002, the change in land values ranged from a decline of 3.2% for poor land in the Southwest region to an increase of 10.7% for poor land in the West Central region. The decline in the poor land value for the Southwest region was the only decline in farmland value reported for the year. The strongest increases for the year were in the West Central region, ranging from 5.0 to 10.7%. This was followed by the North region with increases ranging from 3.0 to 10.0%.
The highest valued top-quality land was in the Central area, $3,174 per acre. This region was followed by West Central ($2,964), Southwest ($2,860), North ($2,784), Northeast ($2,766), and Southeast ($2,518).
Land value per bushel of estimated average corn yield (land value divided by bushels) for top land in the Central region was $19.10. For the West Central, North, and Northeast regions, land value per bushel of corn yield on top land ranged from $17.13 to $18.46. In the Southeast and Southwest, land value per bushel of corn yield on top land ranged from $16.48 to $16.98
(Table 1). In the Northeast Central, and Southwest regions, per bushel value increased as land quality declined. For the North and West Central regions, the value per bushel increased when moving from top to average land, but then decreased in moving from average to poor land. In the Southwest region, the value per bushel declined as land quality decline.
Respondents were asked to estimate values of rural home sites with no accessible gas line or city utilities and located on a black top or well-maintained gravel road. The median value for five-acre home sites ranged from $5,000 to $7,000 per acre (Table 3). Estimated per acre median values of the larger tracts (10 acres) ranged from $4,500 to $5,750 per acre.
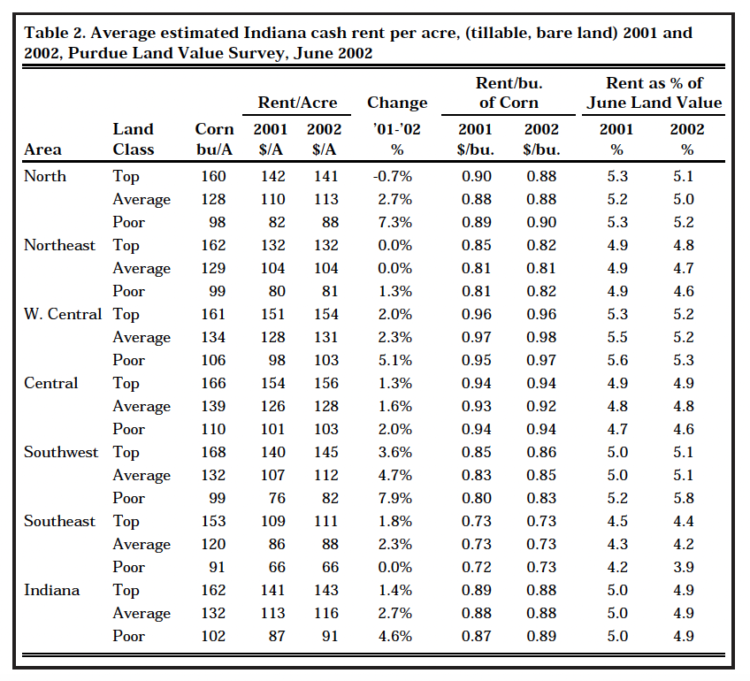
Table 2. Average estimated Indiana cash rent per acre, (tillable, bare land) 2001 and 2002, Purdue Land Value Survey, June 2002
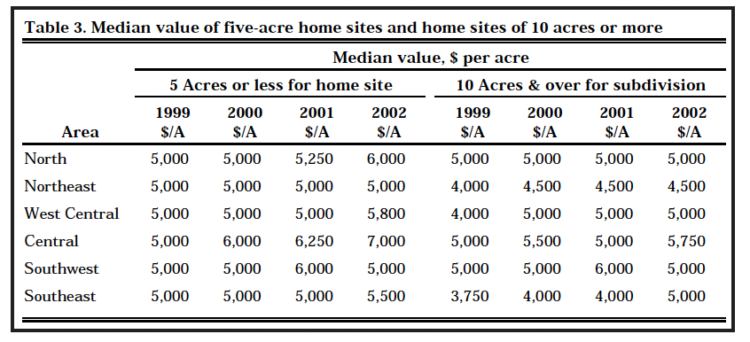
Table 3. Median value of five-acre home sites and home sites of 10 acres or more
Area Cash Rents
For the year, the West Central, Central, and Southwest reported increases in cash rent for all land classes. (Table 2). The strongest increases in cash rents occurred in the Southwest region, increasing 7.9% on poor land, 4.7% on average land, and 3.6% on top land. The West Central region reported the next strongest increases, ranging from a 2.0% increase on top land to a 5.1% increase on poor land. The Northeast and Southeast regions each had a mixture of increases and no change in cash rents. The only decrease in cash rent value was reported for top quality land in the North region.
Cash rents were again highest in the Central and West Central areas at $156 and $154 per acre, respectively, for top land. Cash rents per bushel for the West Central and Central regions ranged from $0.92 to $0.98. These were also the highest in the state. The next highest
per-bushel rent was in the North, ranging from $0.88 to $0.90 per bushel. Per bushel rents in the Northeast and Southwest ranged from $0.82 to $0.86. The lowest per bushel cash rents were $0.73 reported for the Southeast.
Land Market Activity
Several factors influence farmland prices. The supply of land on the market, the eagerness of buyers to make purchases, and expectations about grain prices, interest rates, and the rate of inflation are just a few examples. To assess the supply of land on the market, respondents were asked to indicate the amount of farmland on the market compared to a year earlier. The respondents indicated there was more, less, or the same amount of land compared to a year earlier. For the last three years the majority of the respondents have indicated that the amount of land on the market was the same as the previous year (Figure 2). Nearly 40% indicated there was less land on the market. Just over 10% indicate an increase. These observations indicate the supply of land for sale is limited. There are a few areas in which the quantity of land for sale increased, but there are more than three times as many areas where the quantity of land available for sale decreased.
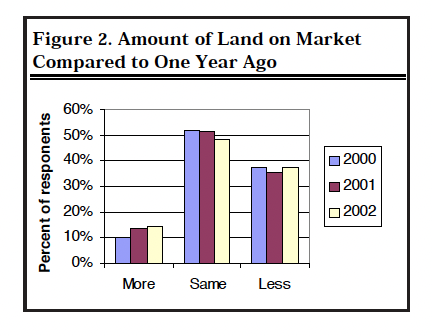
Figure 2. Amount of Land on Market Compared to One Year Ago
Respondents were also asked to provide their assessment regarding the number of farmland transfers during the previous six months compared to a year ago by indicating if the number of transfers had increased, decreased, or remained the same. Twenty-four percent of the respondents indicated an increase in the number of transfers, 27%indicated that the number of transfers declined, and 49% indicted that the number of transfers were the same.
Respondents were asked to provide their perceptions of changes in purchasers of farmland by indicating if purchases by farmers, rural residents, nonfarm investors, or pension funds had increased, decreased, for remained the same when compared to last year. Demand from farmers was said to have increased by 38% of the respondents, while 8% of the respondents indicated that farmer demand had declined. This was a change from 2001, when 22% of the respondents indicated an increase in farmer demand, while 19% indicated a decline.
The demand for rural residents continued to be strong, 78% of the respondents indicated an increase in demand for rural residences. This is about the same as last year. Two percent of the respondents indicated a decrease in demand for rural residences, while 20% indicated no change.
Nonfarm investors appear to be showing renewed interest in farm-land investments. Thirty-nine percent of the respondents indicated that demand from individual non-farm investors had increased, while 10% indicated that this source of demand had decreased. In 2001, 27% of the respondents indicated an increase from individual nonfarm investors, while 17% indicated a decrease in demand from individual nonfarm investors.
Pension funds continue to have interest in farmland purchases. Fifteen percent of the respondent indicated an increase demand and 24% indicated a decreased demand. In 2001, 10% indicated an increase in demand and 30% indicated a decrease in demand.
Expected Corn and Soybean Prices, Interest Rate, and Inflation
Expectations regarding crop prices over the next few years have a strong influence on farmland values because of their effect on the revenues derived from the purchase or rental of farmland. In order to gain some insight into price expectations, respondents were asked to estimate the annual average on-farm price of corn and soybeans for the period 2002 to 2006. Respondents have been asked to make these five-year projections since 1984.
Another decrease occurred in the expected five-year average price of corn and soybeans (Table 4). The price of $2.10 for corn and the $4.97 are the lowest expected five-year prices in the 19-year series. To the extent that land market participants have similar expectations, these price expectations will continue to exert downward pressure on land values and cash rents.
Other important expectations associated with a land purchase include the expected farm mortgage interest rate and the rate of inflation for next 5 years. The estimated interest rate declined again this year. This is the lowest expected interest rate in the series. The expected rate of inflation also continues to drift lower.
Factors Influencing Current Farmland Values
To obtain a more comprehensive assessment of the relative strength that various influences are currently exerting on farmland values, survey respondents were asked to assess the influence of 11 different items on farmland values. These items included:
- Current net farm income,
- Expected growth in returns,
- Crop prices & outlook,
- Livestock prices & outlook,
- Current & expected interest rates,
- Returns on competing investments,
- S. agricultural export sales,
- S. inflation/deflation rate,
- Current inventory of land for sale,
- Current cash liquidity of buyers, and
- Current U.S. agricultural policy.
Respondents were asked to use a scale from -5 to +5 to indicate the effect each item has on current farmland values. If the item had a major negative influence, it would be given a -5. If the item had a small negative influence, it would be given a -1. Positive influences were assessed in the same way, except positive weights were used. A weighted average for each item was calculated, and the results are presented in Figure 3. The numbers on the horizontal axis of the chart indicate the number of the influence in the above list.
Those items with the largest negative influences included the crop price level and outlook (3), current livestock price level and outlook (4), and current net farm income (1). Those with the largest positive influences included current and expected interest rates (5), current U.S. agricultural policy (11), the current inventory of land for sale (9), the current cash liquidity of buyers (10), and returns on competing investments (6).
Land Value/Cash Rent Multiples Figure 3 indicates that the current annual return to a land investment has an important influence on farmland values. The relationship between current returns from a farmland investment and the value of farmland is always changing. The 2002 survey indicates a value/rent multiple of 20.5 ($2,382 ÷ $116 = 20.5) for average land. Farmland values are generally 14 to 19 times current earnings (Figure 4). Since 1998, the multiple has been 19 or higher.
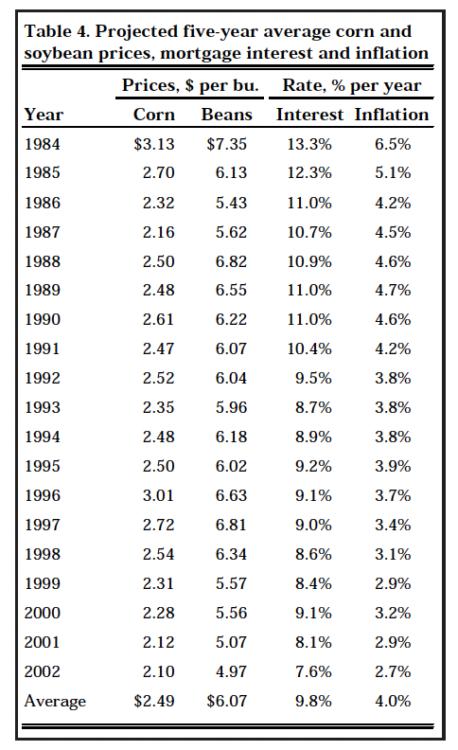
Table 4. Projected five-year average corn and soybean prices, mortgage interest and inflation
For the period 1975 to 2001, the value to rent multiple has ranged from a low of 12.4 in 1986 to a high of 20.6 in 1979 (Figure 4). Over the 1975 to 2002 period, the value to rent multiple averaged 16.5, with a standard deviation of 2.7. Two-thirds of the time the value to rent multiple has been within one standard deviation of the mean or within the range of 13.8 to 19.2. Ninety-five percent of the time the value to rent multiple has been within two standard deviations of the mean or in a range from 11.1 to 21.9. If the future is similar to the history represented in our data series, a decline in the value to rent multiple seems more likely than an increase.
What About the Future?
In spite of continued low grain prices, land values and cash rents continued to rise between June 2001 and June 2002. This increase has been aided by many factors. There continues to be strong demand for country residences and nonfarm development. The short recession in the U.S. economy did little to reduce this demand for Indiana farmland. Long-term interest rates remain low, adding additional strength to farmland values. Uncertainty about the characteristics of a new Farm Bill has been removed. The new Farm Bill appears to provide more support than provided under Freedom to Farm and the annual emergency appropriations made by Congress. The survey also indicates some renewed interest on the part of farmers and nonfarm investors in owning farmland, likely a reflection of reduced expectations regarding stock market returns. With these forces in play and the limited supply of farmland for sale, a continued increase in Indiana farmland values is expected.
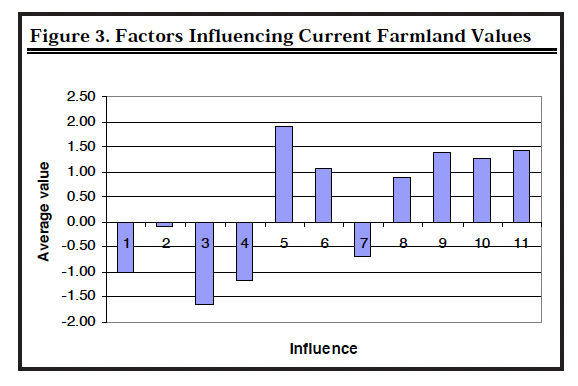
Figure 3. Factors Influencing Current Farmland Values
When asked to project farmland values for December 2002, respondents expected farmland values in all areas except the Northeast to show a modest increase (Table 1). In the Northeast, respondents expected a small decline in top quality and poor quality land and a slight increase in average quality land. For the state as a whole, a 0.8% increase was expected for each land category.
Respondents were also asked to project farmland values five years from now. Nearly 79% expected farmland values to be higher, 17% of the respondents expected farmland values to be the same, and 6%expected farmland values to be lower. Overall, respondents expect land values to be 7.6% higher in five years.
While there are several signs pointing to higher farmland values and many expect a continued increase, remember that a farmland purchase is a long-term commitment and economic circumstances can quickly change.
Factors in the rental market indicate continued strength as well. Expanding the size of the farm to spread fixed machinery and labor costs over more units of production is strategy that is being aggressively pursued by many farmers. This has helped create a strong demand for rental land. The new Farm Bill removes the uncertainty that support for commodity programs might be reduced, at least until the next revision. While Congress does not intend for this income support to go to nonfarming landowners, the competitive nature of this market has resulted in at least part of this support being bid into cash rents. At least some of the increased support payments in the 2002 Farm Bill will be bid into cash rents. In addition, at this time there appears to be some positive news regarding corn and soybean prices. Indiana producers have also been blessed with above-average and in some cases record corn and soybean yields for the past several years. With delayed planting this Spring, yield expectations for this year’s crop are not as strong as previous years. With a moderate reduction in yields it seems likely that cash rents will be steady to higher rather than decline. However, if yields for this crop are down sharply, some softening of cash rents is expected.
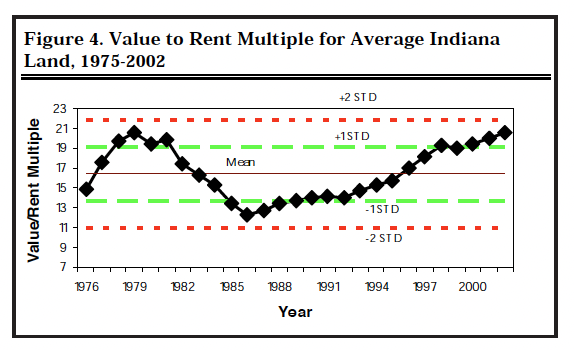
Figure 4. Value to Rent Multiple for Average Indiana Land, 1975-2002
**********
The land values survey was made possible by the cooperation of professional farm managers, appraisers, brokers, bankers, Purdue Extension educators, and persons representing the Farm Credit System, the Farm Service Agency (FSA) county offices, and insurance companies. Their daily work requires that they stay well informed about land values and cash rents in Indiana. The authors express sincere thanks to these friends of Purdue and Indiana agriculture. They provided 325 responses representing nearly all Indiana counties. We also express appreciation to Carolyn Hunst of the Department of Agricultural Economics for her help in conducting the survey.
![]()
![]()
![]()
![]()
![]()
