2009 Indiana Farmland Values & Cash Rents: Relative Calm in a Turbulent Economy
August 1, 2009
PAER-2009-9
Craig L. Dobbins, Professor and Kim Cook, Research Associate
![]()
![]()
![]()
![]()
![]()
With a credit crisis, bankruptcies of business icons, turmoil in the housing industry, stock market uncertainties, and declining crop margins, are sharply falling Indiana farmland values the next item of bad news? To gather information about changes in farmland values and cash rents, professionals working in the farmland market are contacted each June*. Based on the 2009 Purdue Farmland Value Survey, Indiana farmland values have not been immune to the negative economic forces sweeping through the general economy, but for the state as a whole, the decline in farmland values has been small. This report provides a summary of the survey results.
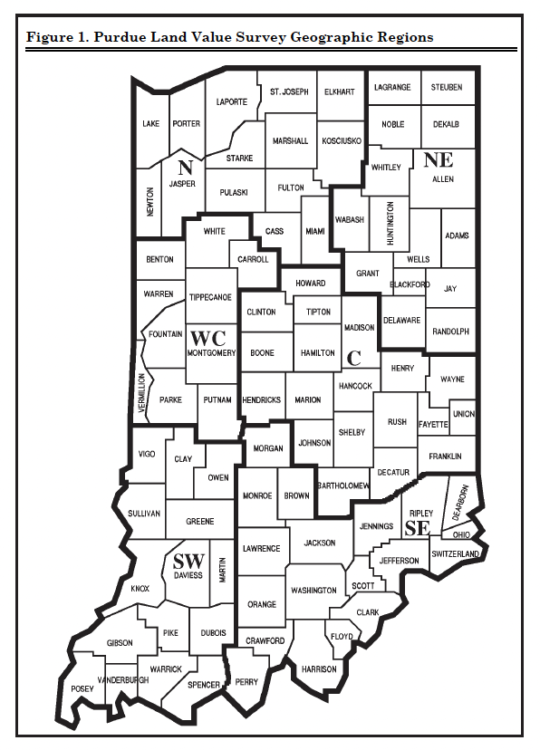
Figure 1. Purdue Land Value Survey Geographic Regions
State‑wide Farmland Values
For the period of June 2006 to June 2008, Indiana farmland values increased about one‑third (35.8%, 34.1% & 32.7% for poor, average, and top quality farmland). In the farmland market, it is common to have a period of little change or even small declines after a period of strong increases. For the state as a whole, the survey showed little change in farmland values from June 2008 to June 2009. The average value of bare Indiana cropland ranged from $3,351 per acre for poor quality land to $4,994 per acre for top quality land (Table 1).
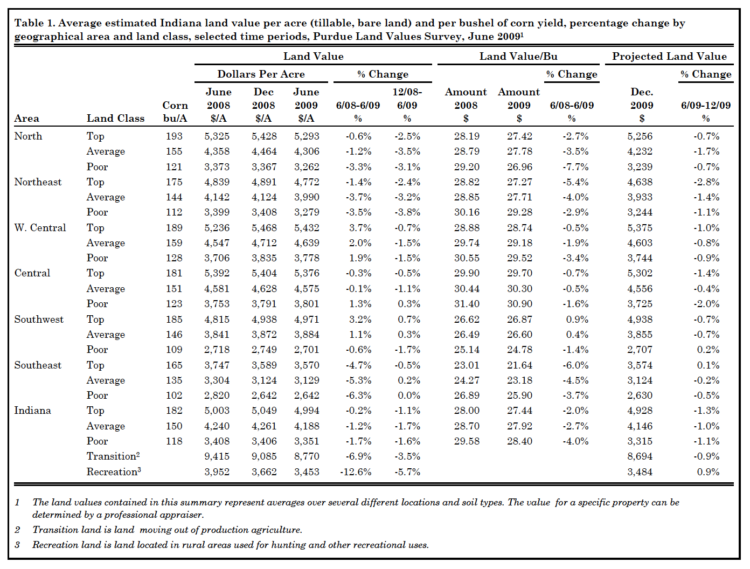
Table 1. Average estimated Indiana land value per acre (tillable, bare land) and per bushel of corn yield, percentage change by geographical area and land class, selected time periods, Purdue Land Values Survey, June 2009
Average quality cropland had an average value of $4,188 per acre. For the 12‑month period ending June 2009, there were modest declines in all three land qualities. The value of top, average, and poor quality land declined 0.2%, 1.2% and 1.7%, respectively.
The value of farmland is influenced by many factors. One often cited reason for differences in the value of farmland is soil productivity. To assess the productivity of the various land qualities, survey respondents are asked to provide an estimate of the long‑term corn yield for poor, average, and top quality land. These long‑term corn yield estimates are averaged to provide a land productivity measure. For the state, the averages of the reported yields for poor, average, and top quality land were 118, 150, and 182 bushels per acre, respectively. State‑wide, the value per estimated bushel of corn yield for poor, average, and top land qualities was $28.40, $27.92 and $27.44 per bushel, respectively.
Last year saw a decline in the average value of transitional land, farmland moving out of agriculture. This decline continued this year, but was much larger. The average value of transitional land in June 2009 was $8,770 per acre, a decline of 6.9%. Given the recession and the difficulties in the housing industry, it is not surprising to see a softening in this market. The estimated value of land in this market continues to have a wide range. In June 2009, transitional land value estimates ranged from $3,000 to $50,000 per acre. This is a specialized market with the value of transitional land strongly influenced by what the land is transitioning into and its location. Because of the wide variation in values of transitional land, the median value** may give a more meaningful picture than the arithmetic average. The median value of transitional land decreased from $8,000 per acre in June 2008 to $7,000 in June 2009.
The state‑wide average value of rural recreational land used for hunting and other recreational uses is $3,453 per acre, a decline of 12.6% when compared to June 2008. Given the general economic recession and the loss in value associated with stock investments, demand for recreational land is likely to have declined sharply. As with transitional land, there is a wide range of values for rural recreational land, again making the median value a more meaningful indictor of changes in value than the arithmetic average. The median value for rural recreational land in June 2009 declined from $3,500 per acre in 2008 to $3,000.
State‑wide Rents
One important contributor to the value of farmland is the annual rent that can be obtained from ownership. State‑wide, cash rents both increased and decreased. Top and average quality land increased $4 per acre and $1 per acre, respectively. Cash rent on poor quality land decreased by $2 per acre (Table 2). The average estimated cash rent was $198 per acre on top quality land, $158 per acre on aver‑ age quality land, and $121 per acre on poor quality land. This was an increase in rental rates of 2.1% for top quality land, 0.6% for average quality land, and a decrease of 1.6% for poor quality land. State‑wide, rent per bushel of estimated corn yield was $1.03 to $1.09 per bushel.
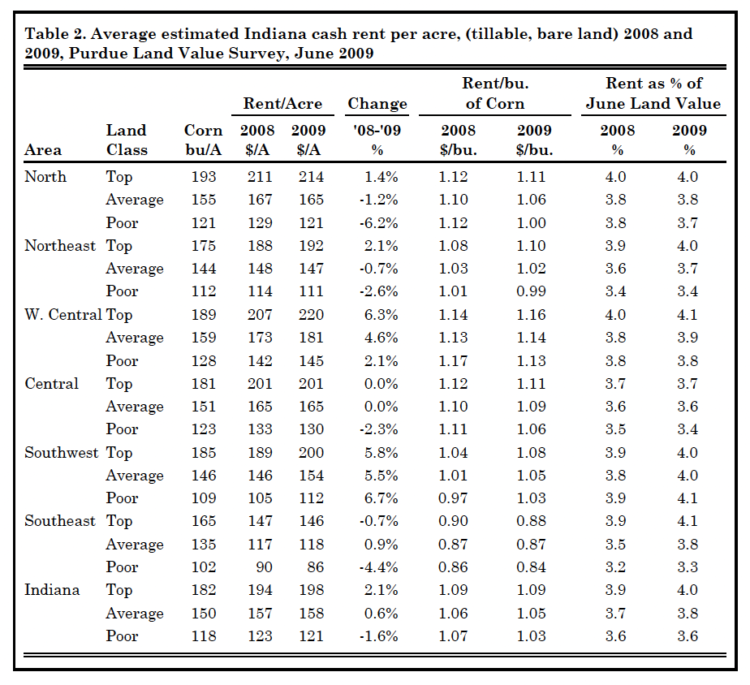
Table 2. Average estimated Indiana cash rent per acre, (tillable, bare land) 2008 and 2009, Purdue Land Value Survey, June 2009
In assessing these cash rents, it is important to recognize that 2009 rents were established during the Fall of 2008 and the Winter of 2009. Market changes that have occurred since then are not reflected in the reported 2009 cash rent, but will have an important influence on the negotiation of 2010 cash rent.
For top quality farmland, cash rent as a percentage of farmland value was 4.0%. For average and poor quality farmland, cash rent as a percentage of farmland value was 3.8% and 3.6%, respectively. These percentage values were either the same or slightly more than those reported in 2008. This is the first time in a number of years that these percentages have not declined. Over the 35‑year history of the survey, rent as a percentage of farmland value has averaged 5.8%.
Area Land Values
Survey responses were organized into six geographic regions (Figure 1). As in the past, there are geographic differences in land value changes. This year, the West Central region reported the strongest percentage increase in farmland values. Bare farmland in this area was estimated to have increased 1.9% to 3.7% (Table 1). This was the only region to report increases for all three land qualities. The Central region had an increase for poor quality land and the Southwest region had an increase in top and average land. The North, Northeast, and Southeast regions reported declines in land values across all three productivity levels. These declines ranged from 0.6% to 6.3%. The largest declines were in the Southeast region, ranging from 4.7% to 6.3%.
Per acre farmland values are the highest in the Central and West Central regions. The highest value per acre for top and average quality farmland was in the West Central region. The highest value for poor quality farmland is in Central Indiana. The lowest farmland values statewide continue to be in the Southeast.
Land value per bushel of estimated long‑term corn yield (land value divided by bushels) is the highest in the Central region, ranging from $29.70 to $30.90 per bushel. This was followed by the West Central region, ranging from $28.74 to $29.52 per bushel. Per bushel values for the North and Northeast regions ranged from $26.96 to $29.28 per bushel. The Southeast had the lowest land values per bushel, ranging from $21.64 to $25.90 per bushel. In all regions except the Southwest and North, the poor quality land was the most expensive per bushel.
Area Cash Rents
Changes in cash rent also varied across the state. The strongest percentage increases were in the West Central and Southwest regions. Here cash rents were estimated to have increased from 2.1% to 6.7% (Table 2). Constant or declining cash rents were reported in the Central and Southeast regions. The North and Northeast reported increases for top quality land and declines for average and low quality land. For all regions except the Southwest and Southeast, top quality land showed the most strength.
The highest cash rent of $220 per acre is in the West Central region for top quality land. With a range in per acre rents of $145 to $220, this region has the strongest cash rents across all land qualities. Cash rents are the lowest in the Southeast, $86 to $146 per acre.
Differences in productivity have a strong influence on per acre rents. To adjust for productivity differences, cash rent per acre was divided by the estimated corn yield. Rent per bushel of corn yield in the West Central region ranged from $1.13
to $1.16. Cash rent per bushel of corn yield in the North, Northeast, Central, and Southwest regions are similar, ranging from $0.99 to $1.11 per bushel. Per bushel cash rent in the Southeast ranged from $0.84 to $0.88 per bushel.
Distribution of Responses
The data contained in Tables 1 and 2 provides information about the average response from the survey. In addition to the average, it is also important to know something about the range of the responses. Why is understanding something about the range of responses important? It is possible to have the same average but have a difference in the range. One measure of how responses are distributed about the average is the standard deviation. Information about the standard deviation and the distribution of responses for corn yields, June farmland values, and cash rent is provided in Table 3.
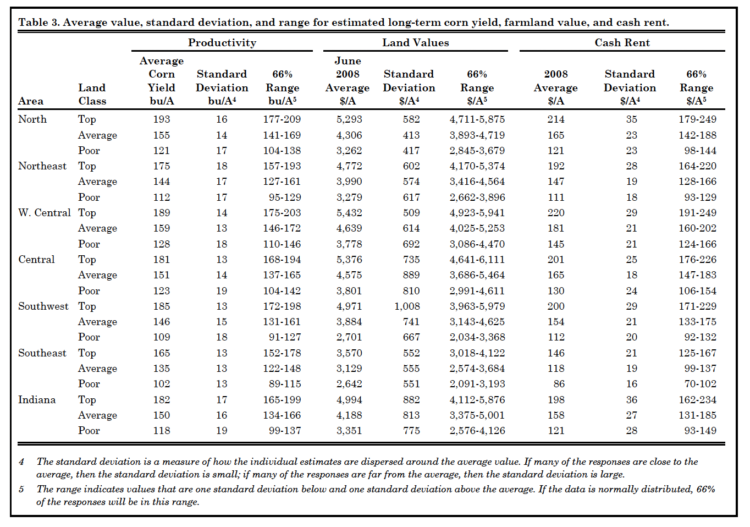
Table 3. Average value, standard deviation, and range for estimated long-term corn yield, farmland value, and cash rent.
To illustrate the use of this information, note that the June value of average quality land in the West Central and the Central region is similar, $4,639 in the West Central and $4,575 in the Central. The standard deviation for the average is $614 in the West Central and $889 in the Central. The larger standard deviation indicates that while the average is about the same, the range of values around the average for the Central region is larger. The range in Table 3 indicates the value that is one standard deviation above and below the average. If it is assumed that the data is normally distributed, then 66% of the values would fall in this range. Assuming that estimates are normally distributed, 66% of the responses providing the West Central average of $4,639 would be between $4,025 and $5,253. For the Central region, 66% of the responses providing the average of $4,575 would be from a wider range of $3,686 to $5,464.
Rural Home Sites
Respondents were asked to estimate the value of rural home sites with no accessible gas line or city utilities and located on a blacktop or well‑maintained gravel road. The median value for five‑acre home sites ranged from $6,000 to $9,500 per acre (Table 4). The median values in all regions except the North declined. Estimated per acre median values of the larger tracts (10 acres) ranged from $6,000 to $8,000 per acre. The median values in the North and West Central regions remained the same. Median values in the Northeast, Central, & Southwest declined. The median value in the Southeast increased. The decline in these values indicate that at least in some areas of the state the demand for rural home sites is not as strong, reflecting a weaker residential housing market.
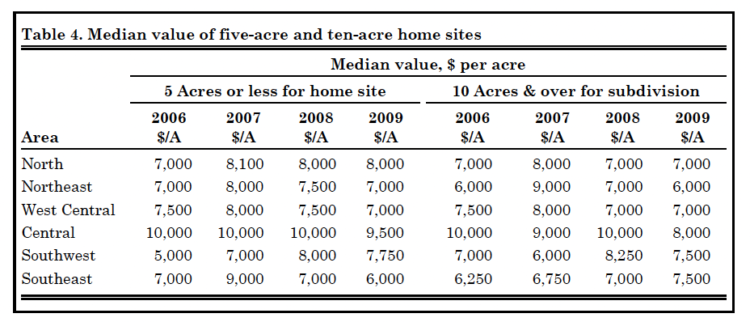
Table 4. Median value of five-acre and ten-acre home sites
Farmland Supply & Demand
To assess how the supply of land on the market is changing, respondents were asked to provide their opinion of the amount of farmland on the market now compared to a year earlier. The respondents indicated either more, the same, or less land was on the market than one year ago. Only 8% of the 2009 respondents indicated more land was on the mar‑ ket now compared to year‑ago levels (Figure 2). Fifty‑eight percent of the respondents indicated the amount of land on the market was the same. The remaining 34% of the respondents indicated the amount of land on the market at the current time was less than a year ago. The percentage of the respondents indicating more land was on the market declined from 16% in 2007 and 2008. The percentage of the respondents indicating less land was on the market declined from 38% and 37%, respectively in 2007 and 2008. In 2006 and 2007, the number of respondents indicating the same amount of land was on the market was 46% and 48%, respectively. While the variability of net returns from crop production and other uncertainties have increased, this does not seem to have had much influence on decisions to place farmland on the market.
Respondents were also asked to provide their perception of changes in demand for farmland. One source of farmland demand is farmers seeking to expand the size of their businesses. Respondents were asked to indicate if the demand from farmers had increased, remained the same, or decreased when compared to a year earlier. In 2007 and 2008, the number of respondents indicating an increased demand from farmers was 75% and 71%, respectively (Figure 3). This year, 50% of the respondents indicated increased farmer demand. Ten percent indicated a decrease in demand from farmers. The remaining 40% of the respondents indicated that farmer demand remained the same. Given the sharp increases in demand from farmers in 2006 & 2007, the 2009 results indicate that demand from farmers still remains fairly strong, but it is not as robust has the past two years.
Rural home sites have been a strong source of demand for several years. Over the past two years there has been a lot of discussion about the difficulties in the housing market. These difficulties appear to be influencing the demand for rural residences. This year, only 14% of the respondents indicated that there was increased demand for rural residences (Figure 4). In 2007, 56% indicated an increased demand for rural residences. This year the number of respondents indicating a decrease in demand for rural residences was 59%. The remaining 27% of the respondents indicated no change. These shifts imply there has been a significant reduction in demand for rural residences during the last three years.
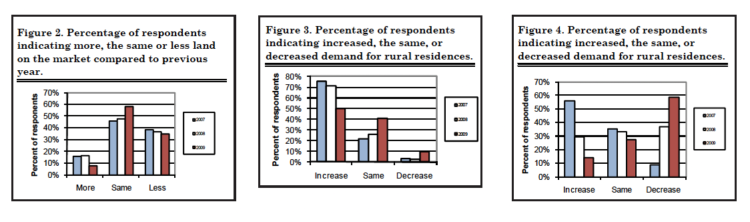
Figure 2. Percentage of respondents indicating more, the same or less land on the market compared to previous year.
Figure 3. Percentage of respondents indicating increased, the same, or decreased demand for rural residences.
Figure 4. Percentage of respondents indicating increased, the same, or decreased demand for rural residences.
Non-farm investors are another group that contributes to the demand for farmland. Respondents were asked to indicate if they perceived an increase, the same, or a decrease in demand from individual investors as well as organized investment efforts such as pension funds. This year, the percentage of respondents indicating a decrease in non-farm investor interest was almost twice as large as in 2008. The percentage of the respondents indicating an increase showed a significant decline compared to 2008 (Table 5). While there has been some reports of non‑ farm investment money flowing into farmland purchases, these survey responses indicate that this does not seem to be the case in Indiana.
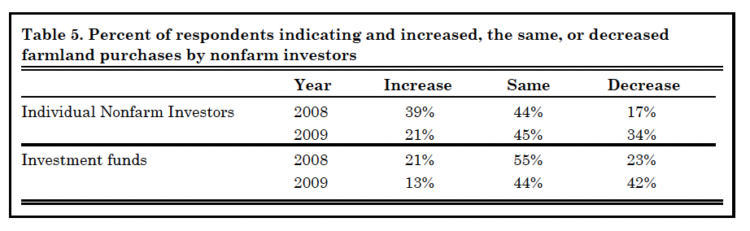
Table 5. Percent of respondents indicating and increased, the same, or decreased farmland purchases by non-farm investors
Expected Grain Prices, Interest Rates, & Inflation
Making a farmland purchase is typically a long term commitment. As a result, expectations regarding crop prices over the next few years can have a strong influence on farmland values. In order to gain insight into crop price expectations, respondents were asked to estimate the annual average on‑farm price of corn and soybeans for the period 2009 to 2013. This year saw a large reduction in the expected five‑year average price of corn and soybeans (Table 6). On average, survey participants expect corn prices to be $4.34 per bushel and soybean prices to be $9.88 per bushel, estimates that are still well above the 10‑year average for the period from 2000 to 2009 but much lower than last year’s estimates. If these lower prices materialize and production costs for corn and soybeans remain constant or decline only slightly, the decline in expected prices indicates a significant tightening of crop production margins.
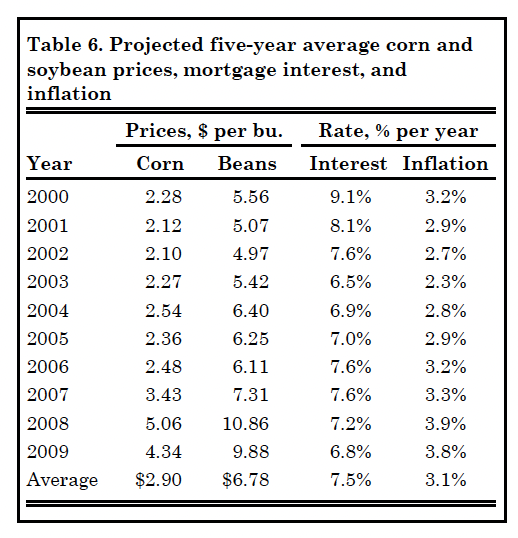
Table 6. Projected five-year average corn and soybean prices, mortgage interest, and inflation
Mortgage interest rates have important implications for real estate markets. Mortgage rates are near historic lows. Survey respondents are expecting mortgage interest rates to remain modest. The average estimate of 6.8% in 2009 is below the 10‑year average estimate of 7.5%. For the 10‑year period, only 2003 had a lower estimate.
Inflation rate expectations continue to increase. On average, survey respondents estimate annual inflation over the next five years will be 3.8%. This is above the average for the 2000 to 2009 period and very similar to the estimate in 2008.
Market Influences
To identify the forces currently influencing the farmland market, survey respondents were asked to assess the influence of 11 different items. These items included:
1. Current net farm income
2. Expected growth in returns to land
3. Crop price level and outlook
4. Livestock price level and outlook
5. Current & expected interest rates
6. Returns on competing investments
7. Outlook for U.S. agricultural export sales
8. U.S. inflation/deflation rate
9. Current inventory of land for sale
10. Current cash liquidity of buyers
11. Current U.S. agricultural policy
Respondents were asked to use a scale from ‑5 to +5 to indicate the effect of each item on farmland values. A negative influence would be given a value from ‑1 to ‑5, with a ‑5 representing the strongest negative influence. A positive influence was indicated by assigning a value between 1 and 5 to the item, with 5 representing the strongest. An average for each item was calculated.
In order to provide a perspective on the changes in these influences, data from 2007, 2008, and 2009 are presented in Figure 5. The horizontal axis of the chart indicates the item from the list above. For this three year period, all the items except live‑ stock prices have a positive influence. The declining profitability or growing losses associated with livestock production over this time period has lead to the influence of livestock prices and outlook growing more negative over this period.
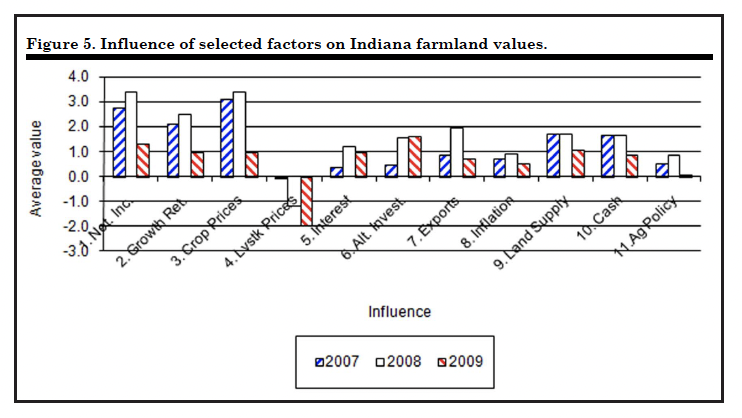
Figure 5. Influence of selected factors on Indiana farmland values.
In 2007 and 2008, the major positive influences included current net farm income, expected growth rate in return to land, and crop price level and outlook. This year these items are still positive influences, but they have a much smaller positive influence. Compared to 2008, the positive influence of all factors except the influence of alternative investments declined. The positive influences in 2009 were lower than in 2007except for interest rates and alternative investments. This indicates that the lack of good alter‑ native investments is contributing to the current strength of farmland values. The influence of alternative investments was the most positive influence this year. This year the perceived influence of government programs declined to almost zero. These measures indicate a significant change in the respondents’ view of the land market.
Expected Future Land Values Expectations about corn and soybean prices, net income, and the other influences impacting the land market indicate a softening of farmland values. On a state‑wide basis, Table 1 indicates that for the six‑month period from June to December 2009, survey respondents expect farmland values to decrease 1.1% to 1.3%. The averages indicate that survey respondents in all regions of the state are expecting farmland values to remain steady to slightly down. The largest average anticipated reduction is 2.8% for top land in the Northeast region. The average anticipated change for this six month period is expected to be positive in only two cases, top land in the Southeast and poor land in the Southwest. These positive changes were both very small.
Respondents were also asked to project farmland values five years from now. Fifty‑eight percent of the respondents expect farmland values to be higher. The average increase for this group was 10.5%. This translates into an average annual increase of 2.0%. Nineteen percent expect farmland values to decline. The aver‑ age decline for this group was 11.6%. Combining all responses provided an expected total increase in farmland value for the next five years of 4.3%, an increase of 0.84% per year.
Final Comment
The 2009 Purdue Farmland Value and Cash Rent Survey indicates that after several years of moving strongly higher, farmland values have paused. While some people have forecast a significant downward adjustment in farmland values as a result of the decline in grain prices, this has not occurred. However, survey participants are expecting continued small declines in average farmland values by December 2009. Five years from now 58% of the survey respondents expect farmland values to be higher than they are today, but the annual rate of increase is much less than recent increases. While a majority of the survey respondents expect farmland values to be higher, 42% of the respondents expect values in five years to be the same or less.
These expectations point to a high level of uncertainty. The recent decline in crop prices has significantly reduced the contribution margin from crop production. Economics indicates that a reduction in the net return from an investment like farmland will lead to a reduction in the value of the asset and the amount of cash rent that tenants can pay. Based on the 2009 Purdue Land Value Survey, there has been very little downward adjustment in farmland values or cash rent. This is a pattern consistent with history.
History indicates that after a period of strong increases a sharp downward adjustment in the land market can occur, but such a shift is rare. A more common pattern is one of little or no increase, or small declines. What explains this pattern of farmland values? Farmland is often held by owners that are financially strong – farmland owners have low levels of debt. Rather than sell in a down market, financially strong owners will often wait until their asking price is obtained. A period with sharp downward corrections in farmland values such as the early 1980s often has a high number of foreclosures or forced sales. The current strong financial position of the farm sector makes a significant number of forced sales seem unlikely. But given the increased economic uncertainty and the continued decline in grain prices since the survey was completed, this is also a time when one needs to review their situation and estimate how a sharp downward adjustment in farmland values or cash rent would impact your business or personal situation.
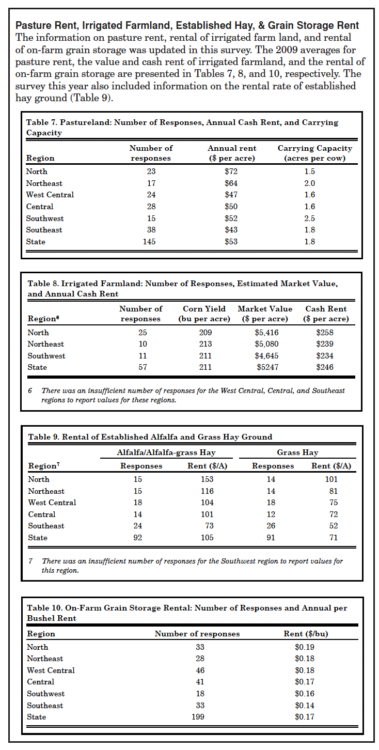
Pasture Rent, Irrigated Farmland, Established Hay, & Grain Storage Rent The information on pasture rent, rental of irrigated farm land, and rental of on‑farm grain storage was updated in this survey. The 2009 averages for pasture rent, the value and cash rent of irrigated farmland, and the rental of on‑farm grain storage are presented in Tables 7, 8, and 10, respectively. The survey this year also included information on the rental rate of established hay ground (Table 9).
* The individuals surveyed include rural appraisers, agricultural loan officers, FSA personnel, farm managers, and farmers. The results of the survey provide information about the general level and trend in farmland values.
** The median is the middle observation in data that have been arranged in ascending or descending numerical order.
Purdue Land Value and Cash Rent Survey
The Purdue Land Value and Cash Rent Survey is conducted each June. The survey was made possible through the cooperation of numerous professionals that are knowledgeable of Indiana’s farmland market. These professionals include farm managers, appraisers, land brokers, agricultural loan officers, Purdue Extension educators, farmers, and persons representing the Farm Credit System, the Farm Service Agency (FSA) county offices, and insurance companies. Their daily work requires that they stay well informed about land values and cash rents in Indiana.
These professionals are asked to provide an estimate of the market value for bare poor, average, and top quality farmland in December 2008, June 2009, and the expected value for December 2009. They are also asked to provide an estimate of the current cash rent for each land quality. To assess the productivity of the land, respondents provide an estimate of long-term corn yields. Respondents are also asked to provide a market value estimate for land transitioning out of agriculture.
Responses from 328 professionals are contained in this year’s survey representing all but one Indiana county. There were 51 responses from the North region, 63 responses from the Northeast region, 72 responses from the W. Central region, 67 responses from the Central region, 33 responses from the Southwest region, and 42 responses from the Southeast region. Figure 1 illustrates the counties in each region.
Appraisers accounted for 19% of the responses, farm loan professionals represented 63% of the responses, farm managers or farm operators provided 9% of the responses, and other professionals provided 9% of the responses. The data reported here provide general guidelines regarding farmland values and cash rent. To obtain a more precise value for an individual tract, contact a professional in your area that has a good understanding of the local situation. We express appreciation to Marsha Slopsema of the Department of Agricultural Economics for her help in conducting the survey.
![]()
![]()
![]()
![]()
![]()
