Indiana Farmland Values & Cash Rents: Renewed Strength in a Weak Economy
August 19, 2010
PAER-2010-06
Craig L. Dobbins, Professor and Kim Cook, Research Associate
![]()
![]()
![]()
![]()
![]()
A year ago with wreckage from the credit crisis still scattered across the national economy, tightened crop margins, and softness in the farm land market, there was concern that there would be a sharp downward correction in Indiana farmland. Based on the 2010 Purdue Farmland Value Survey*, this has not happened. Results of the June 2010 survey indicate Indiana land values not only did not decline but showed a strong increase. This report provides a summary of the survey results.
State‑wide Farmland Values
For the state as a whole, the 2010 survey found the average value of bare Indiana cropland ranged from $3,501 per acre for poor quality land to $5,310 per acre for top quality land (Table 1). Average quality cropland had an average value of $4,419 per acre. For the 12‑month period ending June 2010, there were increases in all three land qualities. The value of top, average, and poor quality land increased 6.3%, 5.5% and 4.5%, respectively.
Many factors influence farmland values. One often cited reason for different farmland values is soil productivity. To assess the productivity of the various land qualities, survey respondents estimated long‑term corn yields for poor, average, and top quality land. The average of these long‑term corn yield estimates provides a land productivity measure. For the state, the averages of the reported yields for poor, average, and top quality land were 121, 155, and 187 bushels per acre, respectively. State‑wide, the value per estimated bushel of corn yield for poor, average, and top land qualities was $28.93, $28.56 and $28.41 per bushel, respectively.
Last year saw a decline in the average value of transitional land, farmland moving out of agriculture. This decline continued for the third straight year. The average value of transitional land in June 2010 was $8,306 per acre, a decline of 5.3%. The estimated value of land in this market continues to have a wide range. In June 2010, transitional land value estimates ranged from $3,000 to $32,000 per acre. This is a specialized market with the transitional land value strongly influenced by the planned use and location. Because of the wide variation in values of transitional land, the median value** may give a more meaningful picture than the arithmetic average. The median value of transitional land in 2010 was $7,000 per acre, the same value reported in 2009.
The state‑wide average value of rural recreational land used for hunting and other recreational activities is $2,949 per acre, a decline of 14.6% when compared to June 2009. As with transitional land, there is a wide range of values for rural recreational land, again making the median value a more meaningful indictor of changes in value than the arithmetic average. The median value for rural recreational land in June 2010 was $2,800 per acre. In 2009, this value was $3,000 per acre.
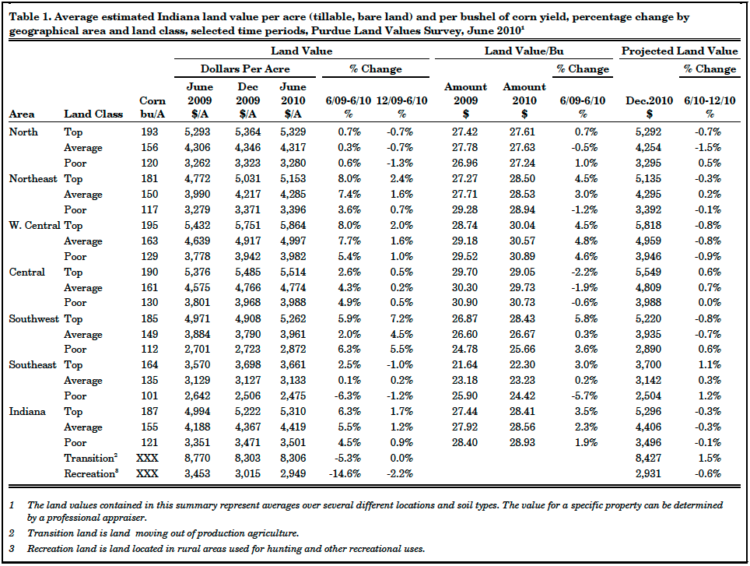
Table 1. Average estimated Indiana land value per acre (tillable, bare land) and per bushel of corn yield, percentage change by geographical area and land class, selected time periods, Purdue Land Values Survey, June 20101
State‑wide Rents
One important contributor to the value of farmland is the annual rent obtained from ownership. State‑wide, 2010 cash rents increased. The average for top quality land increased $4 per acre. For average and poor quality land, the average increased by $3 per acre (Table 2). The average estimated cash rent was $202 per acre on top quality land, $161 per acre on average quality land, and $124 per acre on poor quality land. This was an increase in rental rates of 2.0% for top quality land, 1.9% for average quality land, and 2.5% for poor quality land. State‑wide, rent per bushel of estimated corn yield was $1.02 to $1.08 per bushel.
For top quality farmland, cash rent as a percentage of farmland value was 3.8%. For average and poor quality farmland, cash rent as a percentage of farmland value was 3.6% and 3.5%, respectively. These percentage values were lower than the values reported in 2009. After increasing last year, these percentages are again declining. Over the 36‑year history of the survey, rent as a percentage of farmland value has averaged 5.8%.
Area Land Values
Survey responses were organized into six geographic regions (Figure 1). As in the past, there are geographic differences in land value changes. This year, the West Central and the Northeast region reported the strongest percentage increase in farmland values. Bare farmland in these areas increased 3.6% to 8.0% (Table 1). The Central and Southwest regions reported increases of 2.0% to 6.3%. The North region reported increases of less than 1% for all land qualities. The Southeast region reported a 2.5% increase for top quality land, little change for average quality land and a 6.3% decline for poor quality land. The decline in poor quality land in the Southeast was the only decline reported in 2010.
Per acre farmland values are the highest in the Central and West Central regions. The highest value per acre for top and average quality farmland was in the West Central region. The highest value per acre for poor quality farmland is in Central Indiana. The lowest farmland values statewide continue to be in the Southeast.
Land value per bushel of estimated long‑term corn yield (land value divided by bushels) is the highest in the West Central region, ranging from $30.04 to $30.89 per bushel. Closely following was the Central region, ranging from $29.05 to $30.73 per bushel. Per bushel values for the North and Northeast regions ranged from $27.24 to $28.94 per bushel. The Southeast had the lowest land values per bushel, ranging from $22.30 to $24.42 per bushel. In all regions except the Southwest and North, poor quality land was the most expensive per bushel.
Area Cash Rents
Changes in area cash rent also varied across the state. The strongest percentage increase in cash rent was in the Central region. Here cash rents increased from 2.4% to 3.8% (Table 2). This was followed by the West Central region with increases between 1.4% to 2.3%. The cash rent changes in Northeast and the Southeast Indiana ranged from 0.0% to 3.6%. Constant or declining cash rents were reported in the North region. The Southwest reported a decline in cash rents for all land qualities.
The highest average per acre cash rent is $225 per acre for top quality land in the West Central region. With a range in per acre rents of $147 to $225, this region has the highest cash rents across all land qualities. Cash rents are the lowest in the Southeast, $86 to $151 per acre.
Differences in productivity have a strong influence on per acre rents. To adjust for productivity differences, cash rent per acre was divided by the estimated corn yield. Rent per bushel of corn yield in the West Central region ranged from $1.13 to $1.15. Cash rent per bushel of corn yield in the North, Northeast, Central, and Southwest regions are similar, ranging from $0.95 to $1.10 per bushel. Per bushel cash rent in the Southeast ranged from $0.85 to $0.92 per bushel.
Distribution of Responses
The data contained in Tables 1 and 2 provides information about the average of the survey response. Averages are helpful in understanding the general direction in which land values and cash rents are moving. However, it is important to remember that averages are developed from several different responses. In some cases, responses are closely clustered around the average, people are in close agreement. In other cases, the responses may be widely dispersed. It is possible that we could have the same or nearly the same average with either set of responses. One measure of how closely responses are clustered around the average is the standard deviation. The smaller the standard deviation, the more closely clustered the responses are to the average. Information about the standard deviation and thus the distribution of responses around the average corn yields, June farmland values, and cash rent is in Table 3.
To illustrate the use of this information, note that the June value of top quality land in the North and the Southwest region is similar, $5,329 in the North and $5,262 in the Southwest. This is a difference of only $67 per acre. However, the standard deviation for the average is $627 in the North and $1,305 in the Southwest. The larger standard deviation indicates that the average in the Southwest came from a much wider range of responses than the average in the North. Assuming that responses are normally distributed 66% of the responses for the North average of $5,329 would be between the range of $4,702 and $5,956. For the Southwest region, 66% of the responses providing the average of $5,262 would be from a wider range of $3,957 to $6,567.
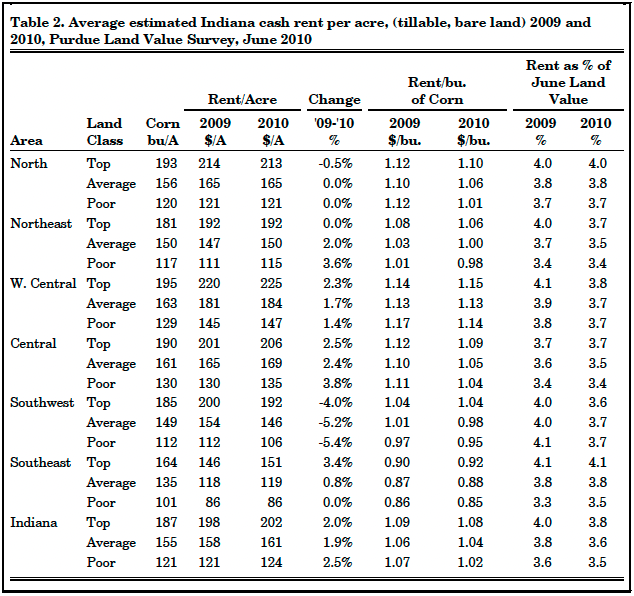
Table 2. Average estimated Indiana cash rent per acre, (tillable, bare land) 2009 and 2010, Purdue Land Value Survey, June 2010
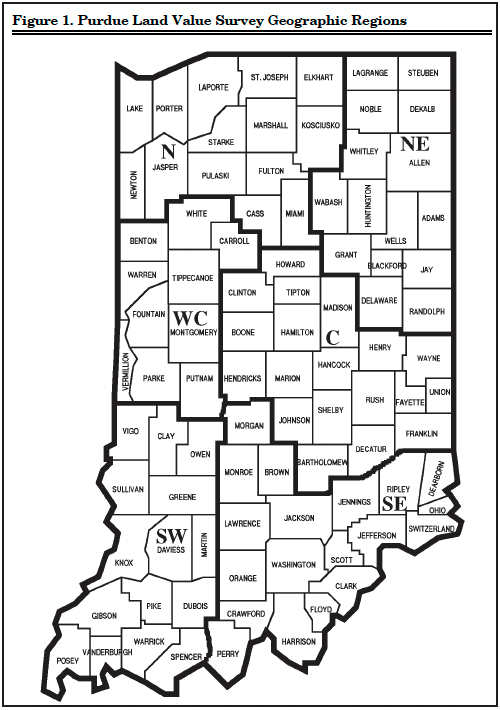
Figure 1. Purdue Land Value Survey Geographic Regions
Rural Home Sites
Respondents provided estimates of the value of rural home sites with no accessible gas line or city utilities located on a blacktop or well‑maintained gravel road. The median value for five‑acre home sites ranged from $5,500 to $8,000 per acre (Table 4). The only region with an increase in median value was the West Central region. The median value in the Northeast was the same as in 2009. All other regions had a decline in median value.
Estimated per acre median values of the larger tracts (10 acres & over) ranged from $5,900 to $7,500 per acre. Compared to 2009, the Northeast region was the only region with an increase in median value. While this value increased from $6,000 per acre in 2009 to $6,500 in 2010, it was still well below the $9,000 value reported in 2007. The median value in the North region was the same as in 2009. Median values in all other regions were below 2009 values.
The 2010 survey indicates that for some areas of the state the downward adjustment taking place in the value of rural home sites may be nearing an end. However, for other areas, this market continues to adjust downward.
Farmland Supply & Demand
To assess changes in the supply of land on the market, respondents were asked to provide their opinion of the amount of farmland on the market now compared to a year earlier. The respondents indicated either more, the same, or less land was on the market than one year ago. Only 9% of the 2010 respondents indicated more land was on the market now compared to year‑ago levels (Figure 2). Forty percent of the respondents indicated the amount of land on the market was the same. The remaining 51% of the respondents indicated the amount of land on the market at the current time was less than a year ago. This was an increase from 35% in 2009. These changes suggest a smaller supply of land for sale.
The respondents also provided their opinion on the number of farmland transfers the past 6 months compared to a year earlier.
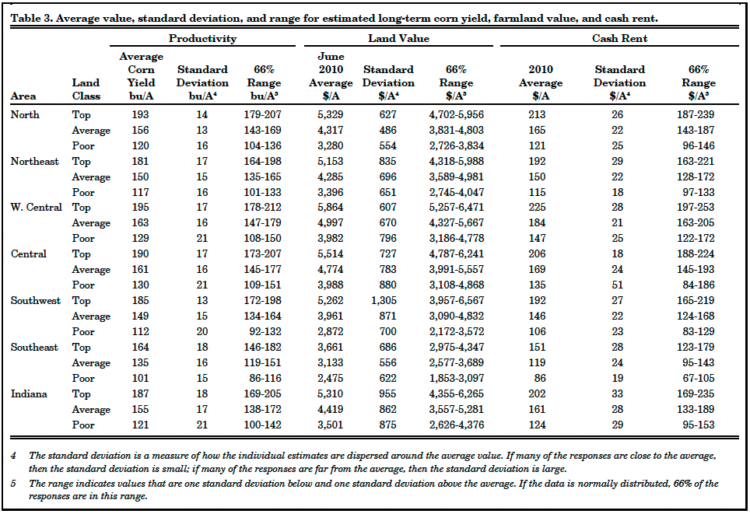
Table 3. Average value, standard deviation, and range for estimated long-term corn yield, farmland value, and cash rent.
They could respond with up, down or the same. Twenty percent of the respondents indicated there were more transactions, 36% indicated the same, and 44% indicated fewer transactions. In 2009, the percent of respondents indicating there were more, the same, or fewer, were 10%, 56%, and 35%, respectively. While it is less clear from these observations that there is a smaller amount of farmland on the market, two years with 80% or more of the respondents indicating the same or fewer transactions does indicate some slowdown in the number of transfers.
Respondents were also asked to provide their perception of changes in demand for farmland. One source of farmland demand is farmers seeking to expand the size of their businesses. Respondents indicate if the demand from farmers had increased, remained the same, or decreased when compared to a year earlier. In 2008, the number of respondents indicating an increased demand from farmers was 71% (Figure 3). This declined to 50% of the respondents in 2009 and was 51% in the 2010 survey. Seven percent indicated a decrease in demand from farmers in 2010. The remaining 42% of the 2010 respondents indicated that farmer demand remained the same. With 93% of the respondents indicating the same or increasing farmer demand, farmer purchases appear to still be a strong source of demand.
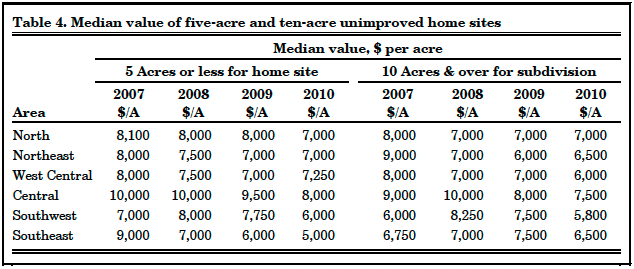
Table 4. Median value of five-acre and ten-acre unimproved home sites
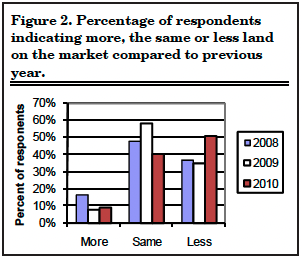
Figure 2. Percentage of respondents indicating more, the same or less land on the market compared to previous year.
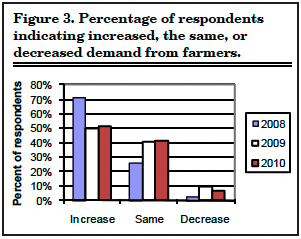
Figure 3. Percentage of respondents indicating increased, the same, or decreased demand from farmers.
Before the downward correction in the housing market, credit crisis, and recession, rural home sites were a strong source of demand. Over the past four years demand from this source has changed significantly. In 2007, 56% of the respondents indicated an increase in demand for rural residences. In 2010, only 13% indicated an increase in demand from this source. In 2009 & 2010, 58% of the respondents indicated a decrease in demand from this source. In 2007, only 9% of the respondents indicated a decrease in demand for rural residences. This trend indicates there has been a significant reduction in demand for rural residences over the last four years.
Nonfarm investors are another group that contributes to the demand for farmland. Respondents indicated if they perceived an increase, the same, or a decrease in demand from individual investors as well as investment funds such as pension funds. The percentage of respondents indicating an increased interest from nonfarm investors increased from 21% in 2009 to 32% in 2010 (Table 5). The percentage of respondents indicating the same or less interest by nonfarm investors both declined.
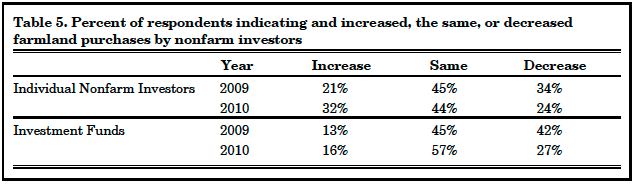
Table 5. Percent of respondents indicating and increased, the same, or decreased farmland purchases by nonfarm investors
The largest decline came from respondents indicating a decrease in non-farm investor interest.
There were some similar changes associated with investment funds. Compared to 2009, the number of respondents reporting a decreased interest from investment funds declined. In 2009, 42% of the respondents indicated less interest on the part of investment funds. In 2010, only 27% indicated less interest. There was an increase in respondents indicating an increased interest from investment funds, increasing from 13% to 16%. The largest change was in the number of respondents indicating interest was the same. These changes seem to indicate that in 2010 there was not renewed interest on the part of investment funds in making purchases of Indiana farmland.
Expected Grain Prices, Interest Rates, & Inflation
Making a farmland purchase is typically a long term commitment. As a result, expectations regarding crop prices over the next few years can have a strong influence on farmland values. In order to gain insight into crop price expectations, respondents estimated the annual average on‑farm price of corn and soybeans for the period 2010 to 2014. This year saw a large reduction in the expected five‑year average price of corn and soybeans (Table 6). On average, survey participants expect corn prices to be $3.79 per bushel and soybean prices to be $9.20 per bushel, estimates that are still above the 10‑year average for the period from 2001 to 2010 but much lower than peak estimates in 2008. If these lower prices materialize and production costs for corn and soybeans remain constant or decline only slightly, the decline in expected prices indicates a continued tightening of crop production margins.
Mortgage interest rates have important implications for real estate markets. Mortgage rates continue to be near historic lows. Survey respondents are expecting mortgage interest rates to remain modest. The average estimate of 6.5% in 2010 is below the 10‑year average estimate of 7.2%. For the 10‑year period, this is the period low and occurred once before in 2003.
Inflation rate expectations have reversed direction. On average, survey respondents estimate annual inflation over the next five years will be 3.1%. This is equal to the average for the 2001 to 2010 period. Compared to the estimates in 2008 and 2009, this is a significant downward adjustment in inflation expectations.
Market Influences
To identify additional forces influencing the farmland market, survey respondents were asked to assess the influence of 11 different items. These items included:
1. Current net farm income
2. Expected growth in returns to land
3. Crop price level and outlook
4. Livestock price level and outlook
5. Current & expected interest rates
6. Returns on competing investments
7. Outlook for U.S. agricultural export sales
8. U.S. inflation/deflation rate
9. Current inventory of land for sale
10. Current cash liquidity of buyers
11. Current U.S. agricultural policy
Respondents used a scale from ‑5 to +5 to indicate the effect of each item on farmland values. A negative influence is given a value from ‑1 to ‑5, with a ‑5 representing the strongest negative influence. A positive influence is indicated by assigning a value between 1 and 5 to the item, with 5 representing the strongest. An average for each item was calculated.
In order to provide a perspective on the changes in these influences, data from 2007, 2008, and 2009 are presented in Figure 4. The horizontal axis of the chart indicates the item from the list above. This year the influences are similar to those in 2009. For some influences, there is a sharp contrast between 2009 and 2010 and 2008. In 2008, the major positive influences included current net farm income, expected growth rate in return to land, and crop price level and outlook. This year these items are still positive influences, but they have a much smaller positive influence. All the influences except livestock prices are positive in 2010 and the negative influence of livestock prices was much less than in 2009. Current net farm income, interest rates, the return of competing investments, and the supply of farmland are the strongest influences in 2010.
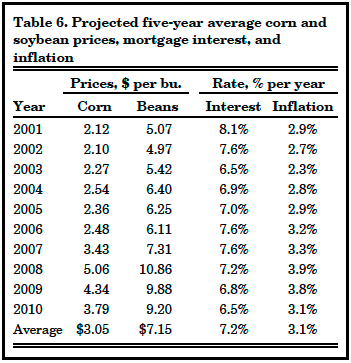
Table 6. Projected five-year average corn and soybean prices, mortgage interest, and inflation
Expected Future Land Values
Expectations about corn and soybean prices, net income, and the other influences impacting the land market indicate a softening of farmland values. On a state‑wide basis, Table 1 indicates that for the six‑month period from June to December 2010, survey respondents expect farmland values to soften, declining 0.1 to 0.3%. The regional averages indicate that survey respondents in all regions are expecting farmland values to remain steady to slightly down. The largest average anticipated reduction is 1.5% for average land in the North region. The largest average increase is 1.2% for poor land in the Southeast region. Most of the expected chances in value over the next six months are expected to be less than 1%.
Respondents also projected farmland values five years from now. Sixty‑three percent of the respondents expect farmland values to be higher. The average increase for this group was 9.6%. This translates into an average annual increase of 1.9%. Twelve percent expect farmland values to decline. The average decline for this group was 11.9%. Combining all responses provided an expected total increase in farmland value for the next five years of 4.6%, an increase of 0.9% per year.
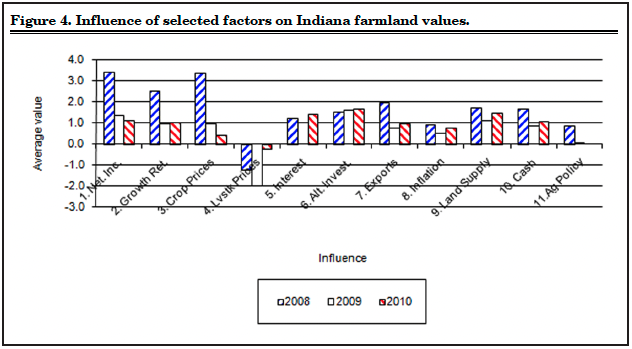
Figure 4. Influence of selected factors on Indiana farmland values.
Pasture Rent, Irrigated Farmland, Established Hay, & Grain Storage Rent
The information on pasture rent, rental of irrigated farm land, and rental of on‑farm grain storage was updated in this survey. The 2010 averages for pasture rent, the value and cash rent of irrigated farmland, and the rental of on‑farm grain storage are presented in Tables 7, 8, and 10, respectively. The survey this year also included information on the rental rate of established hay ground (Table 9).
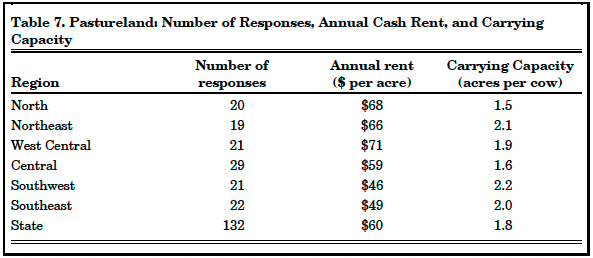
Table 7. Pastureland: Number of Responses, Annual Cash Rent, and Carrying Capacity
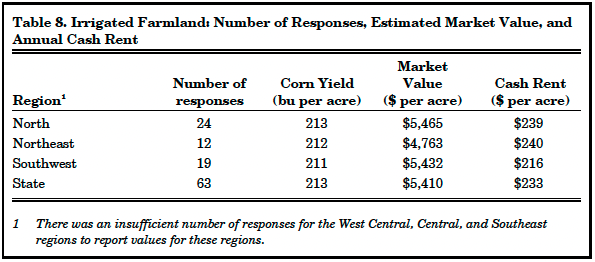
Table 8. Irrigated Farmland: Number of Responses, Estimated Market Value, and Annual Cash Rent
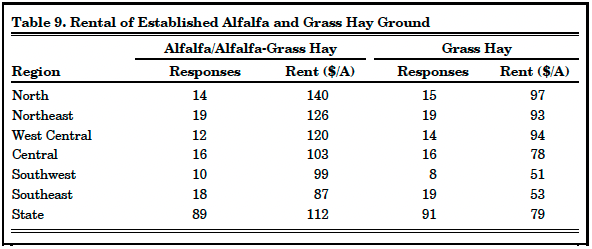
Table 9. Rental of Established Alfalfa and Grass Hay Ground
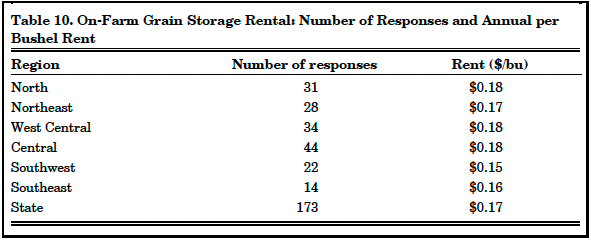
Table 10. On-Farm Grain Storage Rental: Number of Responses and Annual per Bushel Rent
Final Comment
After a slight decline in 2009, the 2010 Purdue Farmland Value and Cash Rent Survey indicates that farmland values quickly rebounded. In 2009, some people were concerned that there might be a significant downward adjustment in farmland values. This did not occur. Instead, farmland values in many areas of the state rose strongly. However, survey participants are expecting little change in average farmland values between now and December 2010. Five years from now 63% of the survey respondents expect farmland values to be higher than they are today, but the respondents expect a much lower annual rate of increase than recent increases. While a majority of the survey respondents expect farmland values to be higher in 5 years, the remaining 37% of the respondents expect values in five years to be the same or less.
There is always uncertainty about the future direction of farmland values. At this time, there does not appear to be a dominant force shaping this market. While current farm income is providing support to the farmland market, the optimistic expectations about crop prices and thus production margins have dissipated. A decline in some input prices offset part of the crop price decline. The decline in input cost helped reduce the decline in crop production margins, but margins are much less than those experienced in 2007 & 2008.
Past periods of above average margins have stimulated increases in production capacity leading to a longer period of tight margins. Economics indicates that if all other things are the same, a reduction in crop production margins will lead to a reduction in the value of land and cash rent. All other things are never the same and thus far there has been no downward adjustment in farmland values or cash rent. Other than expected margins, what other factors need to be watched?
- Long‑term interest rates have ddbeen low and while many people keep expecting them to increase they continue to decline. A dip earlier this summer prompted many home owners to refinance their mortgages. Rising interest rates typically have a negative effect on real estate values.
- Compared to other investments, farmland investments have provided a competitive alternative. An investment in farmland has provided a 3% to 4% annual rental return from operations or cash rent plus a capital gain increase. There is typically less variability in these returns than is found in stock market investments, making farmland an attractive investment. However, for a number of years, the capital gain return has been an increasing proportion of the total return. If people begin to receive smaller capital gain increases, this investment may lose some of its attractiveness.
- Farmland buyers appear to be ddin a strong financial position. This means owners are in a position to hold in a down or highly uncertain market rather than sell.
The 2010 survey indicates the supply of land on the market may be declining, helping to sustain or push prices up.
- The slow economic recovery in ddthe national economy will not provide much nonfarm support to the farmland market and has surely dampened expectations for a period of rampant inflation.
Purdue Land Value and Cash Rent Survey
The Purdue Land Value and Cash Rent Survey is conducted each June. The survey is possible through the cooperation of numerous professionals that are knowledgeable of Indiana’s farmland market. These professionals include farm managers, appraisers, land brokers, agricultural loan officers, Purdue Extension educators, farmers, and persons representing the Farm Credit System, the Farm Service Agency (FSA) county offices, and insurance companies. Their daily work requires that they stay well informed about land values and cash rents in Indiana.
These professionals provide an estimate of the market value for bare poor, average, and top quality farmland in December 2009, June 2010, and the expected value for December 2010. They also provide an estimate of the current cash rent for each land quality. To assess the productivity of the land, respondents provide an estimate of long‑term corn yields. Respondents also provide a market value estimate for land transitioning out of agriculture and recreational land.
Responses from 306 professionals are contained in this year’s survey representing all but five Indiana counties. There were 48 responses from the North region, 60 responses from the Northeast region, 62 responses from the W. Central region, 74 responses from the Central region, 35 responses from the Southwest region, and 27 responses from the Southeast region. Figure 1 illustrates the counties in each region.
Appraisers accounted for 19% of the responses, farm loan professionals represented 60% of the responses, farm managers or farm operators provided 11% of the responses, and other professionals provided 10% of the responses.
The data reported here provide general guidelines regarding farmland values and cash rent. To obtain a more precise value for an individual tract, contact a professional in your area that has a good understanding of the local situation.
We express appreciation to Marsha Slopsema of the Department of Agricultural Economics for her help in conducting the survey.
![]()
![]()
![]()
![]()
![]()
