2006 Indiana Farmland Values Continue to Increase
August 1, 2006
PAER-2006-00
Craig L. Dobbins, Professor; Kim Cook, Research Associate
![]()
![]()
![]()
![]()
![]()
Statewide Land Values
After several years of increasing values, some people wonder if farmland values may have reached their top.
They point to several factors – sharp increases in energy and fertilizer prices used in crop production, continued low crop prices, the high value to cash rent multiple, and more recently, increasing long-term interest rates. Yet, the June 2006 Purdue Land Value Survey found that in most cases farmland values across the state continued to march higher. On a state-wide basis, bare Indiana cropland ranged in value from $2,509 per acre for poor land to $3,770 per acre for top land (Table 1). Average bare Indiana cropland had an estimated value of $3,162 per acre. For the 12-month period ending in June 2006, this was an increase of 6%, 7.4%, and 6%, respectively for poor, average, and top land.
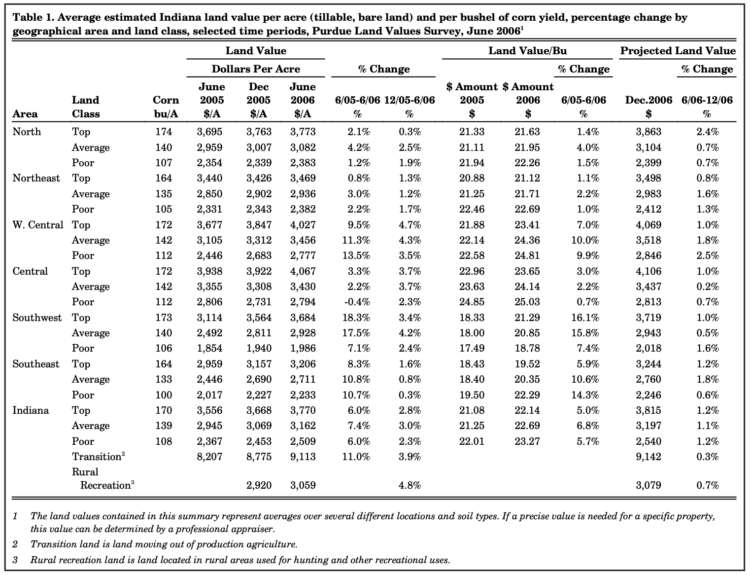
Table 1. Average estimated Indiana land value per acre (tillable, bare land) and per bushel of corn yield, percentage change by geographical area and land class, selected time periods, Purdue Land Values Survey, June 2006
Part of the difference in land values reflects productivity differences. As a measure of productivity, survey respondents provide an estimate of long-term corn yields. The average reported yield was 108, 139, and 170 bushels per acre, respectively for poor, average, and top land. The value per bushel for different land qualities was very similar, ranging from $22.14 to $23.27 per bushel. On a per bushel basis, the most expensive land is the poor land with a value of $23.27 per bushel. Top quality land was the least expensive at $22.14 per bushel.
The average value of transitional land, land moving out of agriculture, increased 11% this year. The average value of transitional land in June 2006 was $9,113 per acre. However, there is a very wide range of values for transitional land – from twice its agricultural value to more than ten times its agricultural value. These values are strongly influenced by what the land is transitioning into and its location. Due to the wide variation in estimates for transitional land, the median value* may give a more meaningful picture than the arithmetic average. The median value of transitional land in June 2006 was $7,750 per acre. In 2005, the median value for transition land was $7,000.
This year for the first time we asked survey respondents to indicate the value of rural recreational land. Rural recreational land is used for hunting and other recreational uses. On a statewide basis, the average value of rural recreational land was $3,059, almost equal to the value of average quality farmland. But as with transitional land, there is a wide range of values for rural recreational land and its value is very sensitive to the location of the tract. The median value for rural recreational land in June was $2,775 per acre.
Statewide Rents
On a statewide basis, cash rents increased $1 per acre (Table 2). The estimated cash rent was $155 per acre on top land, $127 per acre on average land, and $100 per acre on poor land. This was an increase in rental rates of 1% for poor land, 0.8% for average land, and 0.6% for top quality land. The increase from 2005 to 2006 continued the upward trend in cash rent values but it is the smallest percentage increase reported for the past six years. Statewide, rent per bushel of estimated corn yield ranged from $0.91 to $0.93 per bushel.
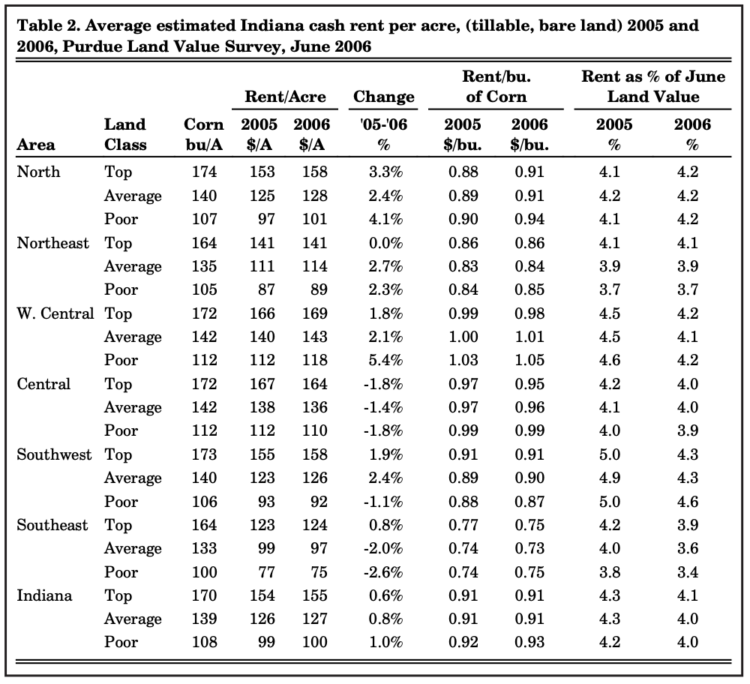
Table 2. Average estimated Indiana cash rent per acre, (tillable, bare land) 2005 and 2006, Purdue Land Value Survey, June 2006
Cash rent as a percentage of value continued to decline. For top quality farmland, cash rent as a percentage of farmland value was 4.1%. For average and poor-quality farmland, cash rent as a percentage of farmland value was 4.0%. Over the 32-year history of the survey, rent as a percentage of farmland value has averaged 6.0%. The values in 2006 are the lowest reported since the Purdue Land Value Survey was started. It is important to remember that the rent used in this calculation is the gross rent. Subtracting ownership expenses such as real estate taxes, maintenance, management, etc. will make the net rate of return even lower.
Area Land Values
Survey responses were organized into six geographic regions of Indiana (Figure 1). As in past years, there are geographic differences in land value changes. This year Southwest, West Central, and Southeast Indiana reported the strongest percentage increases in land value. Bare farmland in these areas was estimated to have increased by 8.3% to 18.3% (Table 1). The increase in estimated values in the other regions were more modest. The survey indicated a slight decline in value for poor quality land in the Central region.
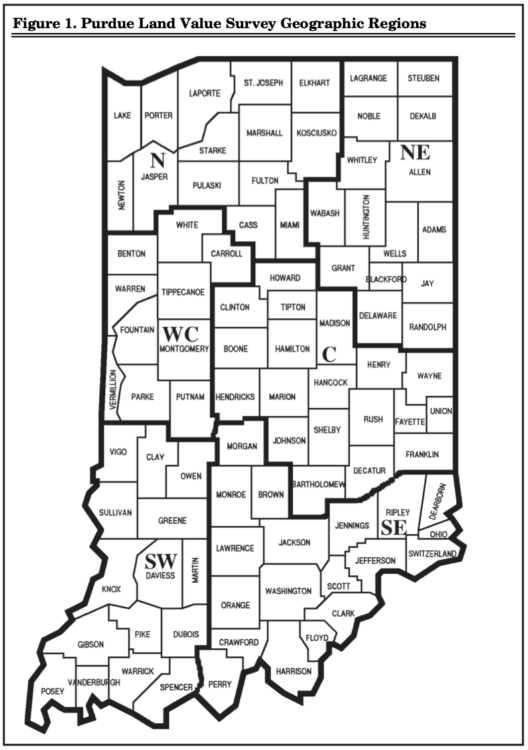
Figure 1. Purdue Land Value Survey Geographic Regions
Bare farmland values have consistently been the highest in the Central region. This year, values in West Central and Central Indiana are very similar. While the Central Indiana top- and poor-quality farm- land values are slightly higher than those in West Central Indiana, average quality land values are slightly larger in West Central Indiana than in Central Indiana. Land value per bushel of estimated long-term corn yield (land value divided by bushels) is the highest in the Central and West Central region, ranging from $23.41 to $25.03 per bushel. This was followed by the North and Northeast with values ranging from $21.12 to $22.69. The Southwest and Southeast had land values per bushel ranging from $18.78 to $22.29 per bushel.
Area Cash Rents
All areas of the state except Central Indiana reported an increase in cash rent for at least some land qualities (Table 2). In Central Indiana, cash rents were reported to have declined by 1.4% to 1.8% Across the three land qualities the strongest percent- age increase was in the North region. Increases in this region were 2.4% to 4.1%. Cash rents are the highest in the West Central region, followed by the Central region. Cash rent per bushel in West Central Indiana ranges in value from $0.98 to $1.05. In the Central region, these values ranged from $0.95 to $0.99 per bushel. The per bushel rents in these two regions are the highest in the state. The next highest per bushel rent was in the North and Southwest, ranging from $0.87 to $0.94. Per bushel rents in the Northeast ranged from $0.84 to $0.86. The lowest per bushel cash rents were $0.73 to $0.75, reported for the Southeast.
Rural Home Sites
Respondents were asked to estimate the value of rural home sites with no accessible gas line or city utilities and located on a black top or well-maintained gravel road. The median value for five-acre home sites ranged from $5,000 to $10,000 per acre (Table 3). Estimated per acre median values of the larger tracts (10 acres) ranged from $6,000 to $10,000 per acre.
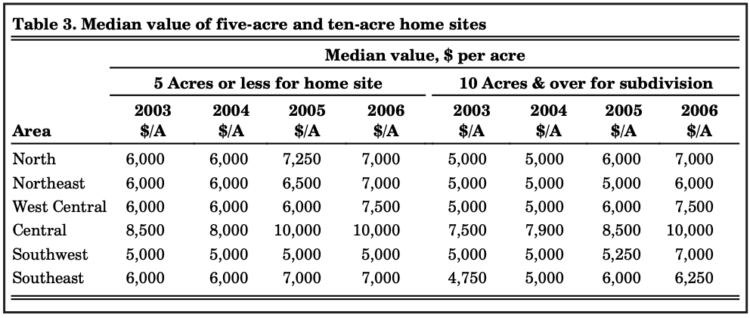
Table 3. Median value of five-acre and ten-acre home sites
Farmland Supply & Demand
To assess the supply of land on the market, respondents were asked to provide their opinion of the amount of farmland on the market now compared to a year earlier. The respondents indicated either more, the same, or less land was on the market than one year ago. Only 18.6% of the 2006 respondents indicated more land was on the market now compared to year-ago levels (Figure 2). The remaining 81.4% of the respondents indicated the amount of land on the market at the current time was the same or less than a year ago. Compared to 2004 and 2005, more respondents indicated that there was more or the same amount of land on the market.
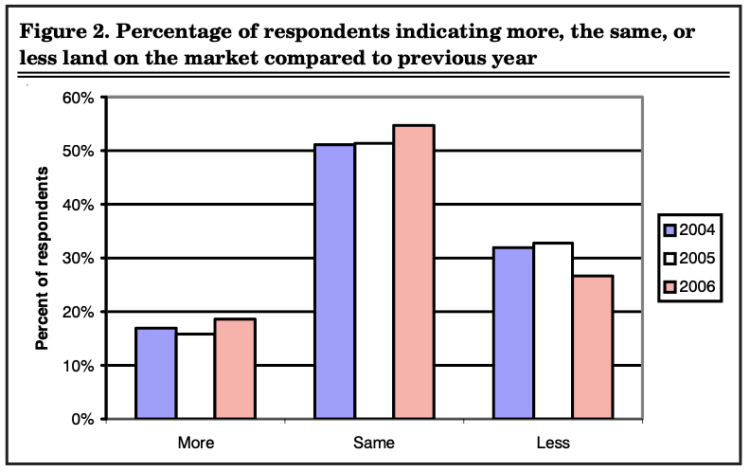
Figure 2. Percentage of respondents indicating more, the same, or less land on the market compared to the previous year
A smaller number of the respondents indicated that there was less land on the market than the previous year. While this might indicate a little more farmland on the market, the quantity of land for sale remains limited.
Respondents were also asked to indicate if interest in a farmland purchase by farmers, rural residents, or non-farm investors had increased, decreased, or remained the same compared to a year earlier. A total of 44.5% of the respondents indicated increased farmer interest (Figure 3). The number of respondents indicating an increased interest from farmers has declined steadily since 2004. Forty-nine percent of the respondents indicated that farmer interest remained the same. Respondents indicating a decline in farmer interest increased to 6.6%.
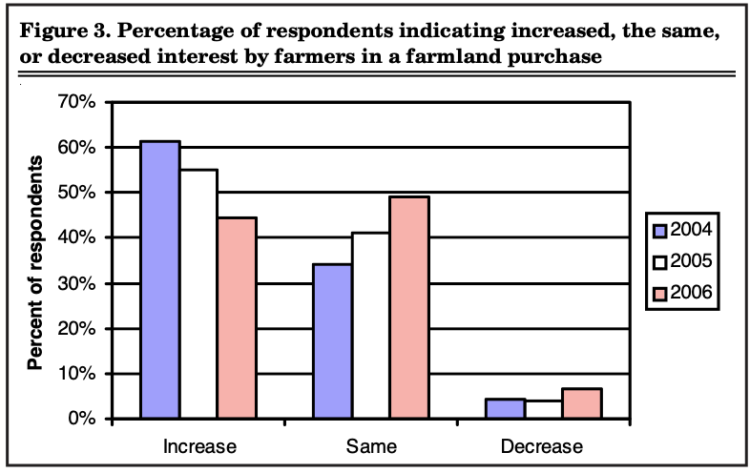
Figure 3. Percentage of respondents indicating increased, the same, or decreased interest by farmers in a farmland purchase
The demand for land for rural homes continues to be strong. Sixty-six percent of the respondents indicated an increase in demand for rural residences. Thirty-one percent indicated that demand for rural residences remained the same. Less than four percent of the respondents indicated a decline in the demand for rural residences. These responses are similar to those of past years.
The stock market has shown some recovery from its decline in 2002 but continues to be highly volatile. In addition, interest rates have increased providing increased competition for investor?s dollars. Demand for farmland from nonfarm investors seeking good investment opportunities does not appear to be as strong as in the past. This year 41.2% of the respondents indicated an increase in farmland demand from individual investors. This was nearly a 10% reduction from the previous two years (Figure 4). This is the first time in four years that less than 50% of the respondents indicated increased interest from nonfarm investors. The number of respondents indicating the same or a decrease in demand from nonfarm investors increased.
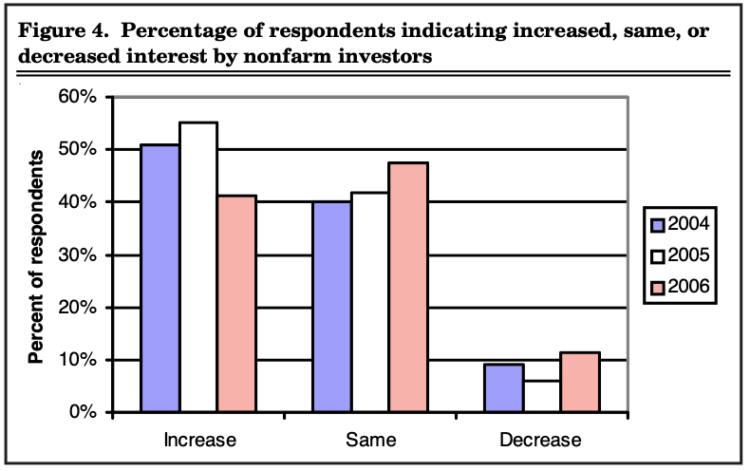
Figure 4. Percentage of respondents indicating increased, the same, or decreased interest by nonfarm investors
Expected Grain Prices, Interest Rates, & Inflation
Making a farmland purchase is a long-term commitment. As a result, expectations regarding crop prices over the next few years can have a strong influence on farmland values. In order to gain insight into crop price expectations, respondents were asked to estimate the annual average on-farm price of corn and soybeans for the period 2006 to 2010. This year saw an increase in the expected five-year average price of corn but a decrease in the expected five-year price of soybeans (Table 4). Average five year expected corn price increased $0.12 per bushel to $2.48. However, this was still below the price of $2.54 that was expected in 2004. The average price for soybeans decreased $0.14 to $6.11.
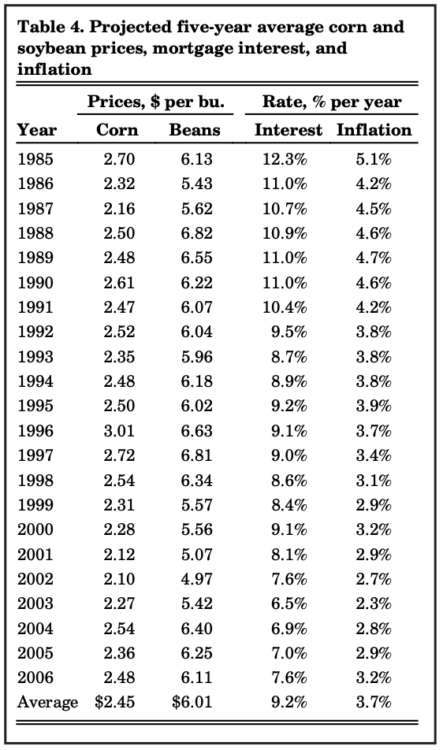
Table 4. Projected five-year average corn and soybean prices, mortgage interest, and inflation
Increasing long-term interest rates have been a topic of discussion for a number of years. The respondents expected interest rate has been increasing for the last three years. This year?s survey reported an increase to 7.6%. This is the highest expected interest rate since 2002 but is still low relative to historical expectations.
Survey respondents are also expecting the inflation rate over the next five years to be higher. The average expected rate of inflation in the 2006 survey is 3.2%. Expected inflation rates have not been this high since 1998 to 2000.
Expected Future Land Values
Another important expectation that influences current farmland price is the expected future change in farmland values. Table 1 indicates that for the six-month period from June to December 2006, survey respondents expect values to continue to increase. On a statewide basis this increase is expected to range from 1.1% to 1.2%, a fairly modest increase. The expected change in farmland values for each region is similar to the statewide average. If these expectations are realized, they indicate a slowing in the rate of increase.
Respondents were also asked to project farmland values five years from now. Seventy percent of the respondents expect farmland values to be higher, 16% of the respondents expect farmland values to be the same, and 14% expect farmland values to be lower. For those expect- ing land values to increase, the average expected increase for the period was 10.8%. For those expecting land values to decline over the next five years, the average decline was 10.3%. Combining all estimated expected change responses provided an expected total increase in farmland values over five years of 2.5%. Again, these expectations indicate a significant slowing of the change in farm- land values. It appears that many of the survey respondents are expecting farmland values to plateau for the next few years.
Market Influences
To obtain a more comprehensive assessment of the relative strength that various influences exert on farmland values, survey respondents were asked to assess the influence of 11 different items on farmland values. These items included:
-
- Current net farm income,
- Expected growth in returns,
- Crop prices and outlook,
- Livestock prices and outlook,
- Current and expected interest rates,
- Returns on competing investments,
- U.S. agricultural export sales,
- U.S. inflation/deflation rate,
- Current inventory of land for sale,
- Current cash liquidity of buyers, and
- Current U.S. agricultural policy.
Respondents were asked to use a scale from -5 to +5 to indicate the effect of each on farmland values. If the item had a major negative influence, it would be given a -5. A positive influence was indicated by assigning a positive weight between 1 and 5 to the item. An average for each item was calculated. In order to provide a perspective on the changes in these influences, data from 2004, 2005 and 2006 are presented in Figure 5. The horizontal axis of the chart indicates the influence in the above list.
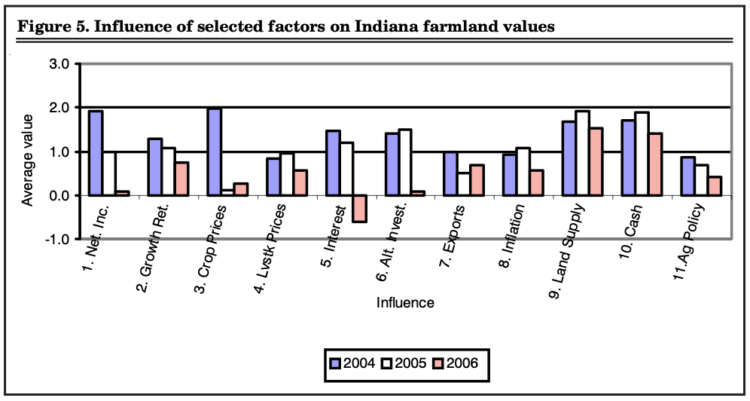
Figure 5. Influence of selected factors on Indiana farmland values
In 2004 and 2005, all factors were positive. In 2006, the positive influence of all factors declined. Interest rates became a negative influence in the market. The factors given the most positive influence in 2006 were the current inventory of land for sale (9) and the current cash liquidity of buyers (10). These were both important influences in 2004 & 2005. The availability of farmland for sale was discussed previously. As in the past, the liquidity of buyers continues to be enhanced through the use of the 1031 or tax-free exchanges. Section 1031 of the IRS regulations provides a process by which sellers of real estate can reinvest the revenue back into real estate without paying capital gains tax. This is often advantageous to individuals selling farmland for development. Comments from survey respondents also indicate that in certain regions of the state, the cash liquidity of Amish buyers is also having an influence on local markets.
Over this three year period the most notable changes in market influences is the reduction in the positive influence of current net farm income, crop prices, the influence of alternative investments and the influence of interest rates. The influence of current farm pro- gram is also viewed as declining in importance.
Final Comment
The Purdue Farmland Value and Cash Rent Survey indicates that over the past year Indiana farmland values and cash rents continued to move higher. The limited supply of land for sale or rent combined with strong demand for farm expansion, country residences, and non-farm development provide strength to Indian’s farmland market.
Land values continue to increase more rapidly than rents. This means that the market is willing to capitalize current income, rent, into farmland values at a lower rate of return**. The rent to value percentage can be used as an estimate of the capitalization rate. As noted earlier, this value is at a historic low. What reasons might there be for why the market is willing to capitalize current income at such a low rate?
One possible reason is that long-term interest rates are historically low. Competing investments have lower rates of return, thus the rate of return required for a farmland investment is also lower.
Another may be that market participants have concluded that there is less risk in owning a farmland investment than in the past. Government programs and crop insurance may have reduced the risk premium required to get people to own farmland. This would lower the capitalization rate that market participants require.
Finally, market participants may be anticipating more of the expected total return in the form of increased value. If a total return of 10% is expected on an investment in farmland and 4% is obtained from the annual rent, there needs to be a 6% growth in farmland values. Since 1990, the increase in value for average quality farmland averaged 6.1% per year. What does an annual 6% increase in farmland values mean for future values? It means that in five years average quality farmland in Indiana will increase 34% or have a value of $4,231. In ten years, average quality farmland in Indiana will increase 79% or have a value of $5,663.
Will a 6% rate of increase in farmland values be achieved in the future? The survey provides some indicators that the farmland market may be cooling. Sharp increases in fertilizer and energy prices, increased interest rates combined with stable corn and soybean prices seem to have slowed the increase in cash rents. Over time, this may also slow the increase in farmland values. Higher interest rates may act to reduce the development demand, an important factor in the Indiana farmland market, and also provide more attractive alternative investments. This will likely increase the capitalization rate required for farmland.
There is the hope that biofuels will lift corn and soybean prices thereby providing better returns to crop production. Over time, some portion of these better returns will be bid into farmland values. Such a scenario could help to lift farmland values. However, part of this hope may already be reflected in current farmland values.
The survey provides a broad look at Indiana’s farmland market. Values have continued to move higher and it is expected that this trend will continue, but there is increased uncertainty associated with the farmland market. It is important to recognize that each local market and each individual farm has its own factors that make it unique. The increased uncertainty also makes it important to carefully watch for factors that could derail the upward trend in farmland values. The possibility of continued high fertilizer and energy prices, increasing long-term interest rates, changes in government programs, and maybe even climate changes need to be accounted for when making a decision about buying, selling, or renting farmland.
For each average in the report, there is a distribution of values around the average. Some tracts are more valuable than the average, but other tracts are less valuable than the average. If one is considering the sale of farmland, it is recommended that an appraisal be obtained to better establish the value of a specific tract. If a new rental is being made, budgeting through the expected return under alternative yields, commodity prices, and production costs is always prudent.
** Income capitalization is a common method used to estimate the value of farmland. This approach to estimating farmland value divides an estimate
of annual income by the capitalization rate. If estimated income (rent) is $127 per acre and the capitalization rate (rent ÷ value) is 4%, this provides an estimated value of $3,175 per acre.
Pasture Rent, Irrigated Farmland, & Grain Storage Rent
Occasionally we included extra questions in our survey to obtain information about a particular topic. This year, we asked about pasture rent, the value and cash rent of irrigated farmland, and the rental of on-farm grain storage.
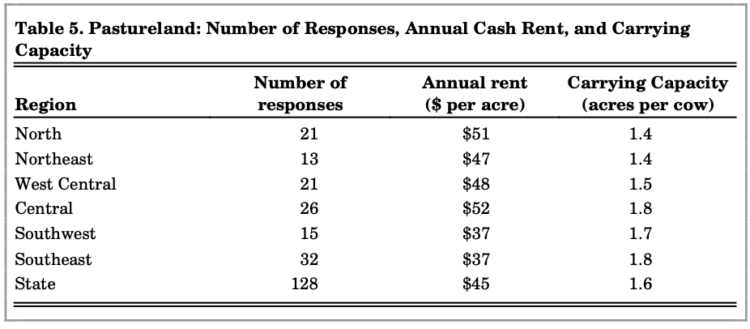
Table 5. Pastureland: Number of Responses, Annual Cash Rent, and Carrying Capacity
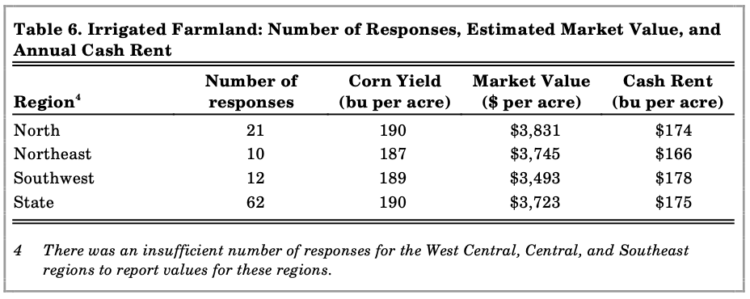
Table 6. Irrigated Farmland: Number of Responses, Estimated Market Value, and Annual Cash Rent
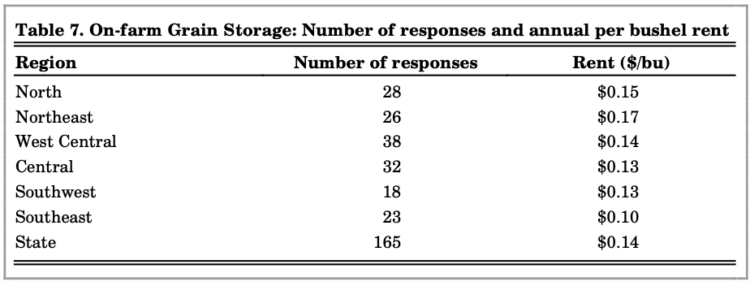
Table 7. On-farm Grain Storage: Number of responses and annual per bushel rent
Purdue Land Value and Cash Rent Survey
The Purdue Land Value and Cash Rent Survey is conducted each June. The survey was made possible through the cooperation of numerous professionals that are knowledgeable of Indiana?s farmland market. These professionals include farm managers, appraisers, land brokers, bankers, Purdue Extension educators, farmers, and persons representing the Farm Credit System, the Farm Service Agency (FSA) county offices, and in insurance companies. Their daily work requires that they stay well informed about land values and cash rents in Indiana.
These professionals are asked to provide an estimate of the market value for poor, average, and top quality farmland in December 2005, June 2006, and the expected value for December 2006. They are also asked to provide an estimate of the current cash rent for each land quality. To assess the productivity of the land, respondents provide an estimate of long term corn yields. Respondents are also asked to provide a market value estimate for land transitioning out of agriculture.
Responses from 313 professionals are contained in this year’s survey representing all but three Indiana counties. There were 51 responses from the North region, 52 responses from the Northeast region, 69 responses from the W. Central region, 70 responses from the Central region, 33 responses from the Southwest region, and 38 responses from the Southeast region. Figure 1 illustrates the counties in each region.
Appraisers accounted for 14% of the responses, farm loan professionals represented 58% of the responses, farm managers or farm operators provided 14% of the responses, and other professionals provided 14% of the responses.
The data reported here provide general guidelines regarding farm- land values and cash rent. To obtain a more precise value for an individual tract, contact a professional rural appraiser or other professionals in your area that have a good under- standing of the local situation.
We express appreciation to Carolyn Hunst of the Department of Agricultural Economics for her help in conducting the survey.
Thanks to Professor Chris Hurt, Department of Agricultural Economics, Purdue University and Professional Appraiser, Jay Luse, Frankfort, Indiana, for valuable suggestions to improve the discussion.
![]()
![]()
![]()
![]()
![]()
