Indiana Farmland Values Increase But Signal Concern of Potential COVID-19 Slump
July 23, 2020
PAER-2020-08
Authors: Todd Kuethe, Associate Professor, Schrader Endowed Chair in Farmland Economics and Craig Dobbins, Professor
![]()
![]()
![]()
![]()
![]()
The COVID-19 pandemic will be the defining economic event of 2020. As documented in the previous Purdue Agricultural Economics Report, the pandemic has had a profound impact on the Indiana food and agriculture sector. Land is the farm sector’s largest input, and as a result, farmland values generally reflect broad trends in the costs and returns of agricultural production. The 2020 Purdue Land Values and Cash Rents Survey suggests that farmland prices across the State generally improved on a year-to-year basis. However, the survey suggests that these gains primarily occurred between June and December 2019, and since December, farmland prices have declined modestly. Survey respondents expect these recent declines to continue throughout the remainder of 2020 and expressed concern over the long-run impacts of COVID-19 on Indiana farmland markets.
One survey respondent stated, “Fear of long-term COVID-19 market impacts are real among Southeast Indiana farmers. Despite good economic conditions prior to March 2020, with other factors (trade, policy, etc.), there is little optimism.” However, at least one respondent reported “land prices high during this COVID-19 pandemic, at levels not seen for several years, which was not expected.” While another stated that “sales in March were higher than we expected them to be, but due to the pandemic, we feel like they have decreased to levels similar to last year.”
Statewide, the strongest year-to-year increase was for poor quality land which increased by 6.3% to $5,746 (Table 1). Top quality land increased by 4.5% to $8,579, and average quality land increased by 3.2% to $7,236. The year-to-year increases were driven by positive price movements between June and December 2019. Over this period, top, average, and poor quality farmland values increased by 5.5%, 5.0%, and 8.7%, respectively. However, between December 2019 and June 2020, top, average, and poor quality farmland values posted modest declines of 1.0%, 1.7%, and 2.2%, respectively.
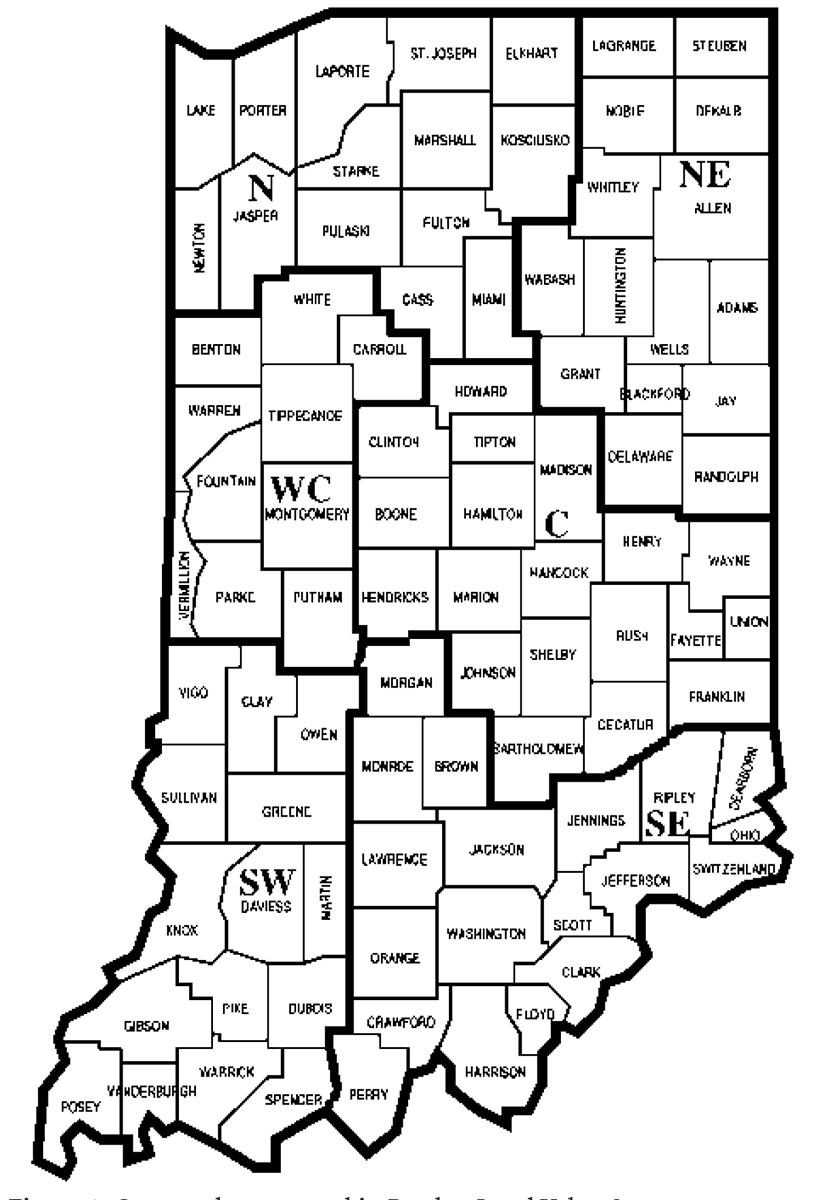
Figure 1. County clusters used in Purdue Land Value Survey to create geographic regions
The survey responses were also divided into six regions to examine locational differences (Figure 1). The pattern of rising values in the second half of 2019 and then falling values during the first half of 2020 was consistent across almost all regions and land quality classes. The only exception was found for average quality land in the North region, where prices also declined during the second half of 2019. While statewide values exhibited a year-over-year net gain, in two instances the 2020 declines outpaced the gains at the end of 2019: poor quality land in the North region and average quality land in the Central region. Thus, year-to-year change between 2019 and 2020 were negative in three cases, two of which were in the North region.
Consistent with historical experience, the highest per acre farmland values were in the West Central region. Top, average, and poor quality farmland values in the West Central region were $9,308, $8,121, and $6,707 per acre, respectively. The least expensive farmland continues to be in the Southeast region with top, average, and poor quality land having values of $6,069, $4,884, and $3,653 per acre, respectively.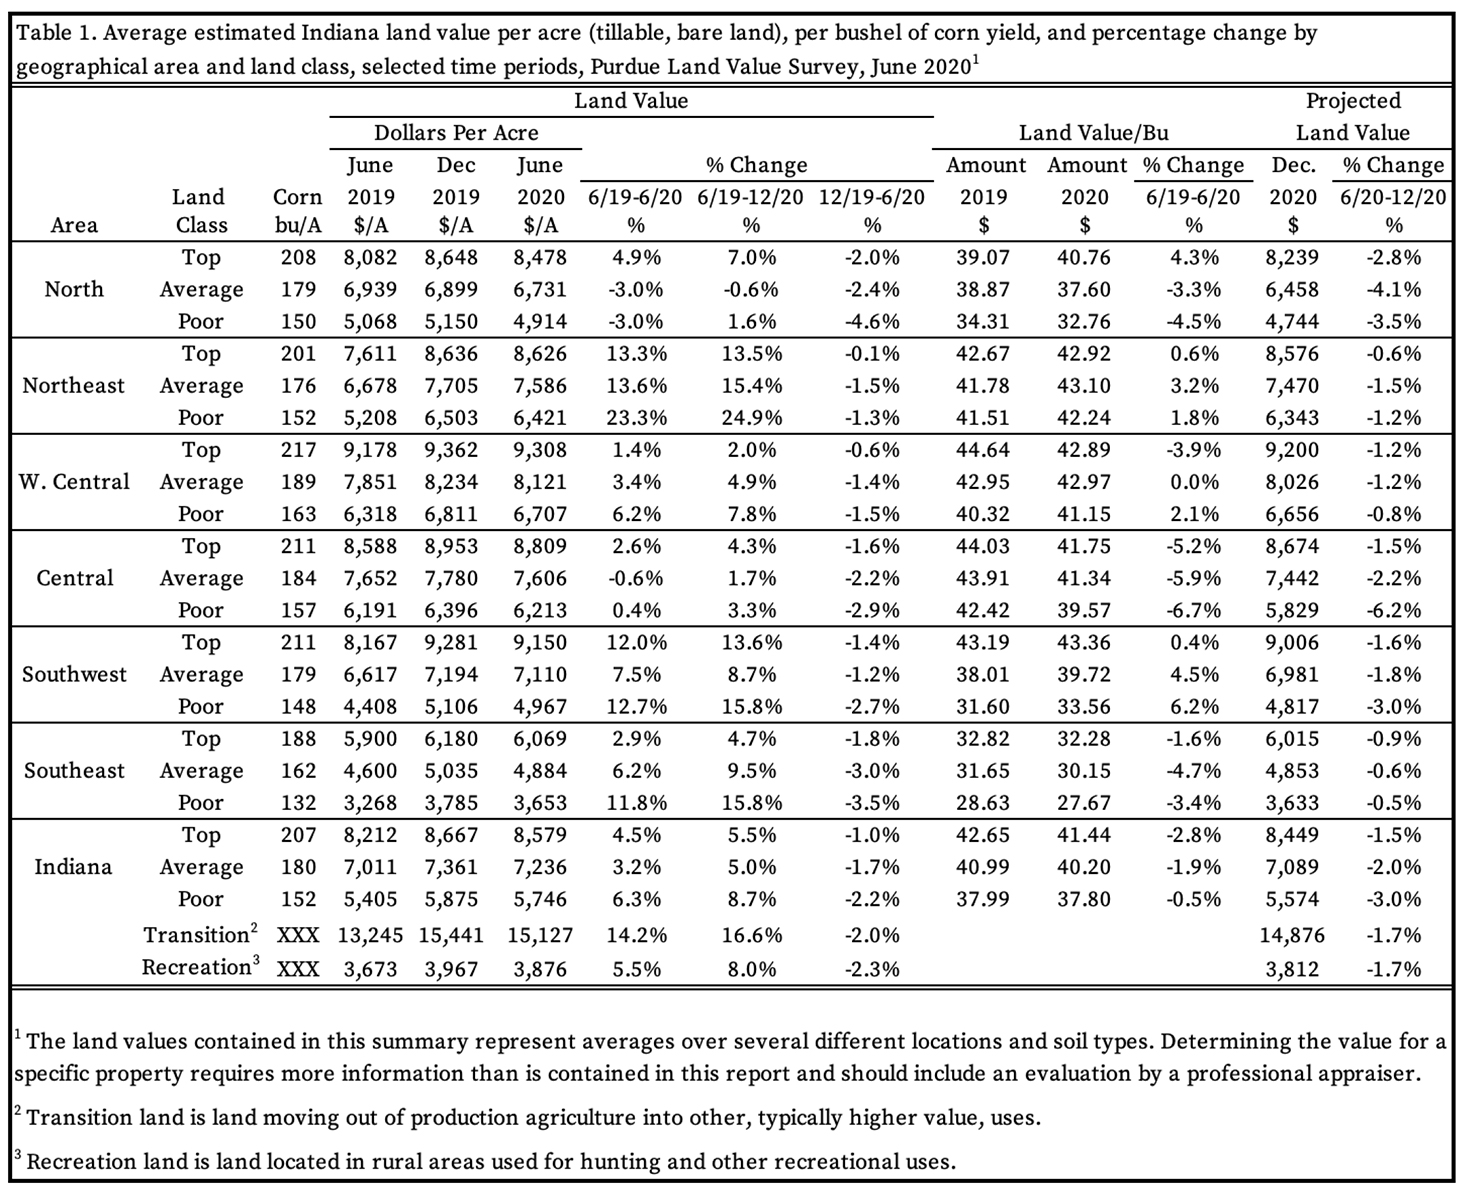
In addition, Table 1 reports the average per acre farmland value divided by respondents’ long-term corn yield estimate. This measure captures the value or cost of farmland per unit of productivity (per bushel of corn). Based on this measure of cost, the highest price farmland is top quality farmland in the Southwest region at $43.36 per bushel. This was closely followed by the Northeast region, where price per bushel ranged from $42.24 to $43.10 per bushel.
To gauge expectations for the remainder of 2020, respondents provide farmland projections for December 2020. Respondents appear to generally expect the declines of the first half of the year to continue at a modest pace. Statewide land values are expected to recede by 1.5%, 2.0%, and 3.0% for top, average, and poor quality land, respectively. At a regional level, the most pronounced expected declines include average quality land in the North region (-4.1%) and poor quality land in the North (-3.5%), Central (-6.2%), and Southwest (-3.0%) regions.
An important influence on farm real estate markets is the transition of farmland to nonagricultural commercial or residential uses. For example, one 2020 respondent noted that local farmland prices were supported by “huge increases in 1031” exchange funds. As a result, the survey collects information about the price of land moving out of agricultural production. The statewide average value of transitional land was $15,127 per acre, a 14.2% increase from the previous June. Recreational land values also increased from $3,673 per acre in June 2019 to $3,876 per acre in June 2020, an increase of 5.5%. Like farmland, transitional and recreational land values increased between June and December 2019 and declined between December 2019 and June 2020.
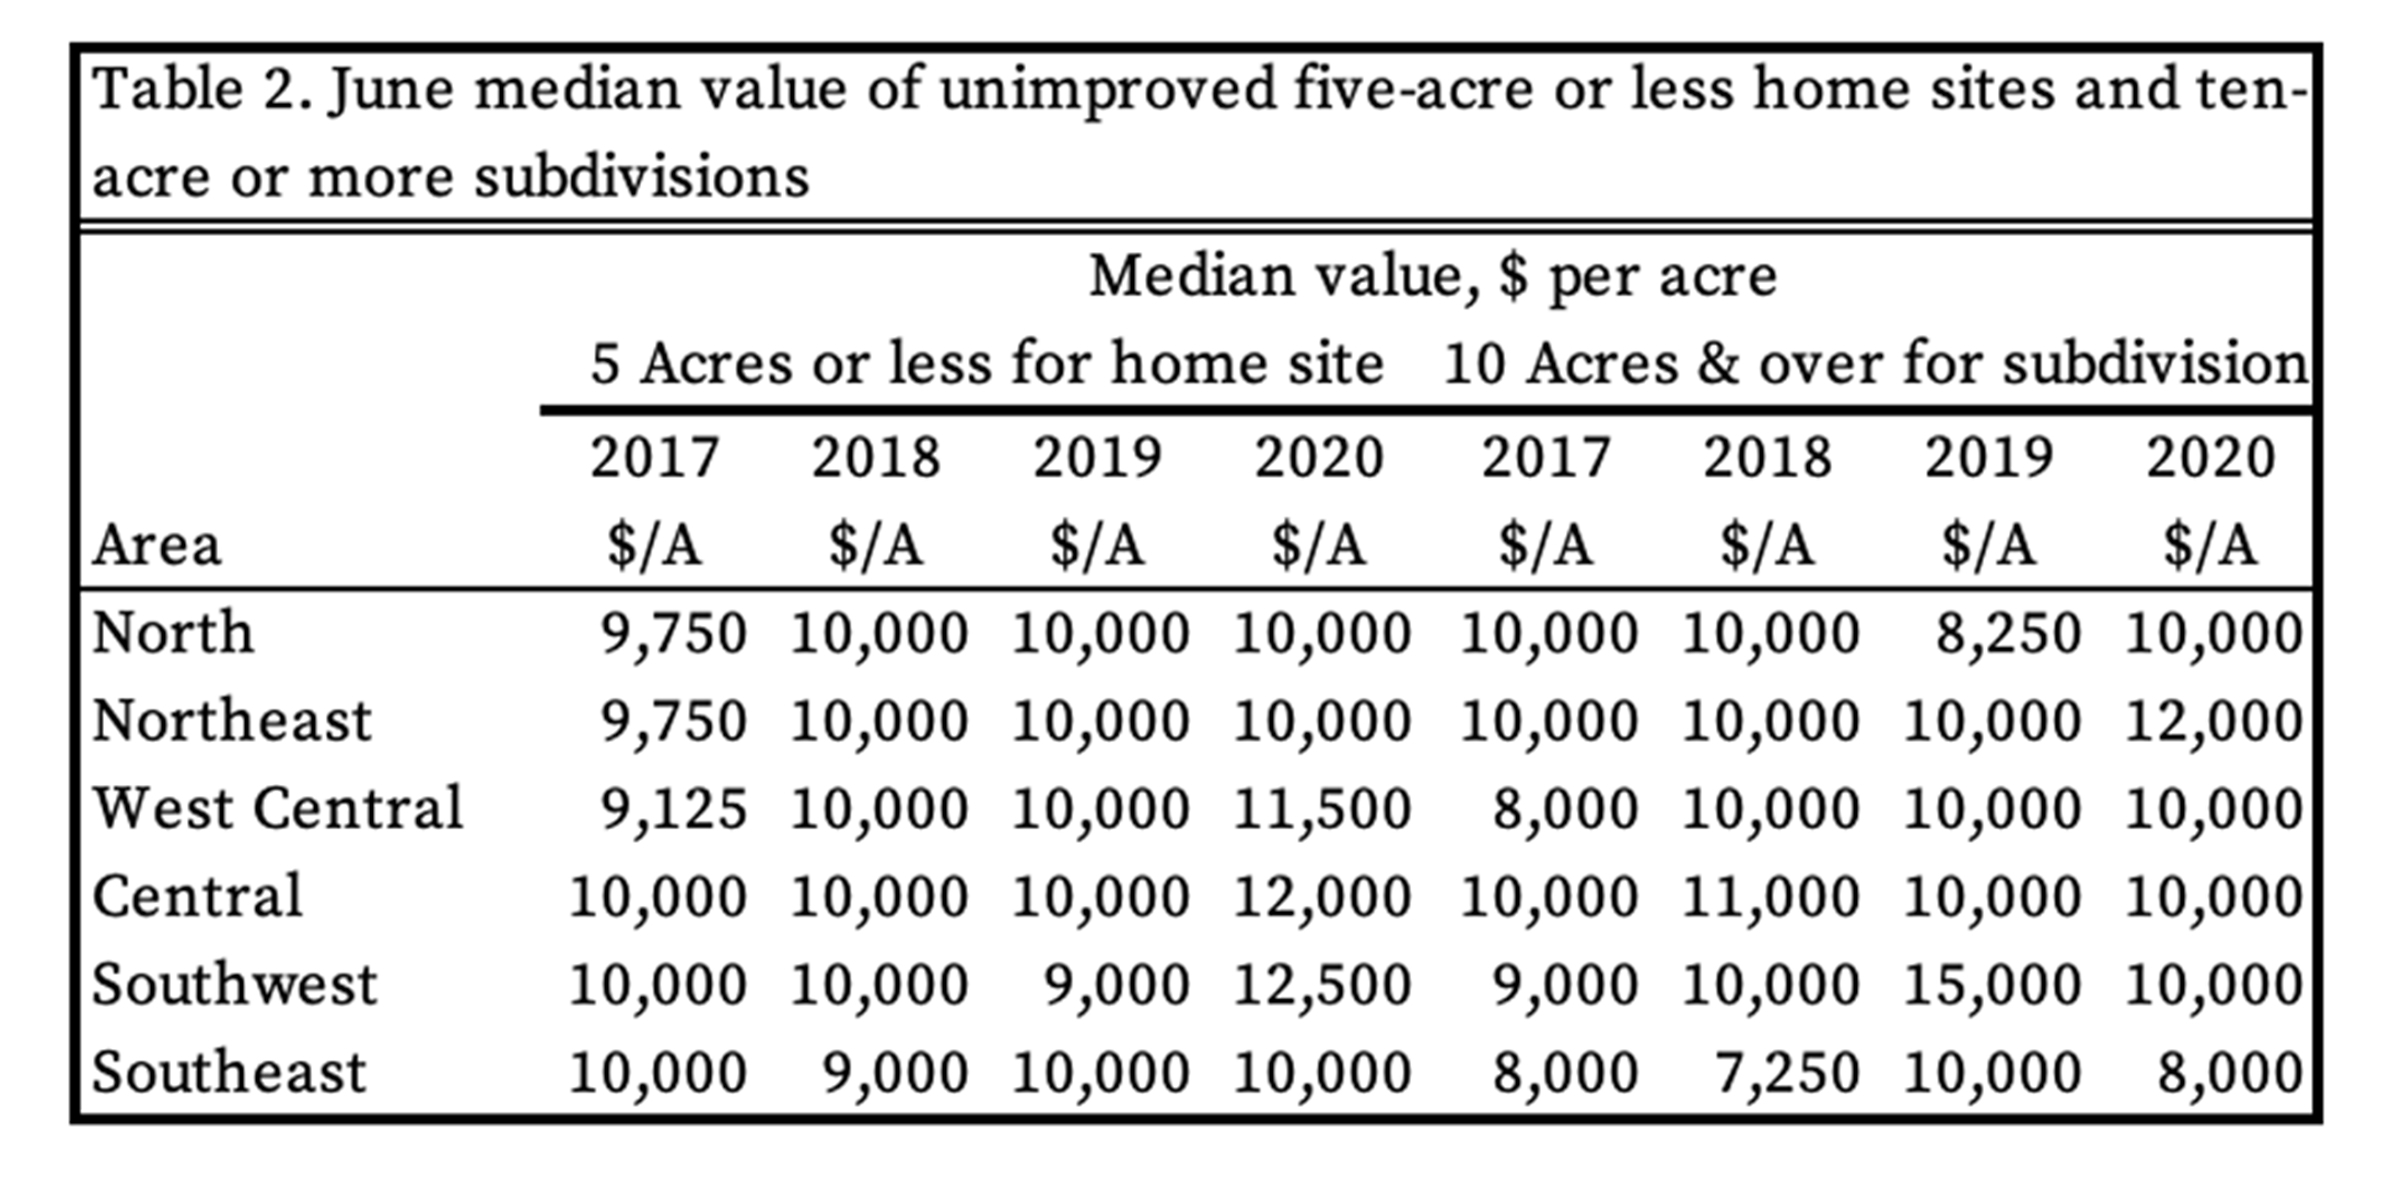
The survey also collects information on the value of farmland moving into rural residences and subdivisions. Respondents provide estimates of the value of rural home sites located on a blacktop or well-maintained gravel road with no accessible gas line or city utilities. These markets are characterized by a very wide range of values. As a result, results are summarized by median values (the value dividing a series of ordered numbers in half ). As shown in Table 2, the median value for five-acre home sites was $10,000 per acre for North, Northeast, and Southeast regions. The median values were a bit higher in the West Central ($11,500), Central ($12,000), and Southwest ($12,500) regions. The median value of $10,000 per acre also holds for ten-acre home sites in all regions except Northeast ($12,000) and Southeast ($8,000).
Farmland Market Forces
Respondents were asked to evaluate the importance of ten market forces that may potentially influence the farmland market. These forces include: (1) current net farm income, (2) expected growth rate in farm returns, (3) crop price level and outlook, (4) livestock price level and outlook, (5) current and expected interest rates, (6) returns to alternative investments, (7) outlook for U.S. agricultural export sales, (8) U.S. inflation rate, (9) cash liquidity of buyers, and (10) current U.S. agricultural policy.
Respondents rate each market force on a scale of -5 to +5 to indicate the effect of each item on farmland values. A negative influence is given a value from -1 to -5, with -5 being the strongest negative influence. A positive influence is given a value of between 1 and 5, with 5 representing the strongest positive influence. A score of zero indicates the item was not an influence in the market. An average for each item was calculated. The averages for 2018, 2019, and 2020 are included in Figure 2. The horizontal axis shows the item from the list above.
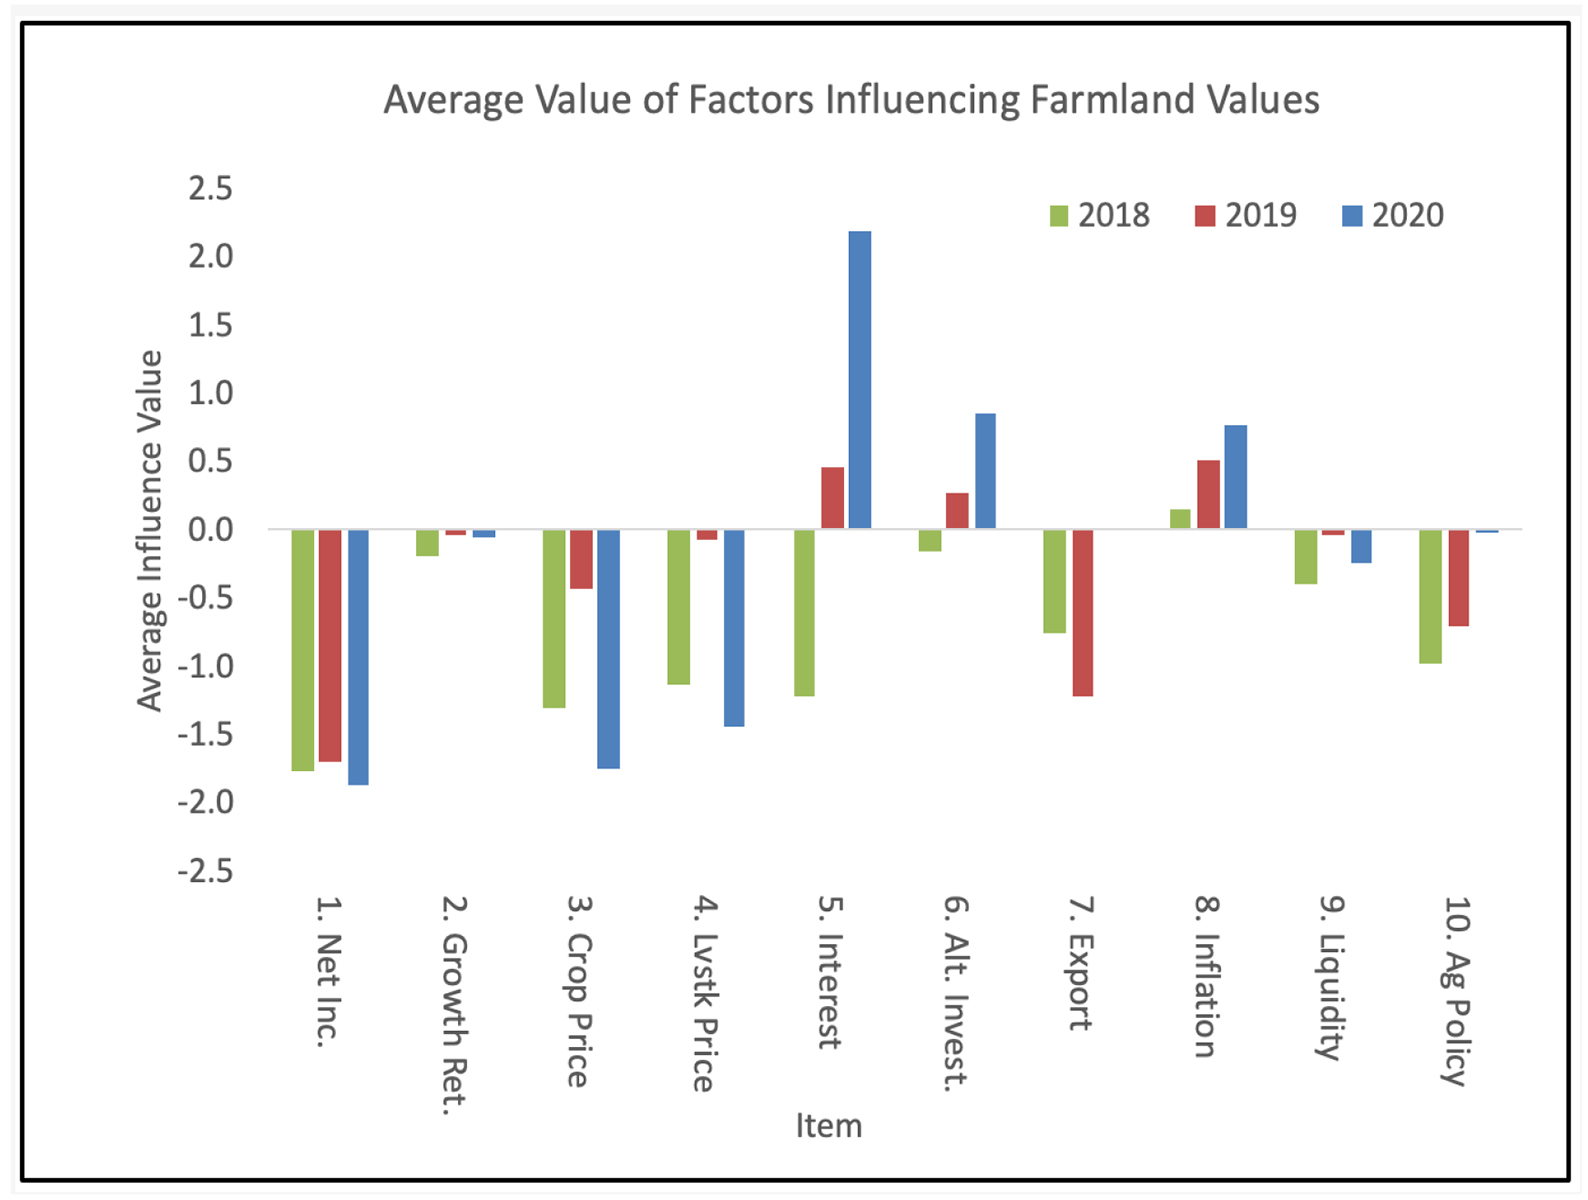
Figure 2. Influence of drivers of Indiana farmland values.
For 2020, there are three positive influences: interest rates, returns from alternative investments, and inflation. Each of these factors were also positive in 2019, yet the results suggest that they have increased in importance. The most notable positive influence is current and expected interest rates. For example, one respondent strongly stated, “At this point in time, the price of corn is immaterial, it’s all about interest rates.” Since June 2019, the Federal Reserve’s Open Market Committee reduced the Federal Funds (overnight deposit) rate several times. These rate cuts include the emergency measures to limit the adverse effects of the COVID-19 Pandemic, and current interest rates are once again at historic lows. Low interest rates place positive pressure on farmland values by reducing the cost of potential borrowers.
The survey also identifies three negative influences: net farm incomes, crop prices, and livestock prices. In each case, respondents have become more negative as market disruptions and uncertainty place downward pressure on current farmland values.
In recent years, the limited supply of farmland is often credited for the relatively stable farmland prices despite the declines in farm incomes. When asking respondents to compare the amount of farmland on the market this year compared to last year, 55.8% respondents indicated less. This follows the pattern of recent years (Figure 3). Only 7.8% of respondents indicate an increasing supply of farmland on the market relative to 2019. At least one respondent suggests that the continued tightening supply of farmland could be linked to the current COVID-19 pandemic. “As of early June, land auctions in Indiana have not shown any decline in prices, but there has been a decline in sellers willing to put their farms on the market.”

Figure 3. Percentage of respondents indicating less, same, or more farmland on the market than in the previous June
It is also important to note that farmers still appear to be the primary purchasers of farmland. The 2020 survey suggests farmers purchased 65.4% of land sold. Non-farm investors were the next largest purchaser, at 20.1%, followed by developers and institutional investors at 8.1% and 5.3%, respectively.
Five-Year Forecasts
Respondents were asked to forecast the five-year average corn price, soybean price, mortgage rate, inflation rate, and finally the change in farmland value. The price and rate information for the past five years are presented in Table 3.
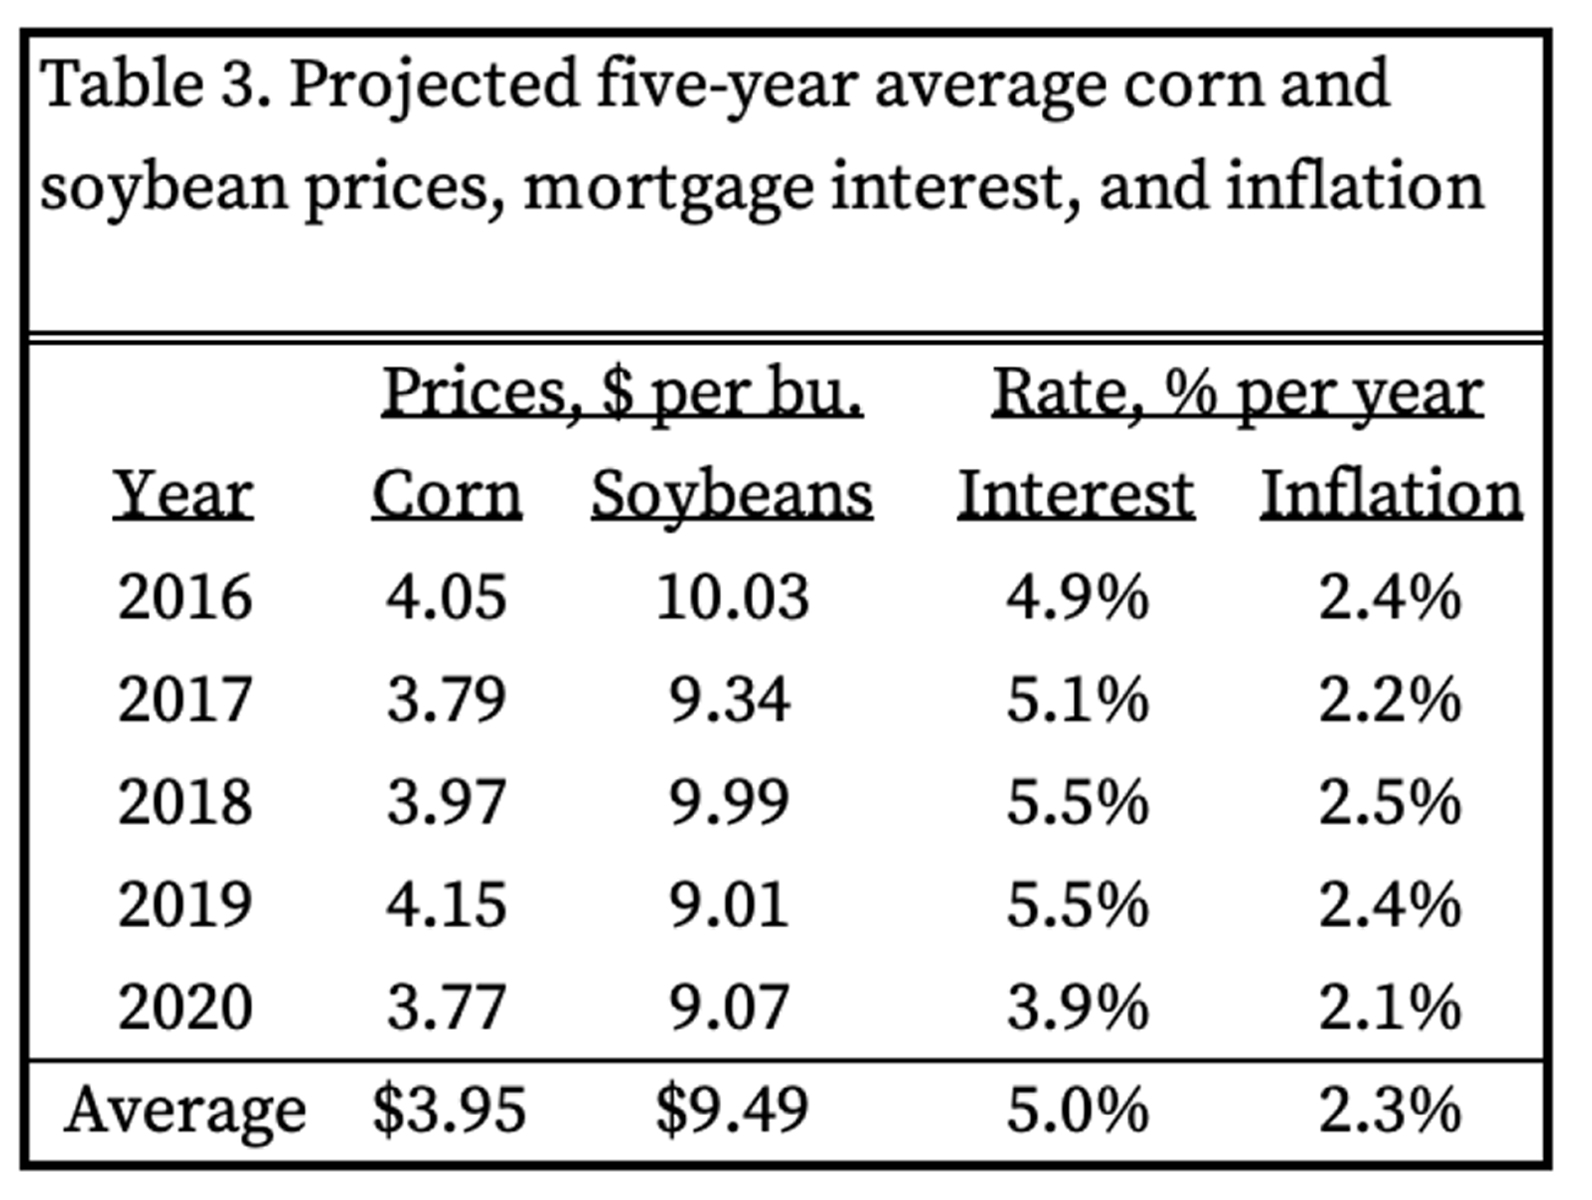
Table 3. Projected five-year average corn and soybean prices, mortgage interest, and inflation
Respondents estimated the five-year per bushel average price of corn to be $3.77. This was a $0.38 decrease from the previous year and lowest price projection of the last five years. The five-year per bushel soybean price was estimated to be $9.07, an increase of $0.06 per bushel. Although prospects are improved from 2019, they remain well below the average of the last five years.
Given the current economic downturn and prospects for a potential recovery, it is not surprising that respondents expect interest rates to decline to 3.9%.
This is the lowest expected rate in the last five years by a wide margin. However, respondents’ expectations for inflation is only slightly lower than previous years at 2.1%.
Where do respondents expect farmland to be in five years given these projections? Not surprisingly, respondents provided a wide range of expectations. The 2020 survey asked respondents to predict the total change in farmland prices between June 2020 and five years from now. The average response was a modest 3.44% increase. This suggests an increase that just outpaces expected inflation, which is consistent with historic farmland growth rates.
Cash Rents
Statewide cash rental rates increased across all land quality classes in 2020. The largest increase was in low quality land which increased by 5.4% to $175 per acre. This was followed by a 4.8% and 4.0% increase in average and top quality land, respectively. The rental rate increases offset the reduction in rents that occurred between 2018 and 2019.
At the regional level, cash rental rates increased across all land qualities and regions, with the exception of low quality land in the North region which fell by 2.9%. Similar to farmland values, the West Central region had the highest cash rental rates for top ($293), average ($252), and poor ($212) quality land. The largest price increases for each quality class were found in the Southwest region. Top quality land increased by 15.5% to $269. Average quality land increased by 19.3% to $216, and poor quality land increased by 20.1% to $161. The West Central region also had the highest cash rental rates in a per bushel of corn basis, ranging from $1.30 to $1.35 per bushel.
Statewide, cash rent as percent of land value remains 3% (Table 4 and Figure 4). This relationship has held relatively constant since the recent peak in farmland values in 2014, following a long decline from 1985 through 2014 (Figure 4). Although the ratio between cash rent and land value varies by region and land quality, the variation is tightly clustered around 3.0%.

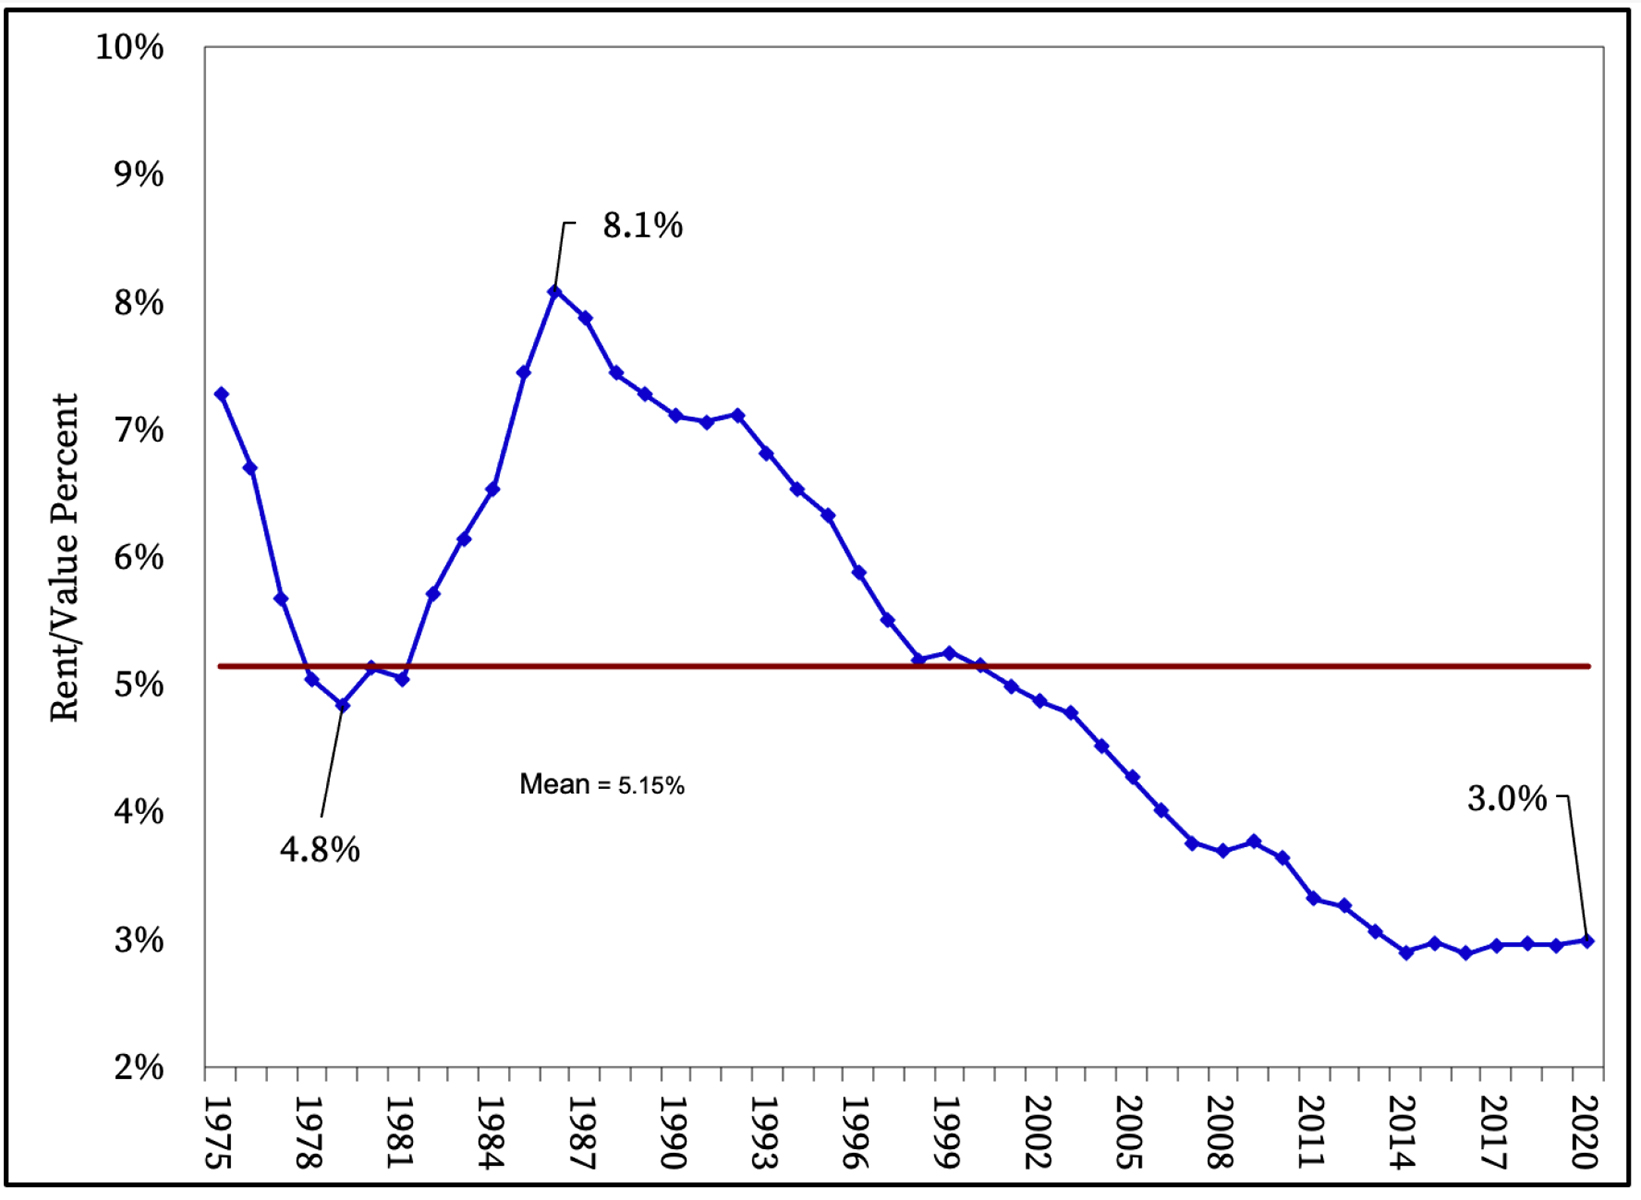
Figure 4. Gross cash rent for average quality farmland divided by average value of average quality farmland, 1975-2020
Looking Ahead
Statewide farmland values sit just below the historic peak of 2014, and on a year-to-year basis, values exhibited their largest gain since June 2013-2014. However, farmland prices have declined slightly since December, which may reflect changes in broader economic conditions related to the COVID-19 pandemic. As mentioned previously, many survey respondents emphasized the uncertainty related to the current COVID-19 pandemic. Given the disruptions across the food value chain and deep economic uncertainty, it is difficult to posit what the next year has in store for Indiana farmland market. The COVID-19 pandemic is a global phenomenon which will likely continue to disrupt trade patterns and income flows around the world. Everyone is hoping for a quick economic recovery, but as one respondent stated succinctly, “who knows what COVID-19 will do to the land selling price.”
Purdue Farmland Value and Cash Rent Survey
The Purdue Farmland Value and Cash Rent Survey is conducted each June. The survey is possible through the cooperation of numerous professionals knowledgeable of Indiana’s farmland market. These professionals include farm managers, rural appraisers, land brokers, agricultural loan officers, farmers, and Farm Service Agency (FSA) county office directors. These professionals were selected because their daily work requires they stay well informed about farmland values and cash rents.
These professionals provide an estimate of the market value for bare poor, average, and top quality farmland in December 2019, June 2020, and a forecast value for December 2020. To assess productivity of the farmland, respondents provide an estimate of long-term corn yield for top, average, and poor productivity farmland. Respondents also provide a market value estimate for land transitioning out of agriculture and recreational land.
The data reported here provide general guidelines regarding farmland values and cash rent. To obtain a more precise value for an individual tract, contact a professional appraiser or farm manager that has a good understanding of the local situation. Prior reports are located at: Purdue Agricultural Economics Report.
![]()
![]()
![]()
![]()
![]()
