Indiana in the 21st Century: Urban Growth and Rural Depopulation
May 18, 2009
PAER-2009-7
Brigitte Waldorf, Professor and Tani Lee, Graduate Student
![]()
![]()
![]()
![]()
![]()
Since the turn of the century, Indiana’s population has grown nearly 5%, adding about 300,000 new residents. According to new estimates released by the US Census Bureau, Indiana’s growth rate is less than the growth rate for the nation as a whole (8%) and is trivial compared to those of some western states, such as Nevada (30%) and Arizona (26%).
However, Indiana holds up favorably compared to its neighbors (Table 1). Only Minnesota has a slightly higher growth rate and Indiana ranks second with Wisconsin. On the other end of the scale are Ohio and Michigan, which have barely grown since 2000. Michigan has even experienced negative growth since 2005 and depopulation for three consecutive years (see Figure 1).
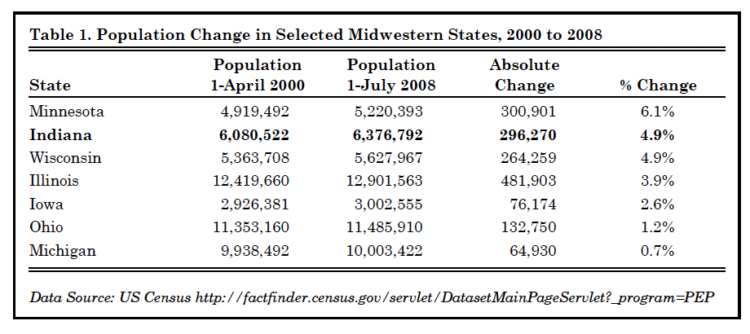
Table 1. Population Change in Selected Midwestern States, 2000 to 2008
Although Indiana’s population change is modest compared to the rapidly growing western states of the U.S., Indiana can expect drastic shifts in its population distribution. Recent data reveal that the population growth has been largely concentrated in urban areas. In fact, as shown in Table 2, the collar counties of Indianapolis (Hamilton, Hendricks, Hancock, Johnson and Boone) are the fastest growing counties in Indiana, with growth rates as high as in the western United States. Similarly, the growth rates of some suburban counties of the Chicago Metropolitan Area in the north and of the Cincinnati, Evansville, and Louisville metropolitan areas along the Ohio River are above the national average. Two additional counties belong in this group of fast growing counties:
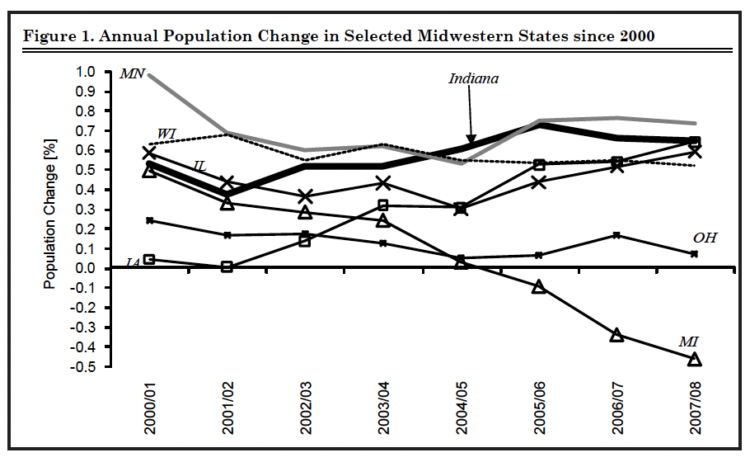
Figure 1. Annual Population Change in Selected Midwestern States since 2000
Tippecanoe County, home of Purdue University, and Elkhart County along the I 80 east west corridor.
The second group of counties shown in Table 2 includes 45 counties with slight population gains from 2000 to 2008 and a below average growth rate. This group is very diverse and includes:
- Marion County, home of Indiana’s capital, the city of Indianapolis;
- counties with major universities: Monroe County (Indiana University); St. Joseph County (Notre Dame University); Vigo County (Indiana State University);
- small counties that are comprised of an entirely rural population (as defined by the US Census Bureau*) such as Owen and Warren counties.
Only 22 of the 45 counties included in this second group are located in metropolitan areas whereas all of the counties in the first group of fast growing counties are classified as metropolitan.
The third group shown in Table 2 includes 35 counties that have lost population since the beginning of the new millennium. The vast majority of these counties are small, predominantly rural counties. Madison and Delaware counties are the exceptions, both house over 100,000 residents and more than three quarters of the population are classified as urban. Interestingly, almost all of the 35 counties have been on a persistent path of depopulation since 2000. Except in a few counties such as Brown the decline started in 2002, and Crawford, the decline started in 2003.
Figure 2 shows the population growth rates across Indiana counties. The primary area of population loss is sandwiched between the Indianapolis Metropolitan Area and the northern urbanized corridor along I‑80. In addition, many rural counties adjacent to the Illinois and Ohio borders are losing population.
Conclusion
If these population growth trends continue, the result may be an even deeper divide of the Indiana land‑ scape between the fast growing urban places and the depopulating rural areas. Rapidly growing urban counties provide economic opportunities, but they also develop challenges such as increasing demand for services and traffic congestion. On the other hand, the depopulation of rural counties creates a number of problems including declining school enrollment and diminishing provision of services, in particular if the majority of those leaving rural areas tend to be young in their prime productive years. Once the U.S. Census Bureau releases information on the changing population composition we will be able to assess whether, for example, the depopulation of rural counties occurs alongside the aging of the population.
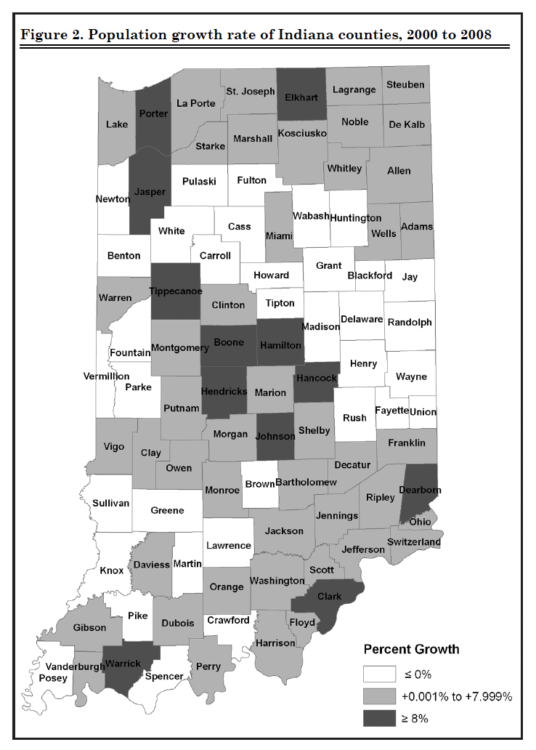
Figure 2. Population growth rate of Indiana counties, 2000 to 2008
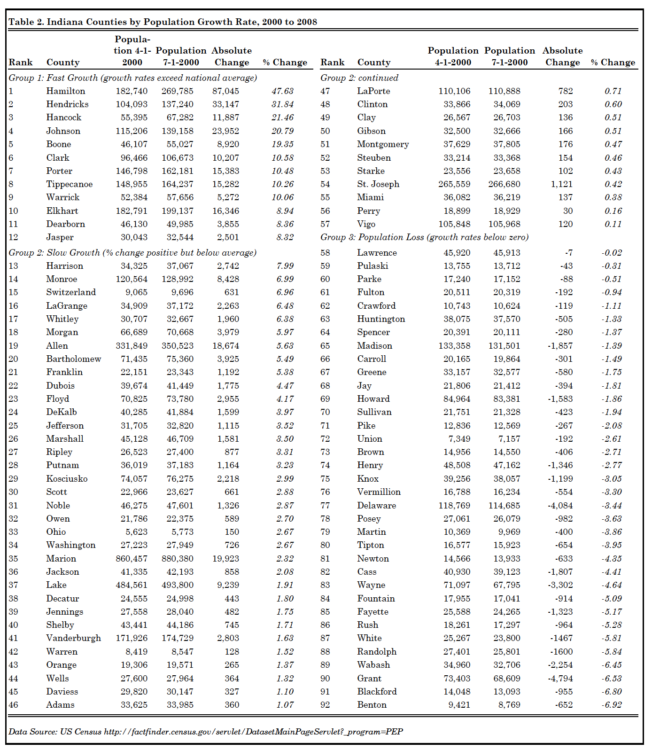
Table 2. Indiana Counties by Population Growth Rate, 2000 to 2008
![]()
![]()
![]()
![]()
![]()
