Indiana Land Prices and Cash Rents
August 1, 1978
PAER-1978-1
Author: J. H. Atkinson, Professor of Agricultural Economics
![]()
![]()
![]()
![]()
![]()
Would-be land buyers who were ready to take the plunge at a IO percent lower price had their chance in the central and northern parts of the state about a year ago. But the drop in land prices was accompanied by, no doubt caused by, lower grain prices. With corn at S 1.50 to $ 1.75 per bushel, purchase of land, even at 10 percent under springtime levels, did not look attractive.
Last winter there was talk of land prices being off several hundred dollars per acre. The Purdue land Values survey did not confirm these reports. The highest average decline reported from June ’77 to December ’77 was $159 per acre for top quality land in the west central area (Figure I). However, it is likely that the highest price paid for land, especially in cash grain areas, was off considerably more. Percentage changes (June-December ’77) in top quality land values ranged from substantial increases in the two southern areas to declines of 4 to 11 percent in other areas. But rising values from December ’77 to June ’78 erased some of these declines. The estimate for top land in the central area in June ’78 was $2482 -just $9 under the year-earlier estimate. In the north, northeast and west central, the June’78 estimate for top land was 5 to 6 percent below the ’77 figure. Compared to a year ago, land prices in the southwest and southeast were up 11 to 30 percent, perhaps because of exceptionally good yields and nonfarm demand (coal, oil and gas, and urban expansion). In addition, this strength may represent a “catching up” since land of similar yield potential has been lower-priced in the south than in some other areas of the state.
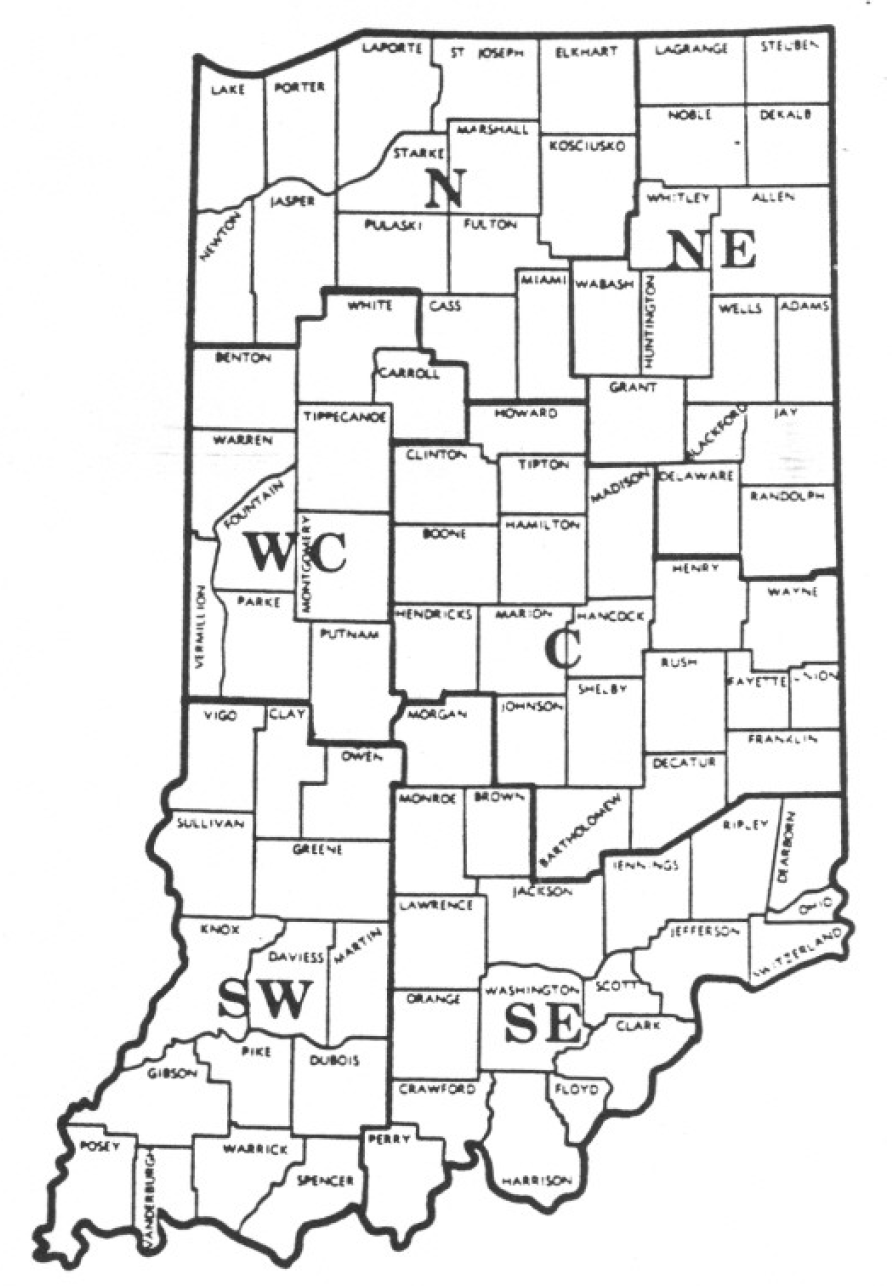
Figure I. Geographic areas used in the 1978 land value survey, Purdue University, July 1978.
Nearly 200 managers, lenders, brokers and appraisers responded to the Purdue Land Values Survey. They gave their estimates of what various classes of bare, tillable land were selling for. Thus, each person’s estimate was a composite of a number of sales. They were asked to give estimates for top, average and poor cropland and to estimate the long term average corn yield for each class. Value estimates were also given for transitional land-that moving into nonfarm uses.
For the 6-month period ending in June, the consensus of this group was that cropland values had risen 3 or 4 percent on a statewide basis (Table I). Average estimates by area and class of land fell mostly in the range of 2 to 7 percent increase.
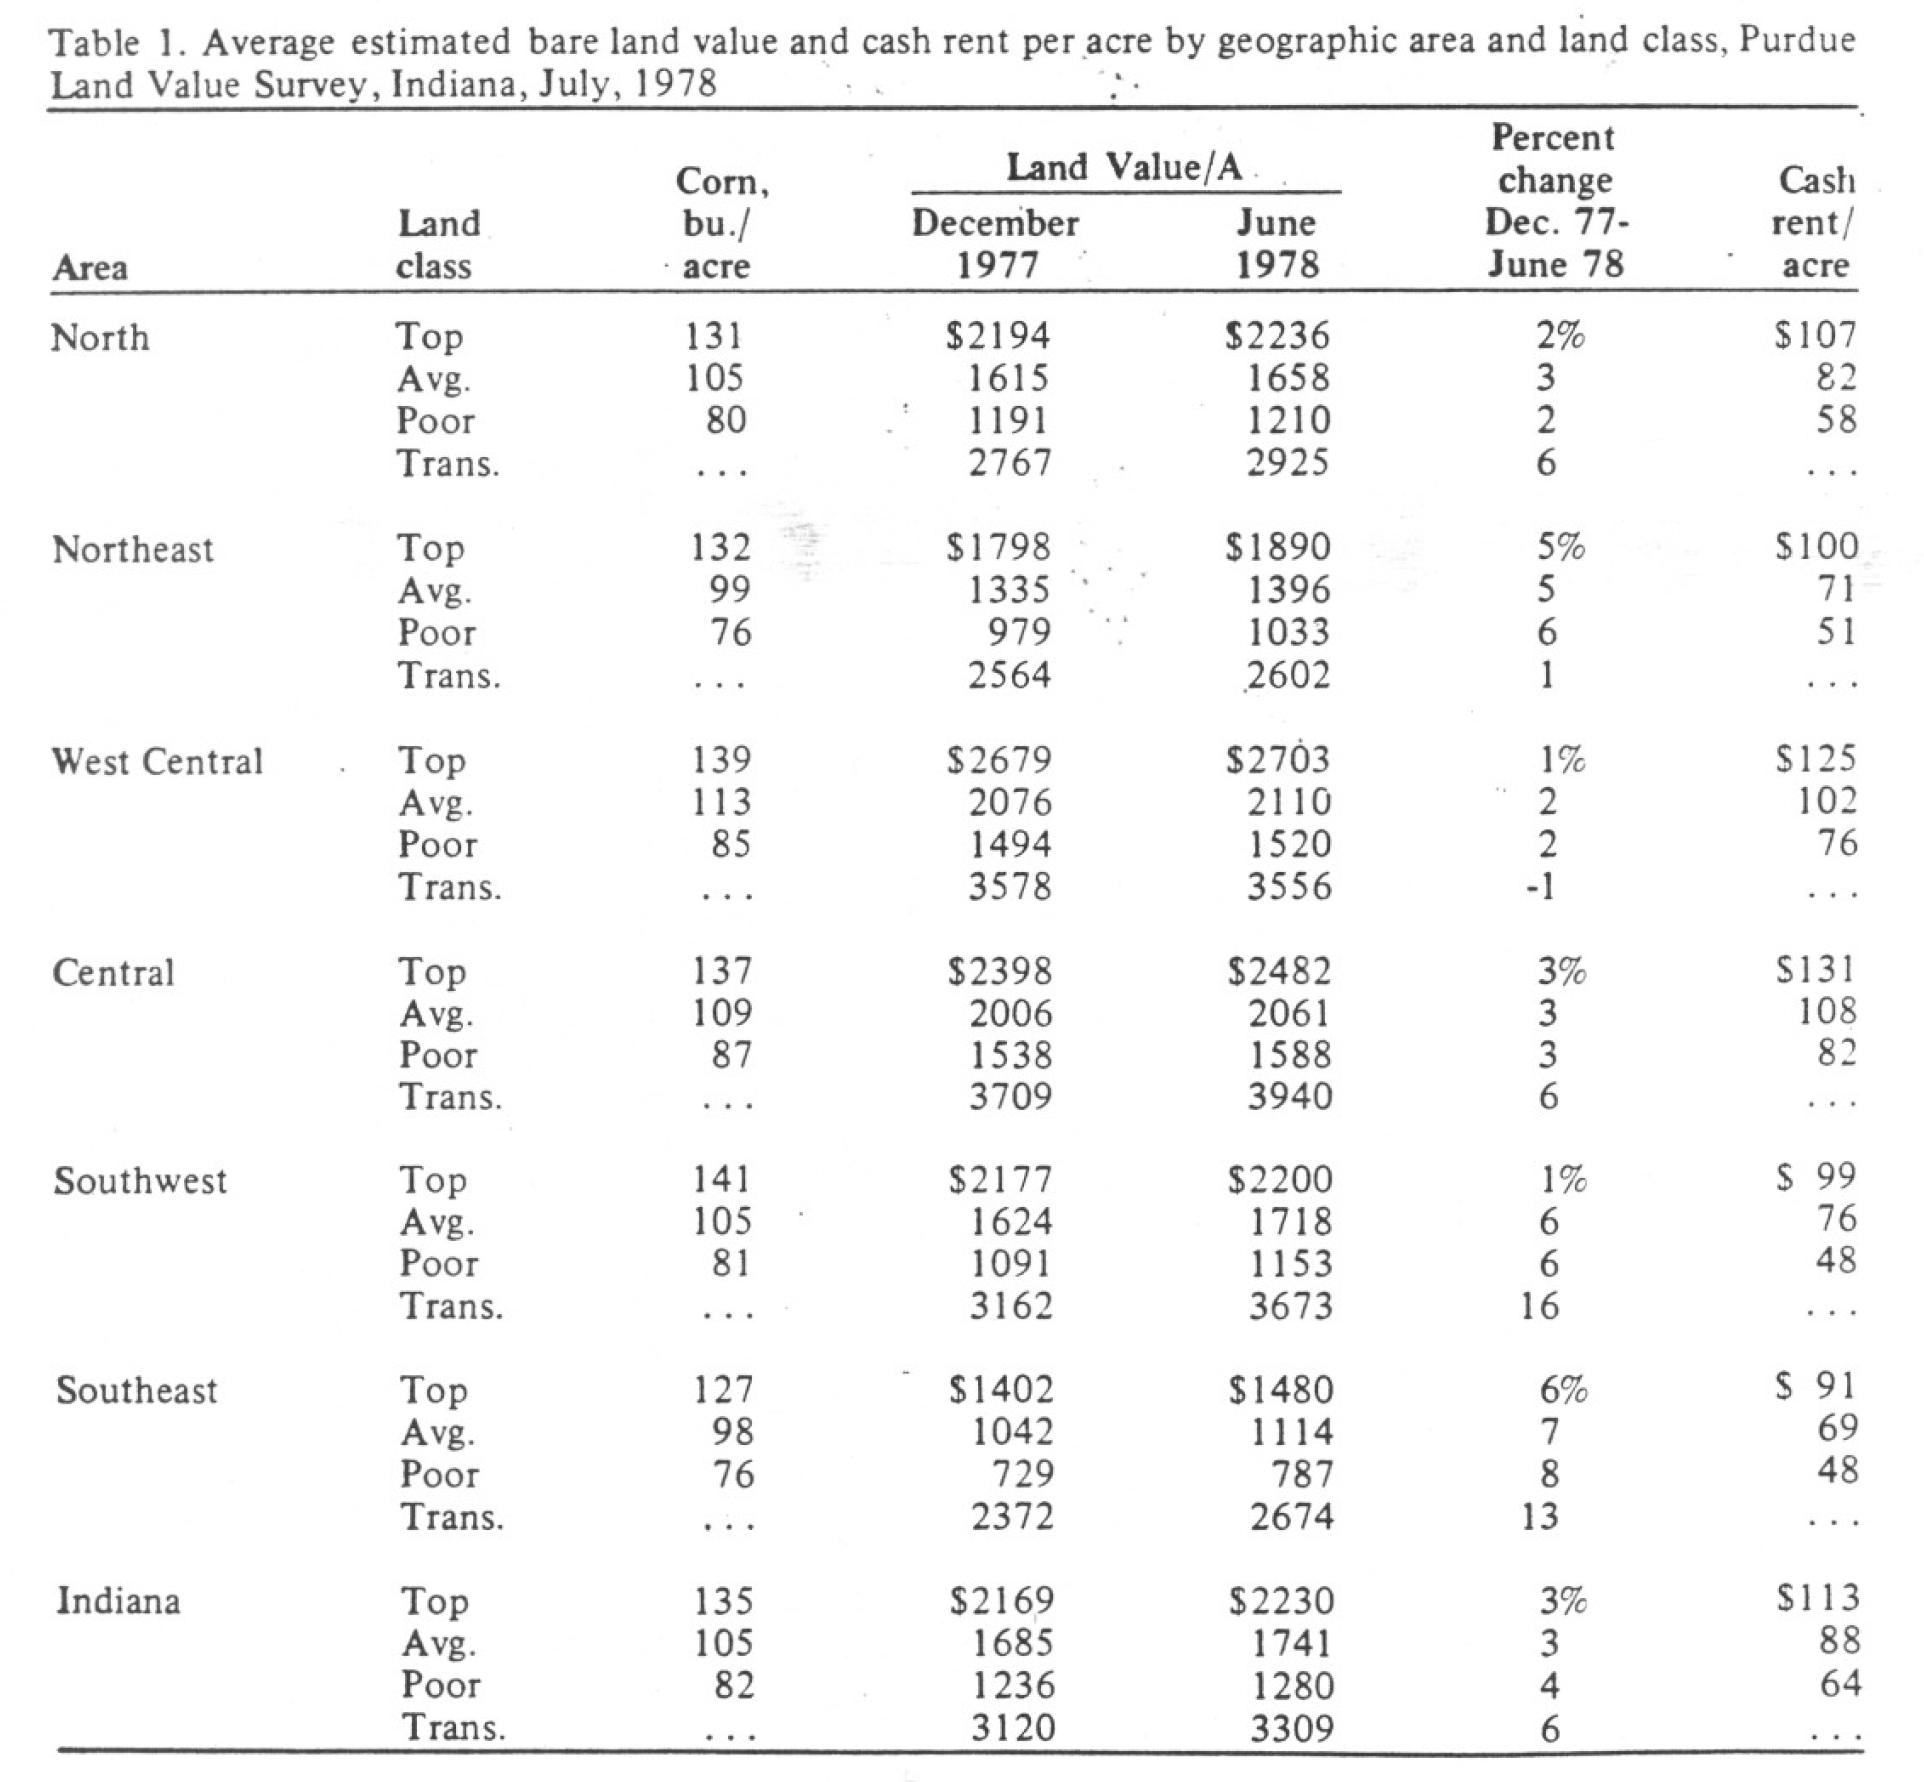
Table I. Average estimated bare land value and percentage change per acre by geographic area and land class, selected time periods. Purdue Land Value Survey. Indiana. July 1978
The highest average value was again in the west central area-$2703 per acre for land estimated to average 139 bushels of corn. Dividing land value by expected yield gives the following land cost (investment) per bushel:
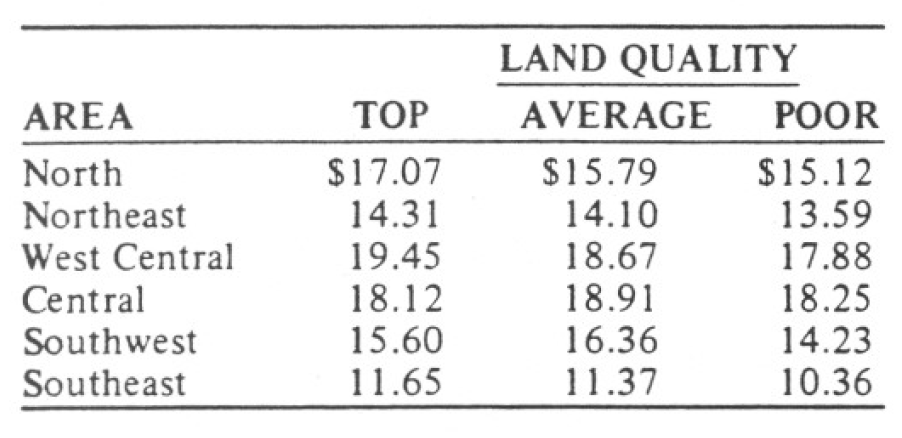
Table A: Top and average land values as a percentage of west central values, by areas
These per bushel figures are higher than last year in the two southern areas but slightly lower in other areas. Because of lower per bushel costs of labor and machinery on higher yielding land, it would be expected that land investment per bushel would be higher on the better land. This was true except in the central and southwest areas. In these areas, top land appears to be under-priced relative to lower yielding land-or the lower quality land is overpriced.
Land values per extra bushel of estimated yield, going from average to top land were nearly $23 in the north and west central and $13 to $15 in the other areas. The $22.81 figure for the west central area is down from $28.57, a further indication that the edge has been taken off the highest land prices. Nevertheless, extremely good land with an estimated yield of 150 bushels per acre would have an indicated price of around $3,000 per acre ($2703 per acre for 139 bu. land plus 11 bu. times $22.81 equals $2954). Buildings could easily add a couple of hundred dollars per acre, especially on small acreages.
Using land with an estimated yield expectation of 110 bushels per acre (fairly typical of much of our grain land), indicated values are as follows:
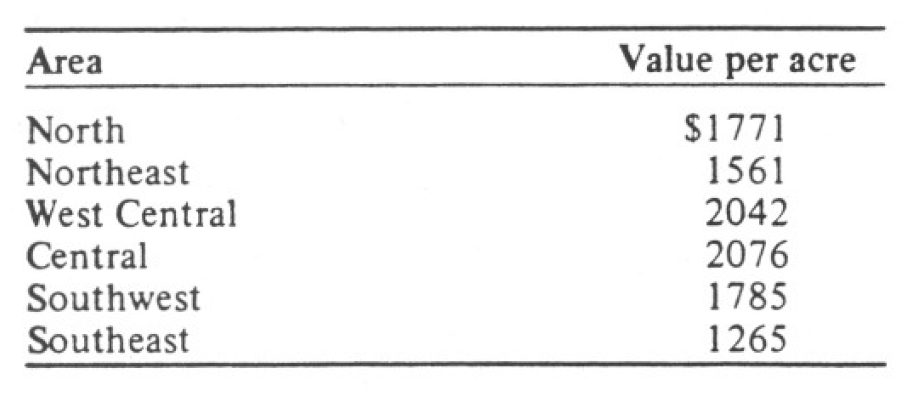
Table B: Value per acre by area (land with estimate yield expectation of 110 bushels per acre)
Land was valued in the north and southwest areas at about $300 an acre less than in the west central and central areas with even greater differences in other areas. No doubt a part of these differences is related to costs of production and risk but it is also likely that the strong demand for grain land in the west central and central areas has helped push up land prices in these areas.
A year ago, there was considerable expectation that cash rental rates would fall substantially. This did not happen. State-wide, the Purdue survey indicated a drop of only $2 per acre on average Iand to $88 per acre. USDA estimates showed a decline of $1 per acre to $86 for cropland rented for cash.
Rents were highest in the central area-$131 for 137-bushel land or 96 cents per bushel. Per bushel rates for top and average land were about 70 cents in the two southern areas, 75 cents in the northeast, 80 cents in the north and 90 cents in the west central area. Rent as a percentage of land value was slightly over six percent in the southeast and ranged from about 4½ percent to a little over 5 percent in other areas (Table 2).
With a gross cash rent of 5 percent or under, the landowner would net only about 4 percent on the value of his land. In many cases last year. the landowner’s net return from share renting was around 3 percent. Survey respondents were asked to estimate percentage returns to the landowner. Their replies averaged 4.3 percent of the June 1978 land investment over the next 5 years. Their price expectations for this period averaged $2.60/bushel for corn and $6.47 for beans. They expected land prices to increase by an average of 26 percent in 5 years. (A 4½ percent annual compound rate would result in a 25 percent increase in 5 years.) The combined return from annual farming operations and gains in land values would not equal the current farm mortgage interest rate. Thus this 5-year outlook, on the surface, is not optimistic; however, it may be that their answer could be interpreted as expecting a gradual increase in land values (around 5 percent per year) and an operating return near historic levels (excluding 1973-76) of around 4.5 percent. Their projections for the last half of 1978 are more optimistic-they expect an average of about 4 percent increase in land values. or an 8 percent annual rate. Projected increases by geographic area ranged from 3 to 5 percent. However, since these projections were made. grain prices have declined substantially. Unless there is a recovery, land prices this fall and winter will likely decline slightly.
Obviously, the prospective land buyer must make some assumption or guess about the future rate of increase in land prices. There is widespread belief that land prices probably will follow the rate of inflation which, over the next few years often is projected at around 5 to 6 percent per year. With the new federal farm program in place, the down-side commodity price risk is reduced; however. our grain prices are increasingly subject to the worldwide supply-demand situation. Thus, in any given year or so, the change in land prices might depart substantially from the rate of inflation. A series of good crop years worldwide could result in accumulation of price depressing U.S. surpluses. On the other hand, major shortfalls in production before we build up a large surplus could cause sharply higher grain prices which would tend to push up land prices. In short, there are major speculative elements in land purchase. Those who bought land from 1972 to 1976 reaped handsome rewards for taking this risk. but present prospects appear dim for a repeat performance.
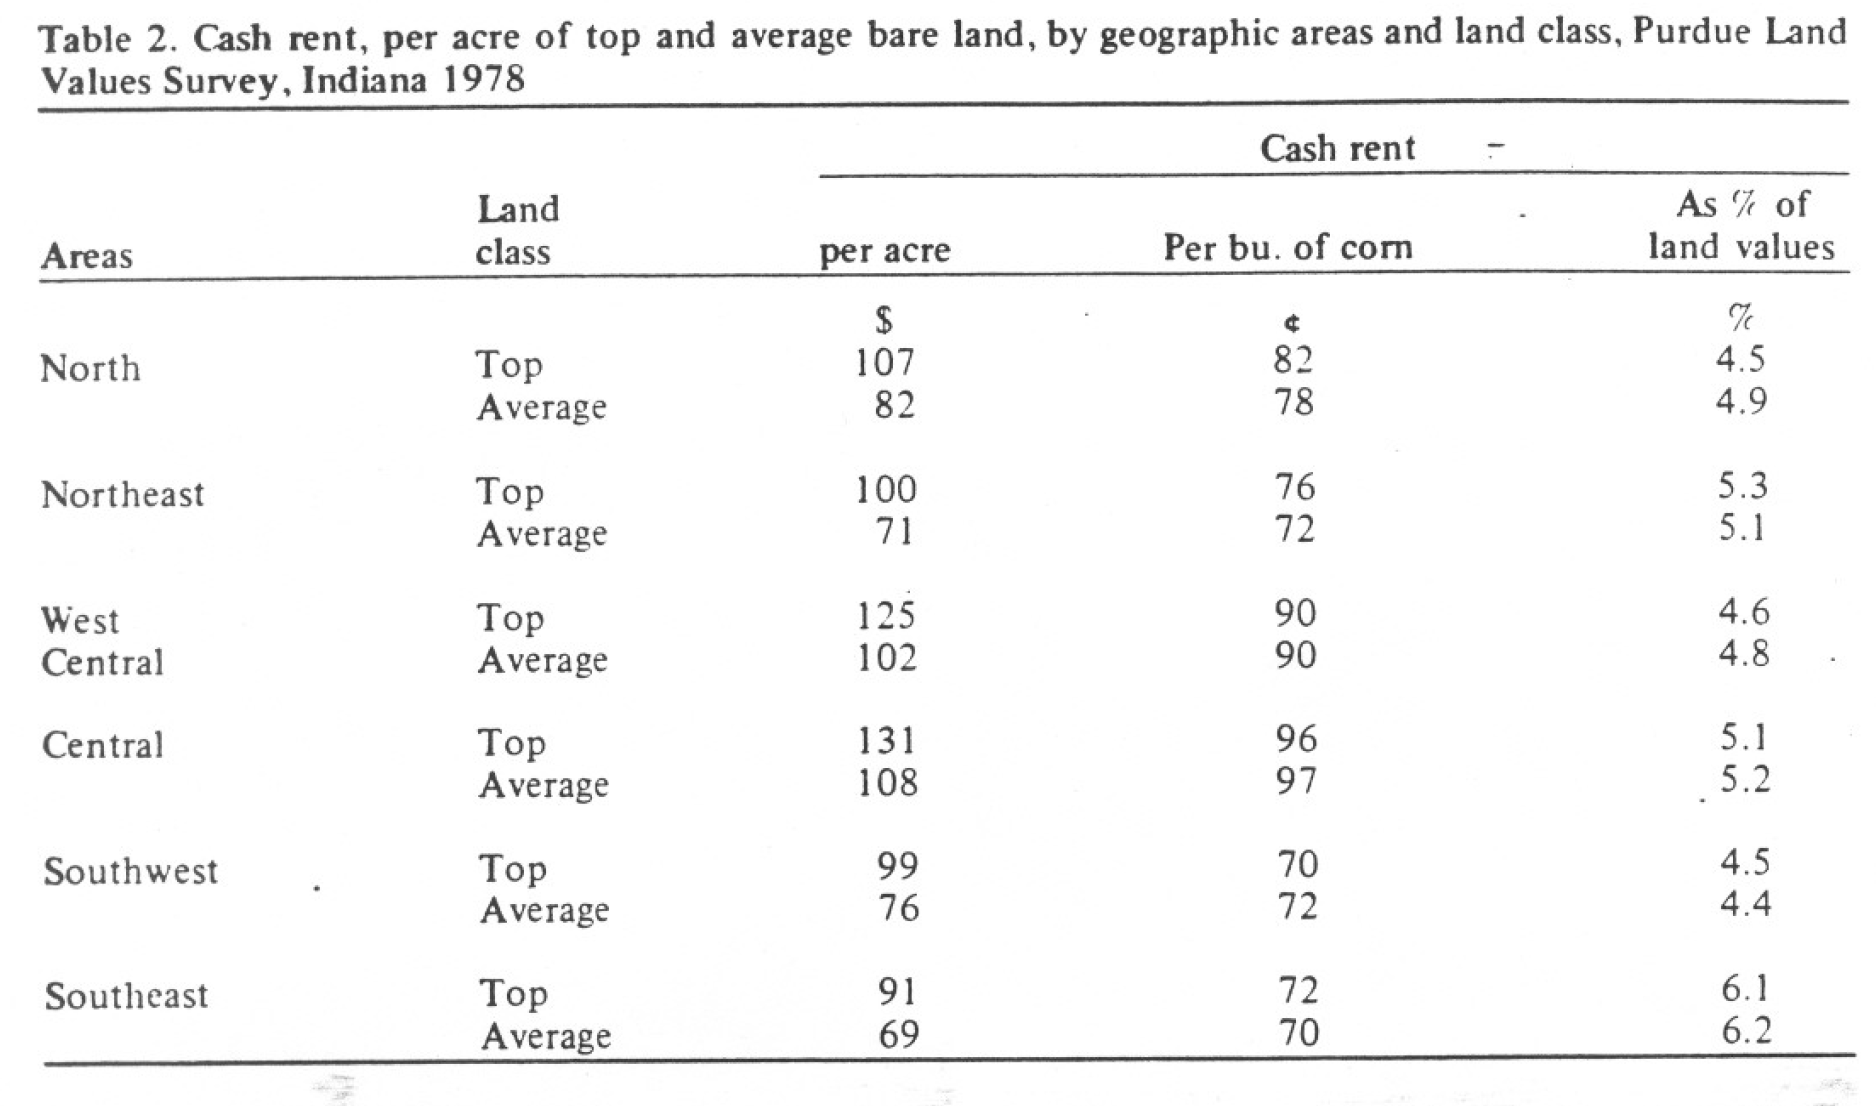
Table 2. Cash rent, per acre of top and average bare land, by geographic areas and land class, Purdue Land Values Survey, Indiana 1978
In general, land is now priced so that about a one-third down payment is necessary if an operating farmer expects it to “pay for itself.” This assumes a 34-year loan at 9 percent and corn prices of around$2.35 per bushel with the operator’s labor earnings plowed back into land payments. In the neighborhood of 50 percent down would be required for the investor with land rented on a 50-50 share basis. Down payments less than these amounts would require the newly purchased land to be “subsidized” from some other income source.
If land increased in value by one-third in 5 years, (about a 6 percent annual compound rate), the rate of return on the investor-buyer’s 50 percent down payment would be around 11 percent. (This assumes 110-bushel corn land at around $1900 per acre.) The owner operator making a down payment of one-third could allocate around $40 per acre to labor and management and realize around 11 percent return on his down payment. (In both cases. return to investment would be mostly in the form of capital gains, currently subject to tax when the asset is sold.) The owner operator who placed a lower value on his labor and management or who could realize cost economies would be able to out-bid the investorbuyer, assuming both used the same basic costreturns figures and expected a rate of return on their down payment a point or two above the current mortgage interest rate. However, the operating farmer needs to remember that he may have alternative ways to utilize investment funds and labor. For example, with the capital necessary to buy one acre, he might acquire machinery and operating capital to farm 3 or4 rented acres. Or, if he already owns some land, investment in livestock facilities might be considered. If the income generated by one of these alternatives was sufficient to more than pay the expected additional future cost of land, then the purchase of land might be postponed. The point is that if one expects only modest increases in land prices, there may be more profitable alternative uses for limited investment funds. Alternatives such as renting land or producing livestock likely would also generate a greater cash income than land. However, careful consideration should be given to land especially well located with respect to current farming operations and land which could serve as an operating base.
For the investor buyer, farm land still remains an investment with less down-side risk than some other alternatives. Common stocks can lose half their value in a year or so. Sizable losses can occur in specific urban real estate values because of shifts in population or centers of business activity. While there is widespread expectation that land values will trend upward over the next several years, there is the possibility of downward “bubbles” or “corrections” such as occurred in many areas of the state last year. In fact, the current (August) level of grain prices raises the distinct possibility of a repeat of last year’s slip in land prices. Thus. the investor buyer of land needs a fairly long planning horizon-5 to 10 years.
For every buyer there must be a seller. Who should be selling land? For the past couple of years. this report on land values has contained the suggestions that those who are at a point in their financial life where they are considering disposing of land “in a year or so” should consider immediate sale of their land. That suggestion still holds. With the low current rate of operating return to land and prospects for modest increases in land values, their chances of realizing much gain in a year or so appear slim. Some landowners may be considering shifting to an investment which provides more current income-residential or business real estate. for example. They should check carefully to take advantage of tax-free exchanges.
In summary, during the last half of 1977, land values in the northern two-thirds of the state dropped as much as 10 percent or so on the average. perhaps more on land selling at the extreme high. About half of the average loss has been recovered in some areas. all of it in other areas. Southern Indiana appears to have enjoyed a continuation of the land boom. Cash rents changed little from 1977. The short-term land price outlook is clouded by low grain prices. Weakness could develop unless grain prices recover. The long-term outlook is for gradually increasing land prices. Annual operating returns are low, thus necessitating down payments of one-third to one-half for land to carry itself. Now is a good time for farmers with funds to invest to give careful consideration to alternative investments. Investor buyers need to take a long-run view. Those who, for personal or business reasons, are considering selling land likely have little to gain by waiting.
![]()
![]()
![]()
![]()
![]()
