Indiana Land Values and Cash Rents Continue to Decline
August 1, 1986
PAER-1986-1
Authors: J.H. Atkinson, Professor of Agricultural Economics and Kim Cook, Agricultural Economics
![]()
![]()
![]()
![]()
![]()
Note: The charts in this article were taken from physical copy scans – as the original documents no longer exist. These versions are very blurry – we apologize in advance for the quality.
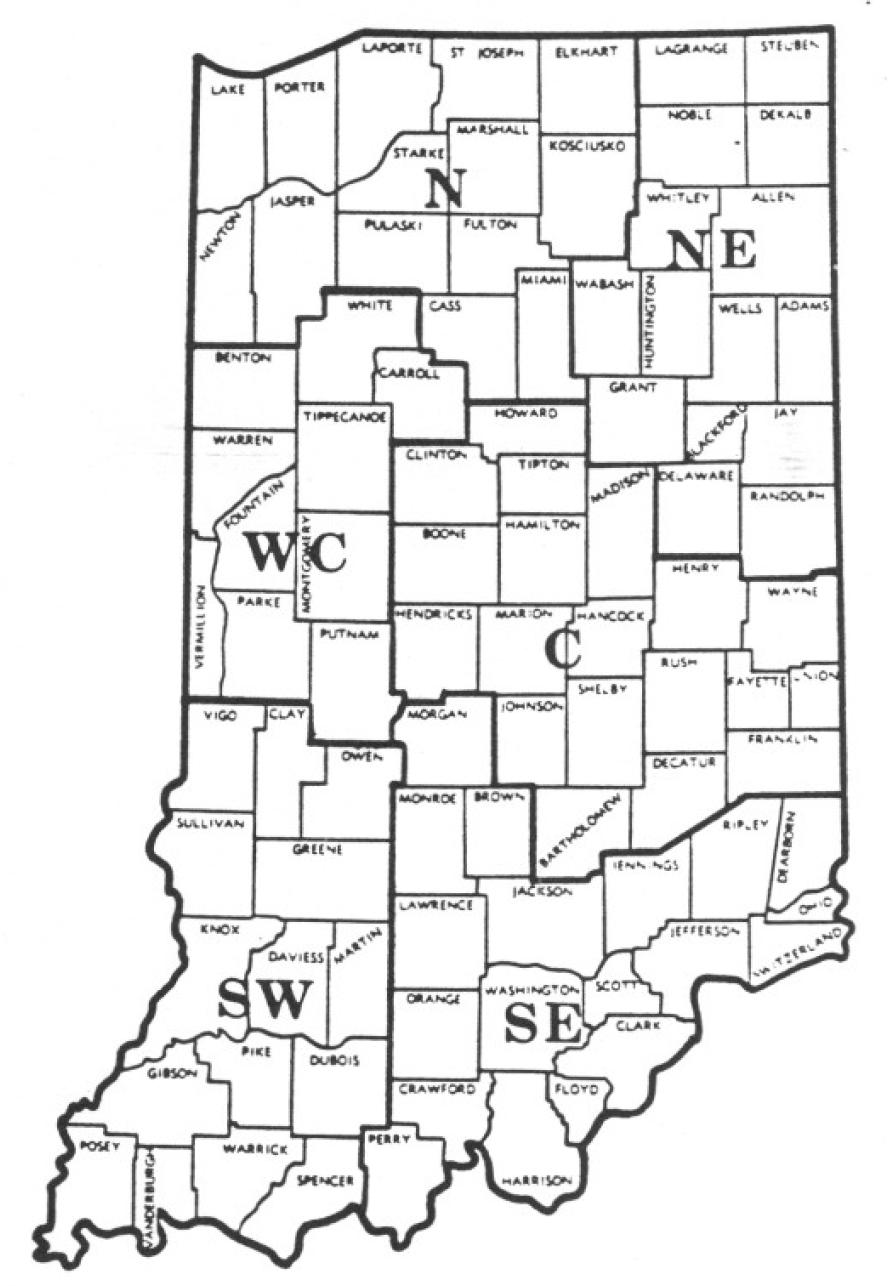
Figure 1. Geographic areas used in the Purdue land values survey, Purdue University, July 1986.
Results of the annual Purdue land values survey indicate that cropland values declined by around 18 percent in the year ending in June 1986; however, for top and average land over 70 percent of the decline occurred from June to December. The rate of land value decline appears to have slowed in the first half of 1986. Declines were reported throughout the state, though they varied somewhat by geographic area (Figure I). Cash rents declined percentage wise only a little over half as much as land values.
Statewide Averages
Statewide average declines in Indiana bare tillable and values from December 1985 to June 1986 were 5.4 percent on top land, 6.2 percent on average land and 8.6 percent on poor land (Table 1). Although substantial, these declines are less than the 8.3 percent to 12.6 percent reported for the same period a year ago. Last year, 85 percent of the survey respondents reported declines in land values from December to June, and only 1 percent reported increases. This year, 74 percent reported declines and 5 percent felt that values had increased (Table 2).
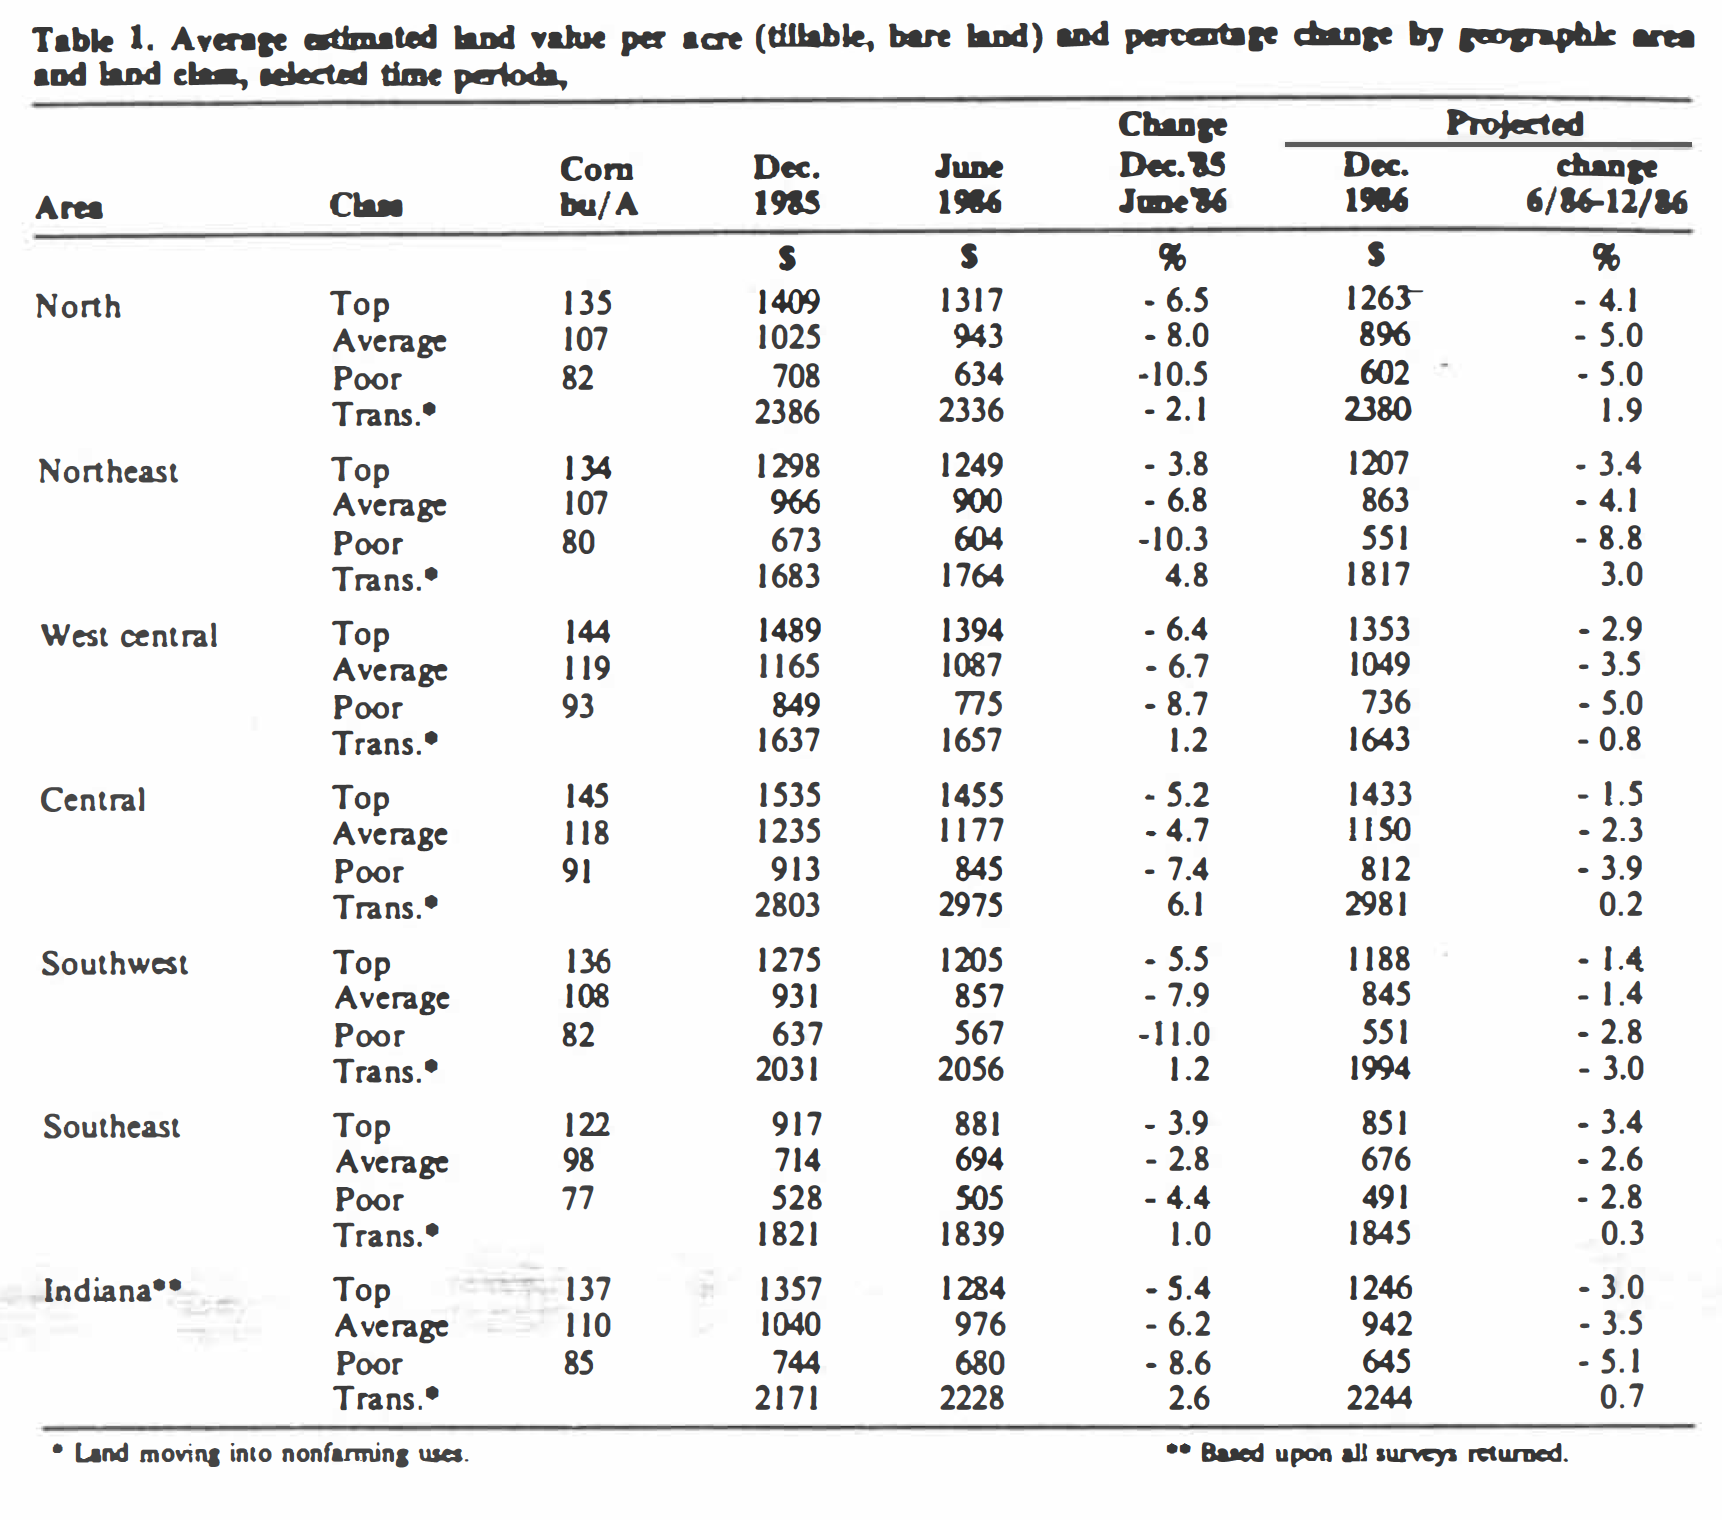
Table 1. Average estimated land value per acre (tillable, bare land) and percentage change by geographic area and land class, selected time periods; Purdue Land Survey, Indiana, July 1986
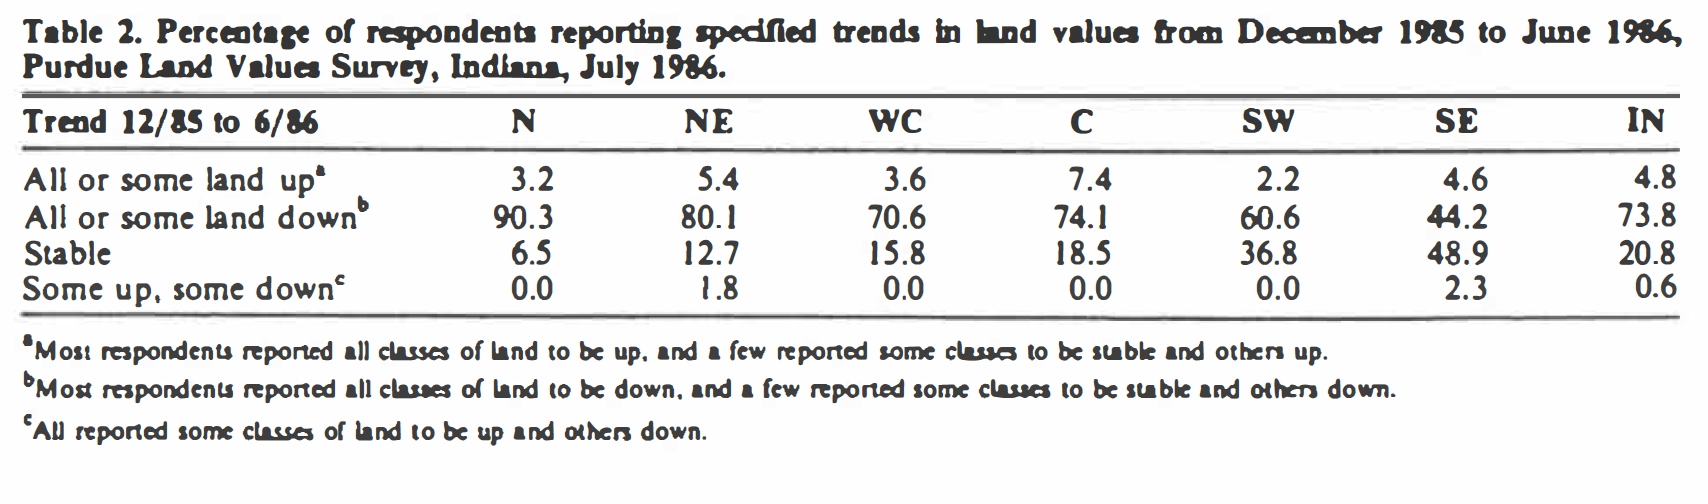
Table 2. Percentage of respondents reporting specified trends in land values from December 1985 to June 1986, Purdue Land Values Survey, Indiana, July 1986
During the year ending in June 1986 declines of over 18 percent occurred in Indiana cropland values (Table 3). Other sources report similar declines. For the 10 months ending February I, the USDA reported a state average decline of 16 percent; however, results of a Federal Reserve Bank survey as of April 1 indicated only an 11 percent annual decline for about the northern two-thirds of the state.
The USDA reported that Indiana land values in February bad declined 50 percent since February 1981. The Purdue survey indicates that from June 1981 to June 1986 declines were: top land, 52 percent; average land, S4 percent; and poor land, 55 percent.
Top quality land bad an average estimated value of $1284 per acre or $9.37 per bushel of the 137 bushel estimated long term yield (Table 4). Average land (110 bushel yield) was valued at $976 per acre while the 85 bushel poor land had an estimated value of $680. Land values per bushel of yield estimate were $8.87 on average land and $8.00 on poor land. These figures are about $2.00 per bushel less than the 1985 estimates.
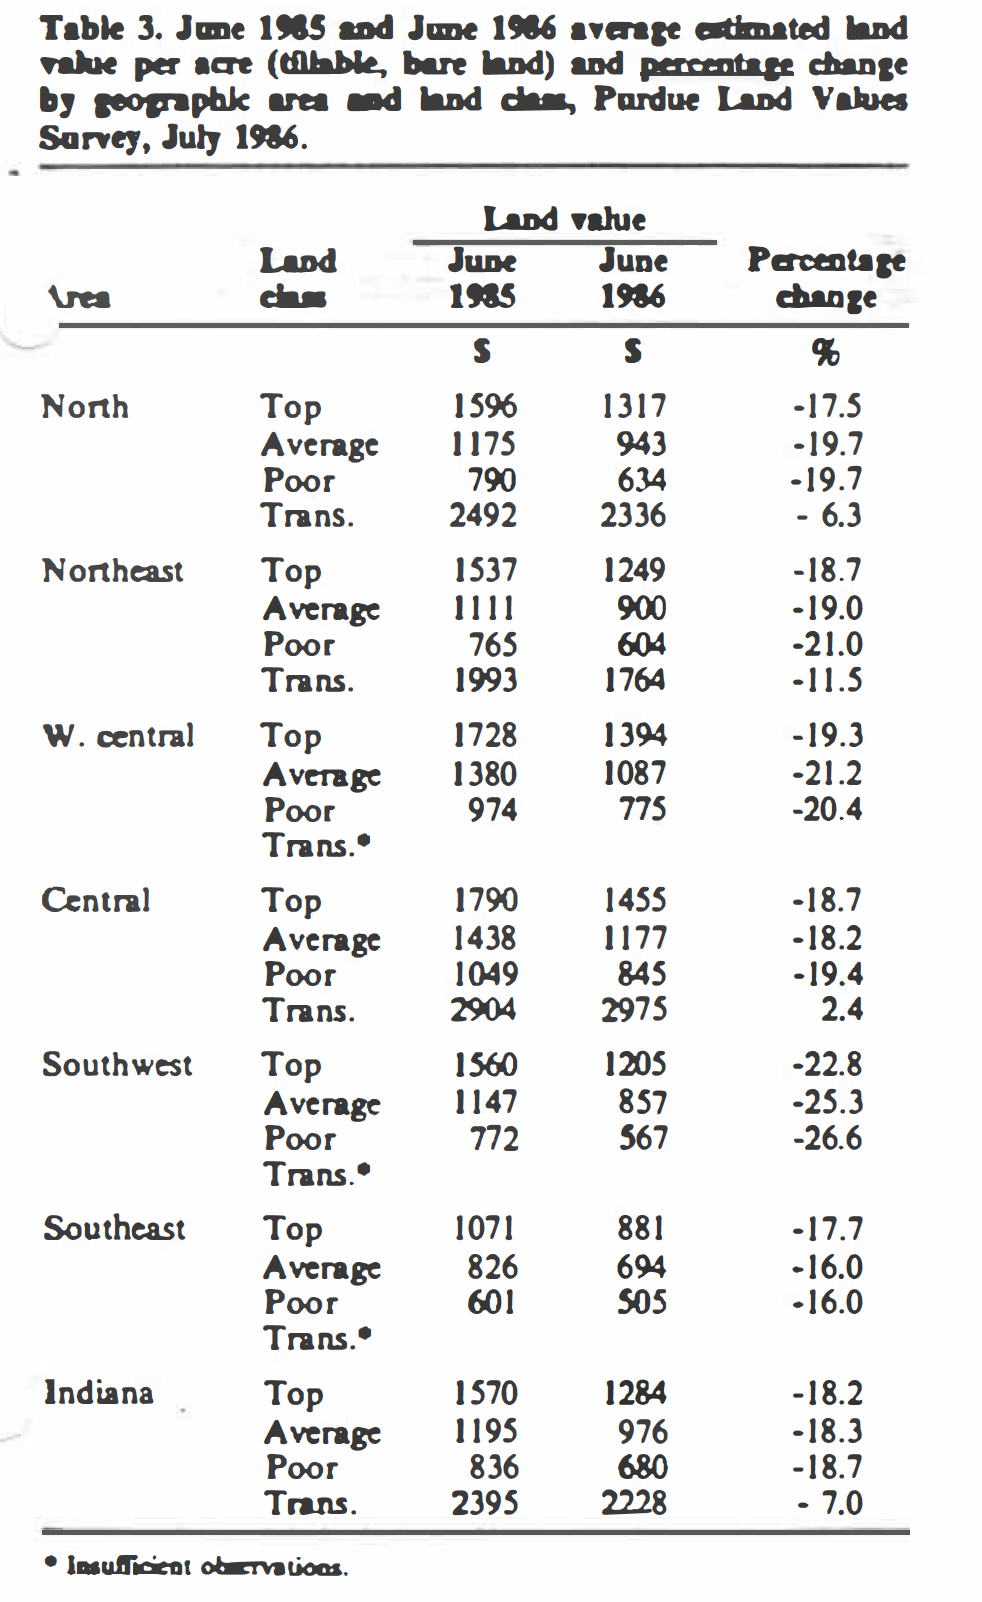
Table 3. June 1985 and June 1986 average estimated area land value per acre (tillable, bare land) and percentage change by geographic area and land class, Purdue Land Survey, July 1986
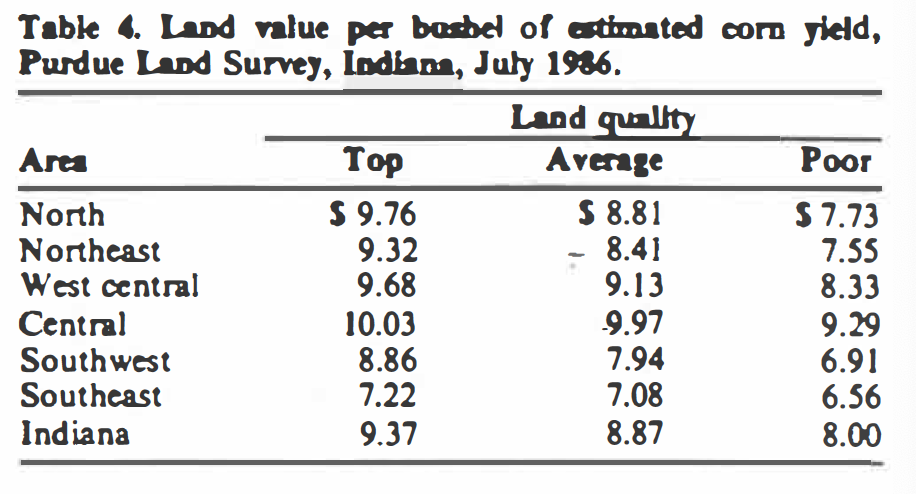
Table 4. Land value per bushel of estimated corn yield, Purdue Land Survey, 1986
Cash rents declined statewide from 1985 to 1986 by about 9 percent to 12 percent with the greater declines reported on lower quality land (Table 5). Cash rent declined $10 per acre on top and average land and $8 per acre on poor land, with 1986 rents at $102, $79 and $57 per acre for the 3 classes of land. Rent per bushel of estimated yield dropped about $.10 from 1985 to 1986. This figure was $.72 for average land, $.02 more for top land and $.05 less for poor land. These relatively small differences have changed little for several years.
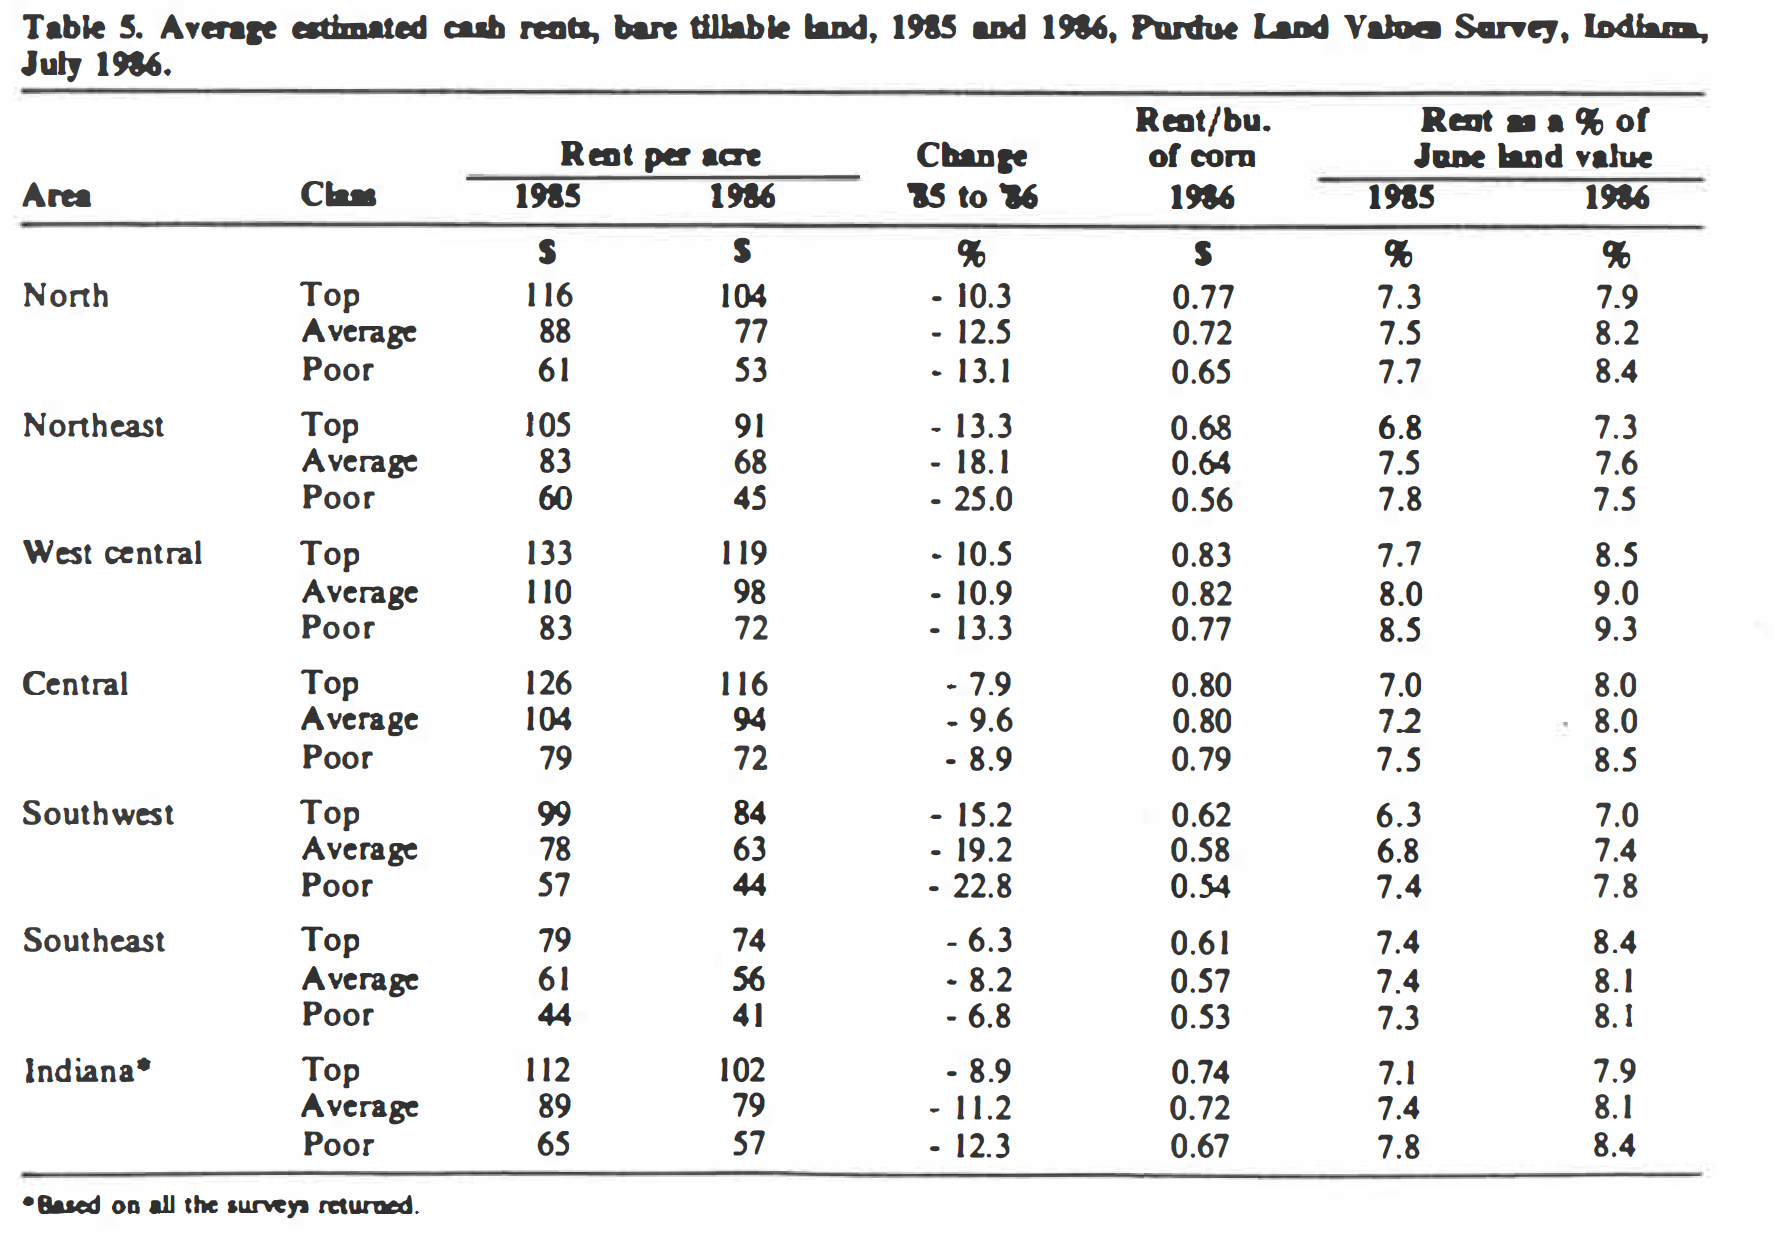
Table 5: Average estimated cash rents, bare tillable land, 1985 and 1986, Land Values Survey, Indiana, July 1986
Cash rents in 1986 were about 25 percent less than in 1981. Most of the decrease came in 1982, 1985 and 1986.
Cash rent as a percent of estimated land value rose again because land values declined more than cash rents. This figure is estimated to be 8.1 percent for average land, slightly lower for top land and a little higher for poor land (Table 5). Rent as a percent of land value was 5.1 percent for average land in 1981 and since then has increased a full 3 percentage points.
The value of land moving into nonfarm uses was estimated to have a market value of $2,228 per acre in June 1986, up slightly from last December but down 7 percent for the year. The relatively small number of persons reporting on this kind of land plus the wide variation in estimated values makes these per acre estimates less reliable than those for farmland; however, it appears that the value of transition land has held up much better in the past 6 to 12 months than farmland values. Since 1981, estimated transition land values have declined about 42 percent while farmland values declined 52 percent to 55 percent.
Area Estimates
Except in the southeast, declines in farmland values in the 6 months ending in June generally fell the range of 5 percent to 10 percent with a tendency for losses in value to become greater as land quality decreased. Declines in the southeast over this 6-month period were a modest 3 percent to 4 percent.
The percentage of respondents reporting some or all classes of land to have declined in market value since last December ranged from 90 percent in the north to 44 percent in the southeast (Table 2). Except in the north, these percentages were lower than they were last year, perhaps indicating that the market is not quite as weak as it was a year ago.
For the year ending in June, declines in land values were generally in the range of 18 percent to 20 percent in all areas except the southwest where declines were 23 percent to 27 percent (Table 3). This large decline may have been related to falling oil prices and their effect on the coal industry.
The drop in land values since 1981 ranged from 51 percent to 58 percent in all areas except the southeast where the declines were 45 percent to 39 percent, depending upon land quality.
The average reported value of top land was highest in the central area, $1,455 per acre for land with an estimated long term corn yield of 145 bushels. Estimated top land values adjusted to 140 bushel corn yields were within a $100 range in the four northern areas. In these areas, the highest value was in the central area ($1 ,405 per acre) and the lowest in the northeast ($1,305 per acre). This figure was $1,240 in the southwest. With an average estimated yield on top land of only 122 bushels per acre in the southeast, adjusting the value to a yield of 140 bushels probably is not realistic.
June 1986 land values per bushel of estimated corn yield tended to decline as land quality declined, although in the central area, the difference between top and average land was only $.05 per bushel (Table 4). Land values per bushel of yield were lowest in the southeast and highest in the central area. Except in the southeast, these per bushel estimates on top land fell in the range of about $9 to $10.
Transition land values varied from nearly $3000 per acre in the Central area to $1,657 in the west central area (Table I). Small gains in values over the past 6 months were reported in all areas except the north. Since 1981 this kind of land has declined in value only about 30 percent in the north and central areas, about 47 percent in the northeast and southeast, 52 percent in the west central area and 57 percent in the southwest.
Cash rent declined in all areas, no doubt in anticipation of lower grain prices (Table 5). Declines tended to increase as land quality decreased. The northeast and southwest were areas of the greatest average declines, ranging from 13 percent to 25 percent. Declines in other areas were generally in the range of 6 percent to 12 percent.
Cash rent per bushel of estimated yield was again highest in the central and west central areas: $.80 to $.83 per bushel for top and average land. In all areas there was little difference in rent per bushel between top and average land.
Rent as a percent of land value rose again because land values declined more than cash rents. This figure was from 7 percent to 7.8 percent in the northeast and southwest and from about 8 percent to 9 percent in the other areas.
What of the Future?
Last year, 71 percent of the survey respondents expected a decline from June to December in some or all classes of land. The expected decline ranged from about 5 percent to 8 percent depending upon land quality. Their outlook is somewhat improved this year, with 59 percent expecting average statewide declines of 3 percent to 5 percent (Table 1). Smaller declines are expected in the central and the two southern areas, while estimates in the west central area are about the same as the state average and estimates are slightly higher in the north and northeast.
Respondents were more optimistic this year than last regarding the level of land values 5 years hence. Sixty-seven percent, versus 55 percent in 1985, felt that land prices would be higher in 5 years; 9 percent (22.5 percent in 1985) thought they would be lower; and about a fourth voted for stable prices. The average for the entire group was an expected increase of 7.3 percent.
Respondents were asked to estimate annual averages over the next 5 years for corn and soybean prices, farm mortgage interest rates and the rate of inflation. Their responses in 1984, 1985, and 1986 are shown below:
Item 1984 1985 1986
Corn price $3.13 $2.70 $2.32
Bean Price $7.35 $6.13 $5.43
Interest rate 13.3 12.3 11.0
Inflation rate 6.5 5.1 4.2
There is little optimism in these figures. Even though interest rate expectations dropped more than a percentage point, declines in corn and bean price expectations would more than offset interest savings.
The question continues to be asked, “Have land values hit bottom?” There is some evidence that the rate of decline is slowing and that land values may even have leveled off in some areas of the Corn Belt. Yet the crop farming situation continues unfavorable. Prices have dropped, but exports have not responded much. Huge carryover stocks loom on the horizon. While this situation may already have been reflected in land value declines, a continuation of the present situation or a worsening of farm income prospects could cause some further weakness in land prices and cash rents. On the other hand, substantial increases in grain utilization and exports or a major shortfall in production next year could set the stage for more profitable farming and strength in land values.
This survey was made possible by the cooperation of professional managers, appraisers, brokers, bankers, and persons representing Production Credit Associations, the Federal Land Bank, the Farmers Home Administration, and insurance companies. Their daily work makes them the experts on land values and cash rents in Indiana. To these friends of Purdue and Indiana agriculture, sincere thanks arc expressed. They provided nearly 350 responses representing most of Indiana’s counties. Appreciation is also expressed to Julie Frey of the Department of Agricultural Economics for her help in conducting the survey.
![]()
![]()
![]()
![]()
![]()
