Indiana Land Values and Cash Rents Decline
August 1, 1985
PAER-1985-1
Author: J.H. Atkinson, Professor of Agricultural Economics
![]()
![]()
![]()
![]()
![]()
Note: The charts in this article were taken from physical copy scans – as the original documents no longer exist. These versions are very blurry – we apologize in advance for the quality.
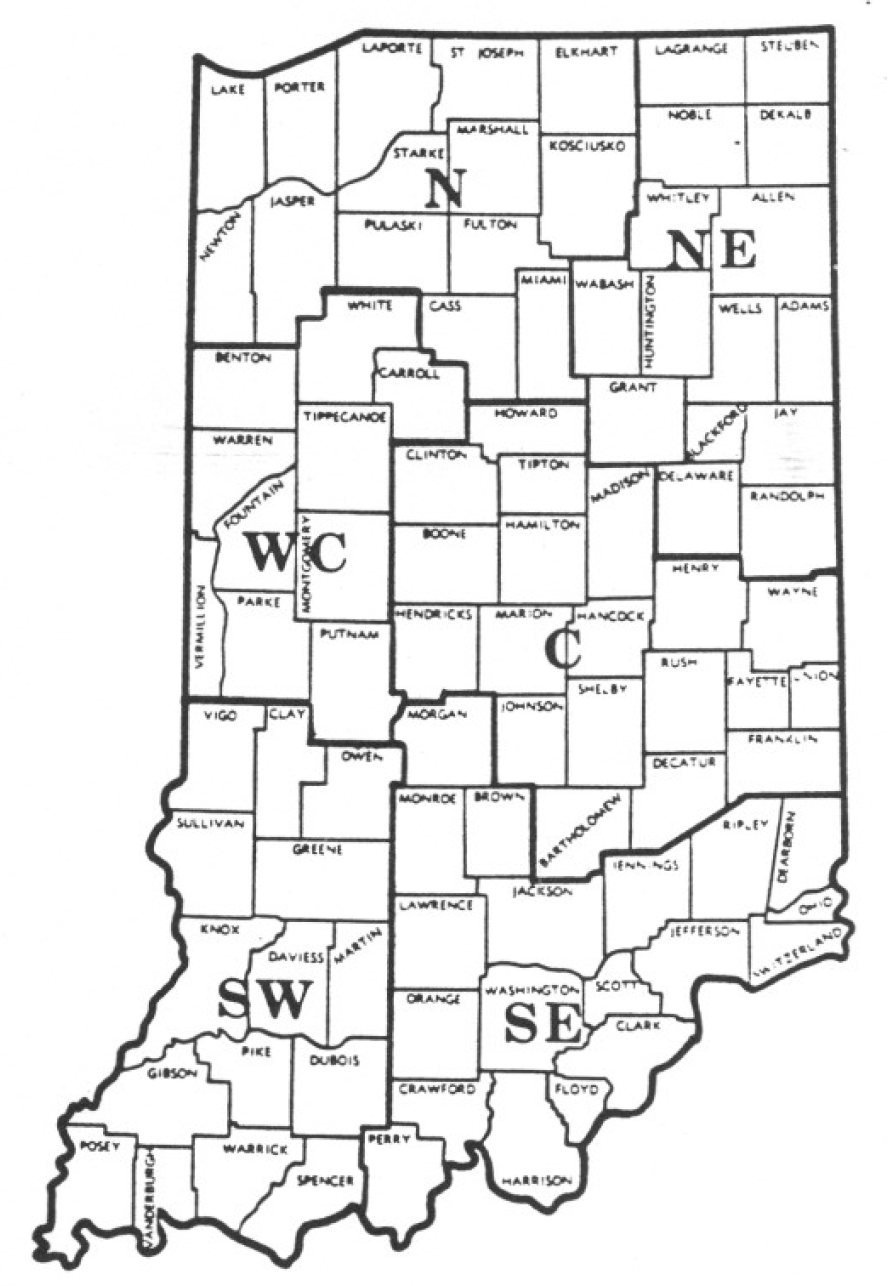
Figure 1. Geographic areas used in the 1984 land value survey, Purdue University, July 1985.
The annual Purdue land values survey indicates that cropland values declined sharply from last December to June 1985 and were substantially lower in June than a year earlier. Declines were reported throughout the state, though they varied somewhat by area (Fig. I). Cash rents declined less percentage wise than land values.
Statewide Average
Average statewide declines in Indiana bare tillable land values from December 1984 to June 1985 were 8.3 percent on top land, 10.7 percent on average land, and 12.6 percent on poor land (Table 1). Less than 1 percent of the persons surveyed felt that there had been any strength in land values over this period while 25 percent thought values had decreased (Table 2).
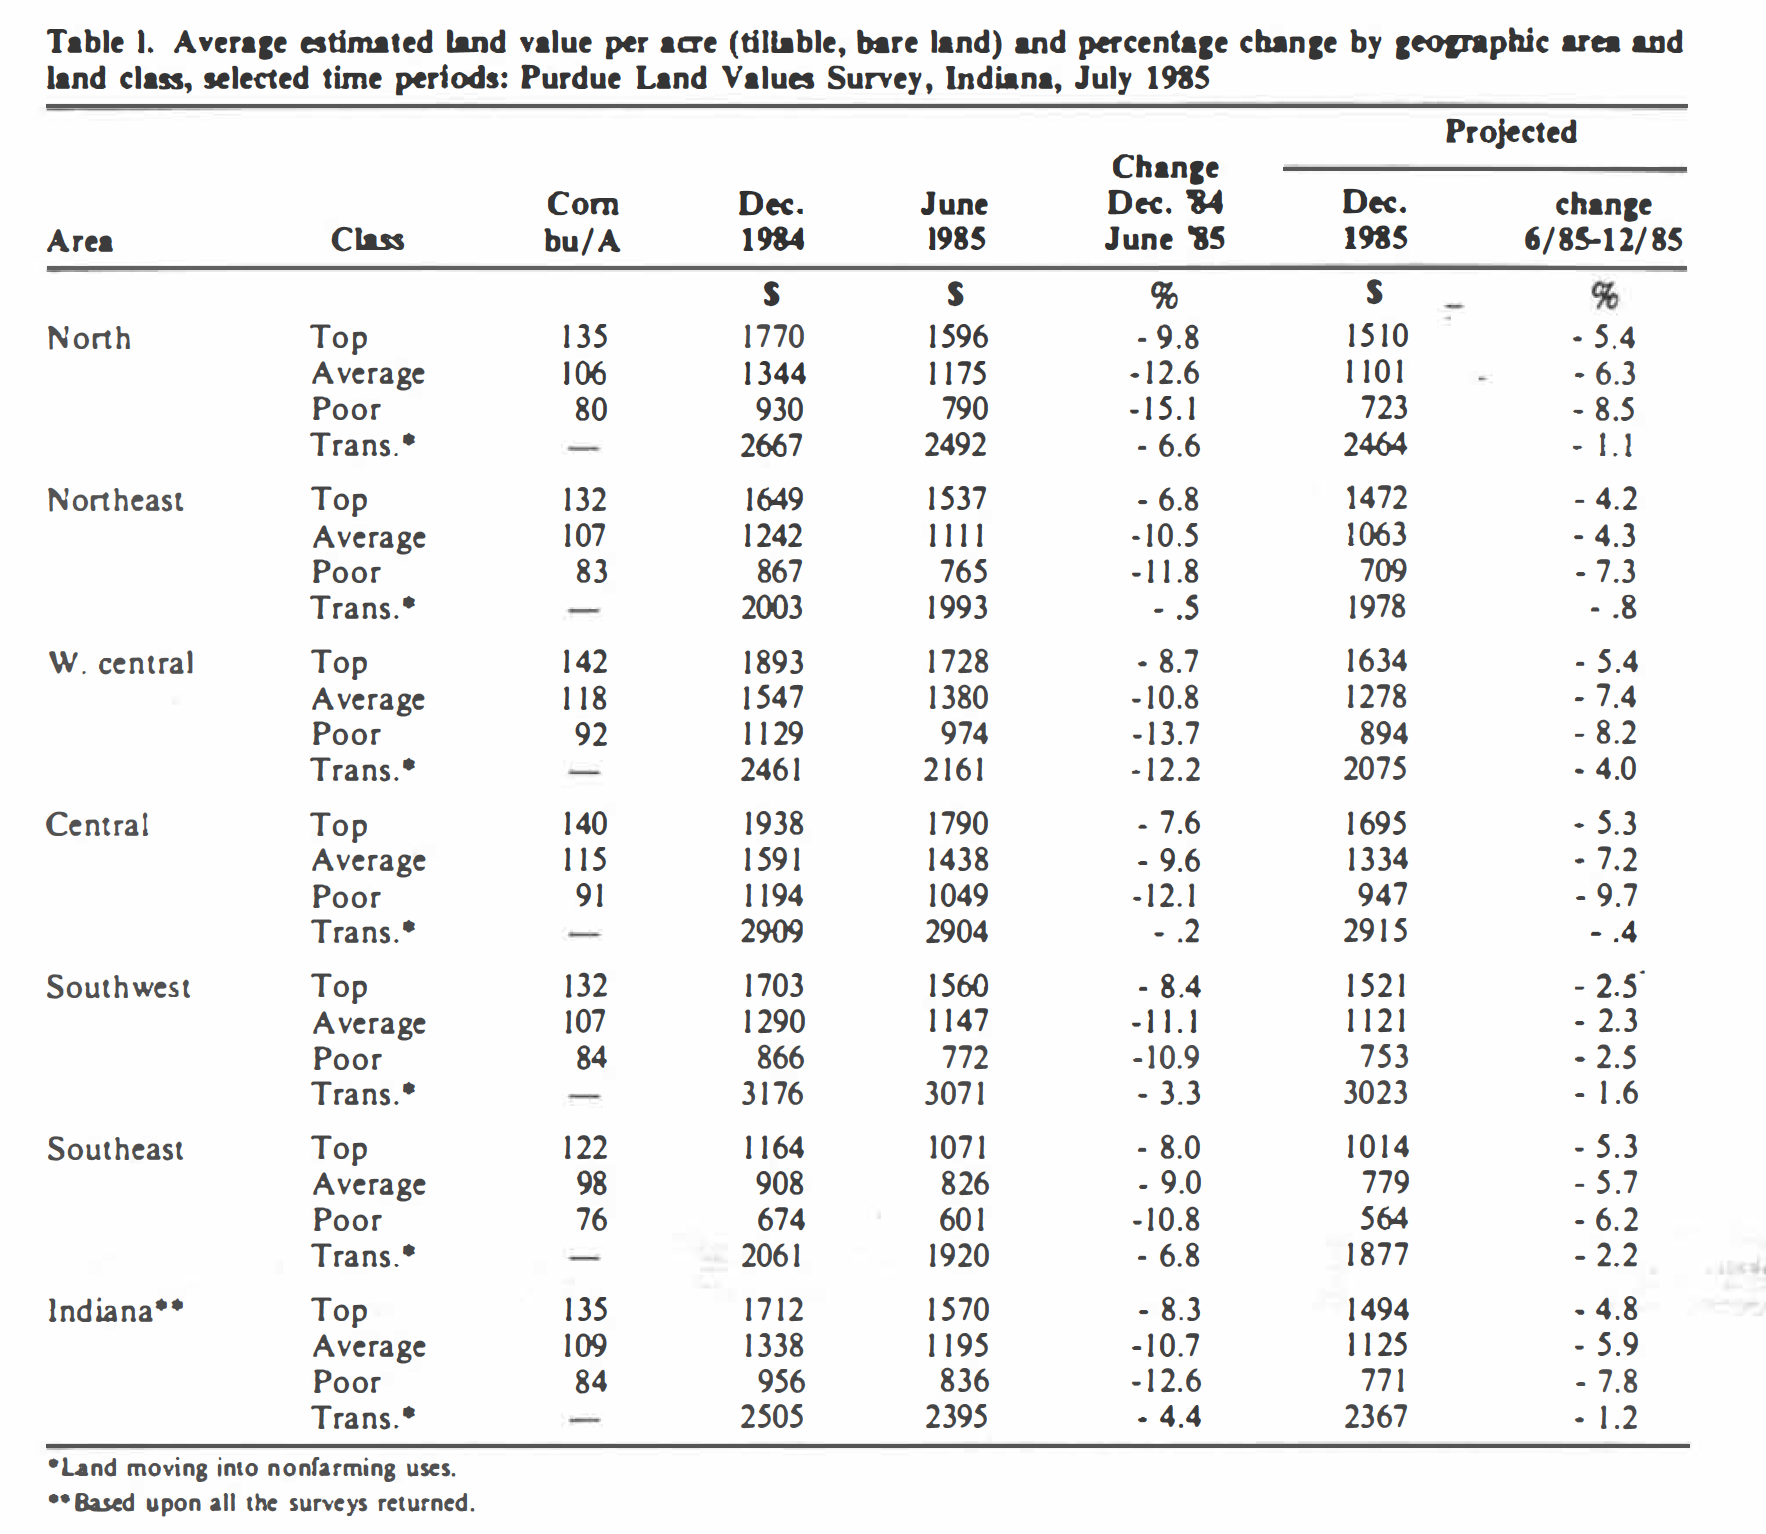
Table 1. Average estimated land value per acre (tillable, bare land) and percentage change by geographic area and land class, selected time periods; Purdue Land Survey, Indiana, July 1985
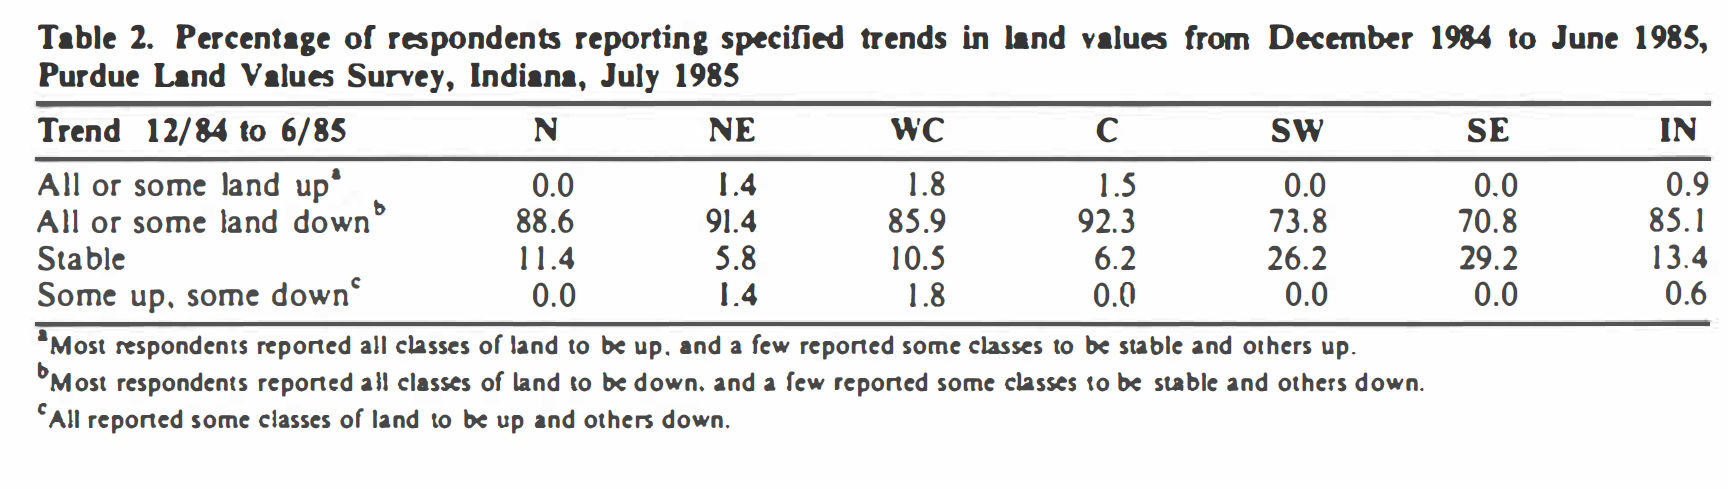
Table 2. Percentage of respondents reporting specified trends in land values from December 1984 to June 1985,Purdue Land Values Survey, Indiana, July 1985
For the year ending in June, declines were also greater on lower quality land: 16.3 percent on top land, 17.6 percent and 18.8 percent for average and poor land (Table 3). For the year ending April 1, the USDA reported a decline of 21 percent in Indiana farmland values.

Table 3. June 1984 and June 1985 average estimated area land value per acre (tillable, bare land) and percentage change by geographic area and land class, Purdue Land Survey, July 1985
The USDA also reported that Indiana land values in 1985 were off 41 percent from the 1981 peak. The Purdue estimate is the same for top land, 43 percent for average land and 45 percent for poor land. These declines leave Indiana land values at, or approaching, their 1976 levels.
Top quality land had an average estimated value of $1,570 per acre or $11.63 per bushel of the estimated Jong term yield of 135 bushels per acre (Table 4). Average land (109-bushel yield) was valued at $1,195 per acre while the 84-bushel poor land had an estimated value of $836. Land values per bushel of yield estimate were $10.96 on average land and $9.95 on poor land. Last year, these per bushel estimates were around $2.35 more on top and average land and nearly $2.20 more on poor land.
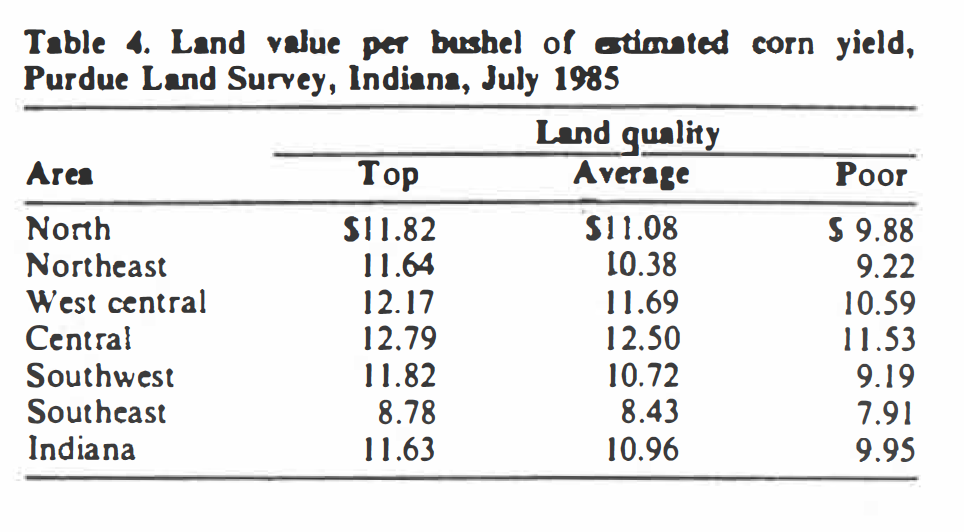
Table 4. Land value per bushel of estimated corn yield, Purdue Land Survey, 1985
Cash rents in 1985 were estimated to be down from 1984 levels by around 6 percent to 7 percent (Table 5). Land quality did not appear to influence the rate of decline. Top quality land that rented for an estimated $120 per acre last year was reported to have a rent of $112 in 1985. With an estimated yield of 135 bushels, the rent per bushel in 1985 was $.83 -only a penny above average land and $.06 more than the per bushel rent for poor land. These slight differences suggest better rental values for the tenant on higher quality land because the cost of major tillage operations can be spread over more bushels.
Continuing the trend of the past several years, the percent which cash rent is of land value rose by nearly a full percentage point. This figure is just over 7 percent on top quality land, 7.4 percent on average land and nearly 8 percent on poor land (Table 5). Cash rents have dropped, on the average, about 16 percent to 18 percent since 1981 while land values are off over 40%, thus the rent as a percent of land value rose from about 5 percent to current averages of 7 percent to nearly 8 percent.
Values of transition land (that moving into nonfarm uses) averaged about $2,400 for the state as a whole-down about $100 or 4.4 percent from last December. For the year ending in June, the decline was nearly 13 percent. The value of this kind of land varies widely by location.
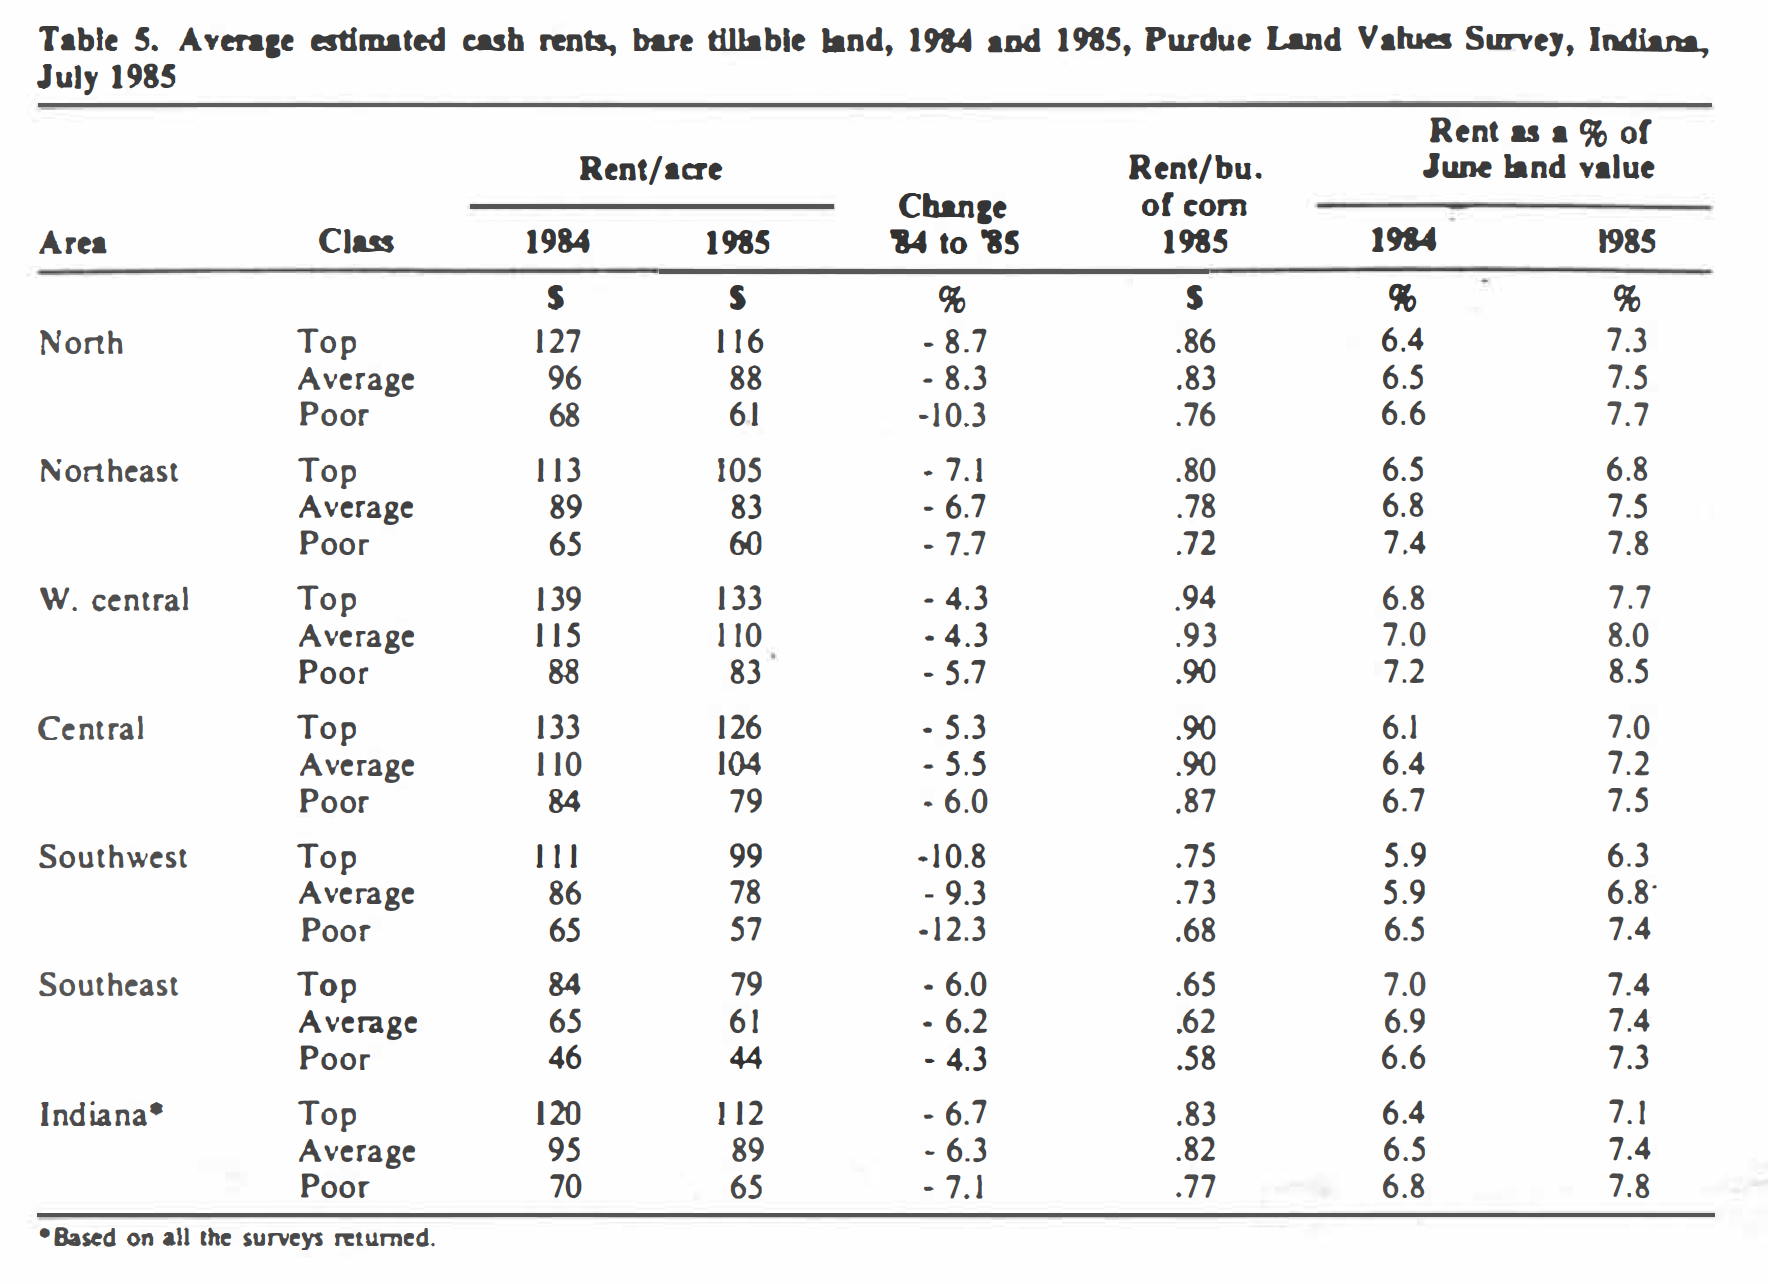
Table 5: Average estimated cash rents, bare tillable land, 1984 and 1985, Land Values Survey, Indiana, July 1985
Regional Estimates
From last December to June 1985, average declines in top land by region ranged from 6.8 percent in the Northeast to 9.8 percent in the North. Declines in average land values ranged from 9.0 percent (southeast) to 12.6 percent (north) and poor land, from 10.8 percent to 15.1 percent. Declines tended to increase as land quality decreased. Declines were highest in the north and lowest, for most cases of land, in the northeast and southeast. Except for poor land, differences in declines were fairly small from one region to another (Table 1).
The percentage of respondents reporting some or all classes of land being down since last December ranged from 92 percent in the central region to 71 percent in the southeast (Table 2). Virtually all the remainder reported stable land values. There was no consistent relationship between these percentages and the amount of decline in land values by region.
For the year ending in June, the northern area registered greater declines in cropland values than other areas, ranging from 19.6 percent on top land to 22.9 percent on poor land (Table 3).
Declines were the least in the northeast and southeast, falling in the range of about 12 percent to 14 percent. The other three areas showed declines in the range of 16 percent to 20%, except that declines in values of average and poor land in the southwest were 21 percent to 23 percent.
Year-to-year changes in land values tend to be affected by local conditions. For example, several counties in the northeast had very poor yields in 1981. For the year ending in June 1982, top quality land was reported to have declined about 25 percent compared to a statewide decline of 17.5 percent. Yet the decline in top land in the northeast from 1981 to 1985 was 40 percent compared to 41 percent for the state. In fact, declines from the 1981 peak are similar by area except for poor land in the southwest and all classes of land in the southeast where declines are noticeably lower than in other areas. Minerals and other nonfarm demands for land probably account for much of the smaller decline in these values relative to other areas and classes of land.
For the first time in several years, the average reported value of top land in the west central and central areas dropped below $2,000 per acre. In 1981 these figures were approaching $3,000 and have dropped about $1,200 per acre, to $1,728 in the west central and $1,790 in the central area.
With adjustment for yield differences, 140-bushel land was around $1,650 per acre in the north, northeast and southwest, about $1,700 to $1,800 in the central and west central areas and considerably less in the southeast.
June 1985 land values per bushel of corn yield varied less by area than in previous years (Table 4) indicating that values of similar yielding land are moving closer together in the various areas of the state. These values were lowest in the southeast, ranging from $7.91 to $8/78. In the other areas, land value per bushel of corn yield were roughly $12 to $13 on top land, $10.50 to $12.50 on average land and $9 to $11.50 on poor land. Note that land value per bushel declined as estimated yields declined, but in central and west central areas the difference between top and average land was less than $.50 per bushel. This small difference suggests that top land in these areas may be underpriced relative to average land.
Transition land varied in estimated value by areas from about $1,900 in the southeast to $3,071 in the southwest. Changes in these values for the year ending in June varied from an increase of 5 percent in central Indiana to a decrease of 27 percent in the southeast. At least some of these differences in changes in value are the result of area differences in the demand for land for business, industry, homesites, recreation, and coal mining. Looking at the change in transition land values from 1981 to 1985, the statewide decline was 38 percent, somewhat less than for cropland. In the northeast and southeast, declines were over 40 percent, while values in the north declined 24 percent and were 32 percent to 37 percent in the other areas.
Cash rents on top and average land declined from 1984 to 1985 by about 4.5 percent to 5.5 percent in central and west central Indiana (Table 5), 6 percent to 7 percent in the southeast and northeast, and 8.5 percent to 11 percent in the north and southwest.
Rent per bushel of estimated yield was $.90 to $.94 in the central and west central areas and less in other areas. There was little difference in rent per bushel between top and average land, again suggesting that the better value for the tenant is in renting top land.
Rent as a percent of land value rose again, continuing the trend of the past several years. This percentage rose as land quality declined except in the southeast and did not vary much between areas as indicated by the following ranges:
Top land 6.3 to 7.7 percent
Average land 6.8 to 8 percent
Poor land 7.3 to 8.5 percent
Is the decline over?
About 71 percent of the survey respondents expect some or all classes of land to decline in value from June to next December. Statewide, the amount of decline projected is about 6 percent on average land, about 5 percent for top land, and around 8 percent for poor land (Table 1).
Expected changes are less than these statewide figures in the northeast and southeast. In the other areas, expected changes are near to slightly higher than the state averages.
Over the next 5 years, 22.5 percent of the respondents fell land prices would be lower than at present; an equal number felt they would remain stable, and 55 percent expect higher prices. The average expected change of the entire group was a 3.6 percent increase. This represents a distinct shift in the longer run expectation of the group. Last year, 78 percent of the group expected land prices to be higher in 5 years with a group average increase of 11 percent.
Respondents were also asked what they thought would be annual average price over the next 5 years for corn and soybeans and their estimates of farm mortgage interest and inflation rates. Their responses for 1984 and 1985 are shown below:
Item 1984 1985
Corn price $3.13 $2.70
Bean price $7.35 $6.13
Interest rate 13.3% 12.3%
Inflation rate 6.5% 5.1%
With expectations for the above corn and bean prices, it is not surprising that the group judgment is for little strength in land values, even with somewhat lower interest rates.
These estimates should not be viewed as predictions, but they do reflect the mood of the land market – one of caution bordering on pessimism. Conditions can, and do change, but at the moment we have a huge surplus of wheat, prospects for corn and bean crops that seem likely to result in large carryovers a year from now, exports are sluggish, increasing numbers of farmers are experiencing financial stress, and uncertainty hangs over farm legislation. On the positive side, interest rates have declined, and reports are that some land is moving at prices low enough to allow buyers to cash flow repayment of maximum loans from expected returns to the land. Nevertheless, good management dictates that land purchase and financing should be arranged so as to withstand at least a temporary continuation of depressed farm earnings.
The nature of free market prices is that they tend to move too far up or too far down in seeking an equilibrium. This may be true with land prices, so persons who are considering buying land would be well advised to watch their local land market (as well as reports on the general level of land prices) for signs that the price decline may have run its course.
For many, if not most, landowners and prospective owners, land is a special kind of investment from which benefits other than annual monetary returns accrue. For this reason, land likely will continue to command a price that cannot be fully justified by current or prospective annual monetary earnings.
This survey was made possible by the cooperation of professional managers, appraisers, brokers, bankers, and persons representing Production Credit Associations, the Federal Land Bank, the Farmers Home Administration, and insurance companies. Their daily work makes them the experts on land values and cash rents in Indiana. To these friends of Purdue and Indiana agriculture, sincere thanks are expressed. They provided more than 350 responses. representing all of Indiana’s counties. Appreciation is also expressed to Kim Cook and Julie Frey of the Department of Agricultural Economics for their help in conducting the survey.
![]()
![]()
![]()
![]()
![]()
