1999 Indiana Land Values Decline
September 1, 1999
PAER-1999-12
![]()
![]()
![]()
![]()
![]()
The 1999 Purdue Land Values Survey indicates that the value of an acre of average bare Indiana cropland was$2,092 per acre in June 1999. This was $63 less than the value reported in June 1998, a 2.9 percent decrease. This decline ends 11 consecutive years of increasing values. Cash rents declined from 1998 to 1999 on average land by a little less than two percent to $110 per acre. This is the first decline in cash rental rates for average land since the decline reported in 1993.
Statewide Land Values
For the six months ending in June 1999, the value of bare tillable land was reported to have decreased 2.1 percent on top land, 2.4 percent on average land, and 2.5 percent on poor land (Table 1). This is the first time in 11 years that the average value for all three land types declined.
While statewide land values moved lower for this six-month period, local conditions always exert important influences. Twenty-four percent of the survey respondents indicated that all classes of land were the same or higher during the December 1998 to June 1999 period. While respondents indicated that the land market still has strength in some areas, the percentage of respondents indicating that some or all classes of land increased in value was less than half the number that made a similar report in 1998.* Thirty-seven percent of the respondents indicated that some or all classes of land fell in value during the same six-month period.** Thirty-one percent indicated that land values remained unchanged during the six-month period.
The statewide 12-month decrease in average value from June 1998 to June 1999 was 2.9 percent (Table 1). Top-quality land (155 bushel corn yield rating) was estimated to have declined by $72 per acre to $2,643 (Table 1). Average land (126 bushel corn yield rating) was valued at $2,092, a decline of $63, while poor land (97 bushel corn yield rating) was estimated to be worth $1,546 per acre, a decline of $86.
The land value per bushel of corn yield rating also declined this year. For top-quality land, the value per bushel of yield was $17.08, down by 5.2 percent. Average quality land value was $16.57 per bushel, while the poor quality value was $15.92 per bushel (Table 1). The percentage decreases were 5.8 percent on aver-age land and 7.0 percent on poor land. These per-bushel figures are
$0.94 lower than last year on top land, $1.02 lower on average land, and $1.20 lower on poor land.
The value of transition land moving into non-farm uses also exhibited some decline. The average value of transitional land in June 1999 was $6,109.*** For the six-month period from December 1998 to June 1999, transitional land increased by $245 per acre, 4.2 percent. Even with this increase, the June 1999 reported value was 2.1 percent less than the average of$6,149 reported in June 1998 (Table 1). However, due to the wide variation in estimates (from $1,400 to $25,000 in June, 1999), the median value may give a more meaningful picture than the arithmetic average. The median value of transitional land in June, 1999 was $5,000 per acre, the same value reported in June, 1998. The median value of individual home sites up to five acres and sites of 10 acres or more suitable for residential sub-divisions was also $5,000 per acre. The median value in 1998 for 5-acre sites was $5,000 per acre. The median value in 1998 for 10-acre sites was $4,500.
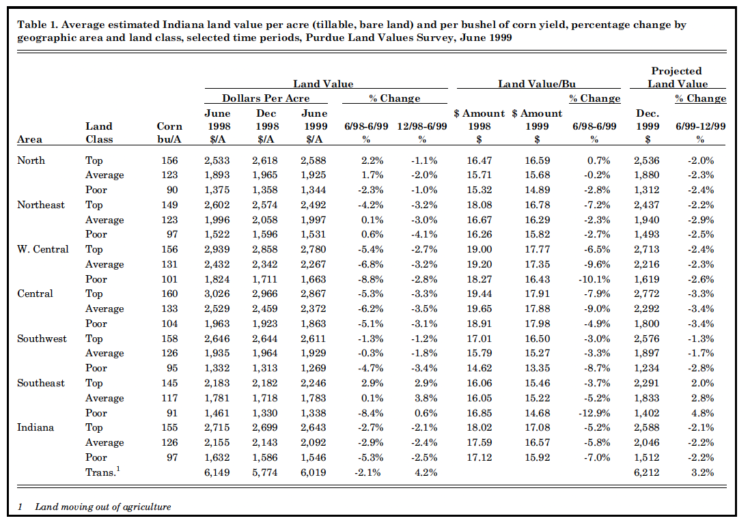
Table 1. Average Estimated Indiana land value per acre (tillable, bar land) and per bushel of corn yield, percentage change by geograhic area and land class, selected time periods, Purdue Land Values Survey, June 1999
Statewide Rents
Cash rents decreased statewide from 1998 to 1999 by $2 per acre on all classes of land (Table 2). The estimated cash rent on top land was $138 per acre, $110 per acre on aver-age land, and $84 per acre on poor land. Rent per bushel of estimated corn yield was $0.89 on top land and$0.87 on average and poor land, down four cents from last year.
Last year’s reported cash rent values set new highs. The previous high was achieved in 1981. Cash rent on top land in 1999 still exceeded by $1 the 1981 level of $137 per acre. Aver-age land exceeded the 1981 value of$106 per acre by $4, while rents on poor land exceeded by $6 the 1981 level of $78 per acre.
Statewide, cash rent as a percentage of estimated land value remained the same or increased, ending seven years of consecutive declines. For 1999, cash rent as a percentage of value remained at 5.2 percent on top land. The value for average land increased to 5.3 per-cent, and the value for poor land increased to 5.4 percent (Table 2).
Area Land Values
Changes in the value of farmland in the six different geographic areas of Indiana (Figure 1) for December 1998 to June 1999, ranged from a 3.8 percent increase for average land in the Southeast to a decrease of 4.1 percent for poor land in the North-east (Table 1). For the December 1998 to June 1999 period, the South-east region reported increases for all land types. All other regions reported declines in value for all land types. In the North, West Central, and Central regions, average land experienced the largest declines. Poor land experienced the largest decline in the Southwest.
For the year ending in June 1999, the change in land values ranged from a 2.9 percent increase in top farmland in the Southeast to a 8.8 percent decline for poor land in the West Central region. In addition to the Southeast, other increases in land values for the year ending in June 1999, were for top land (2.2 percent) and average land (1.7 per-cent) in the North region. The changes in land values for all other regions were declines. The largest decline in land value was for poor land in the West Central region, declining nearly nine percent. The next largest decline was average land in the West Central region.
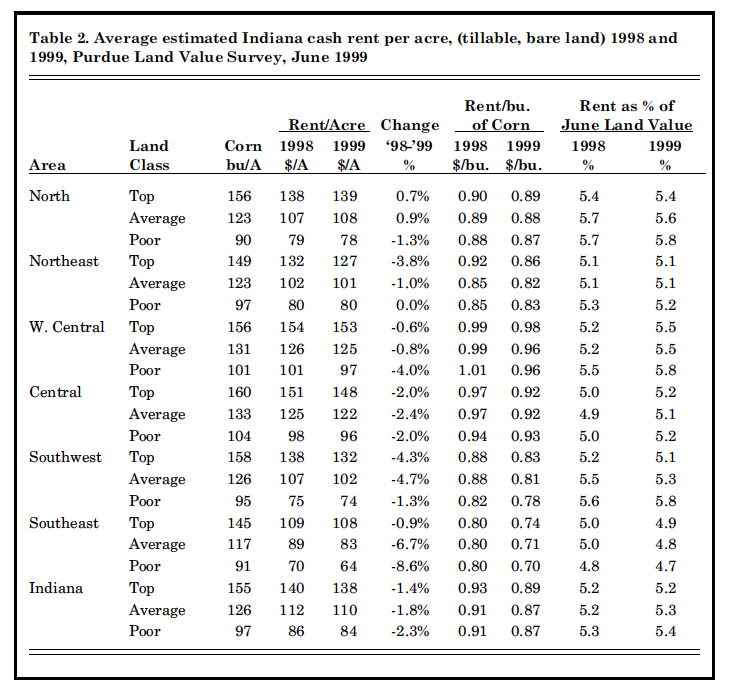
Table 2. Average estimated Indiana cash rent per care, (tillable, bare land) 1998 and 1999, Purdue Land Value Survey, June 1999
The highest valued top-quality land was in the Central area, $2,867 per acre. The next highest values were in the West Central ($2,780), Southwest ($2,611), North ($2,588), and Northeast ($2,492) regions. Reported values for average quality land were $2,372 in the Central and$2,267 in the West Central areas but only around $1,800 to $1,900 in the other areas. Some of the area differences in value reflect the difference associated with the respondents’ estimates of corn yield. For example, average land in the Southeast had a corn yield rating of 117 bushels per acre, in the Southwest 126 bushels per acre, and in the North, 123 bushels; however, the land values per bushel of corn yield estimates were about the same.
Land values per bushel of estimated average corn yield (land value divided by bushels) on top land were in a range between $17.77 to $17.91 for the Central and West Central regions (Table 1) and between $16.50 to $16.78 for the Southwest, North, and Northeast. Land values per bushel declined as land quality (corn yield estimates) declined in all areas except the Central region.
Respondents were asked to estimate rural home sites with no accessible gas line or city utilities and located on a black top or well maintained gravel road. The median value for five-acre home sites was
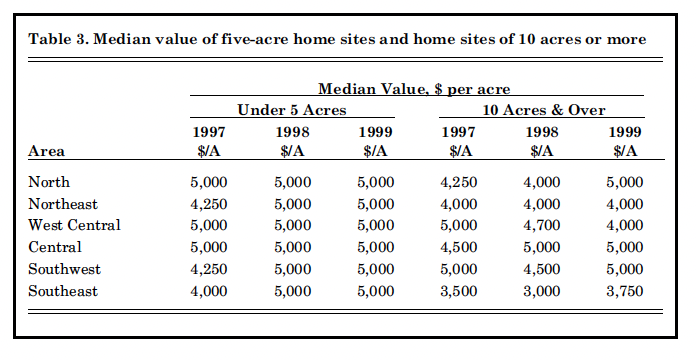
Table 3. Median value of five-acre home sites and home sites of 10 acres or more
$5,000 in all areas (Table 3). These values are the same as those reported in 1998. Estimated per acre median values of the larger tracts (10 acres) ranged from $4,000 to $5,000 except for the $3,750 estimate in the Southeast.
Area Cash Rents
The only region to report increases in cash rents was the North region
(Table 2). Top and average land in this region each increased by only $1 per acre. Poor land in the North region declined by $1 per acre. Declines in cash rents were reported for all other regions and land qualities except for poor land in the Northeast, which remained the same. Last year, declines in four area cash rent values were reported.
The largest declines in cash rent occurred for average and poor land in the Southeast region, declining 6.7 and 8.6 percent, respectively. This was followed by declines of 4.3 and 4.7 percent for top and average land respectively in the Southwest region. Declines in the Central region were in the range of 2.0 – 2.5 percent. Poor land had the largest declines in the North, West Central, and Southeast regions. Top land had the largest decline in the Northeast region and average land had the largest decline in the Central and Southwest region.
Cash rents were again highest in the West Central and Central areas at $153 and $148 per acre, respectively for top land, and $125 and $122 per acre, respectively, for aver-age land. Cash rents of between $0.92 and $0.98 per bushel were also highest in these areas. The
per-bushel rent for top land was 89¢in the North, 86¢ in the Northeast, 83¢ in the Southwest, and 74¢ in the Southeast. In all areas, rates per bushel within areas varied by 5¢ or less by land quality.
Except for the Southeast, cash rent as a percentage of land value increased or remained the same for all land classes. In the Southeast, rent as a percentage of land value continued to decline.
Land Market Activity
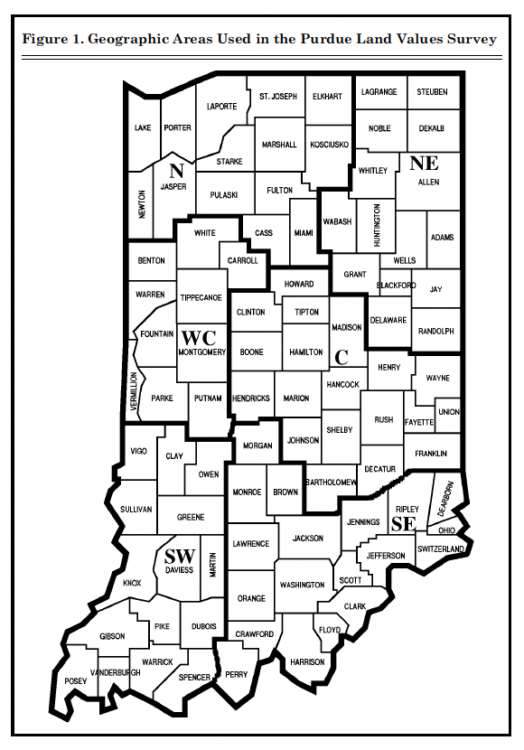
Figure 1. Geographic Areas Used in the Purdue Land Value Survey
A reduced number of farmland transfers is often the land market’s response to a decline in expected returns. While the survey does not provide strong evidence that transfer numbers are declining, survey respondents indicated that some reduction in the number of transfers may be occurring. The number of farmland transfers in the six months ending in June compared to a year earlier was estimated to be up by 22 percent of the respondents versus 34 percent last year. No change in the number of transfers was reported by 48 percent of the respondents, while 30 percent (compared to 20 percent in 1998) indicated a reduction in the number of transfers.
More land was thought to be on the market now by 15 percent of the respondents. Last year, 19 percent of the respondents indicated more land was thought to be on the market, and in 1997, 12 percent of the respondents indicated more land was thought to be on the market.
Respondents were asked their perception of items that might be influencing the supply of land on the market compared to a year earlier. The number of retiring or retired farmers selling land was identified by 33 percent of the respondents as a reason for an increased supply. The expectation that land values have peaked was identified by 38 percent of the respondents as a reason for the increased supply of farmland for sale, and 39 percent of the respon-dents indicated that reduced profit expectations were a reason for an increasing supply of farmland.
Respondents were also asked to provide their perceptions of how the purchasers of farmland had changed from a year earlier. Demand from farmers was said to have increased by 15 percent of the respondents, while 39 percent of the respondents indicated that farmer demand had declined. In 1998, 39 percent of the respondents indicated an increase in farmer demand, while 16 percent indicated a decline.
Nearly everyone (87 percent) indicated an increase in demand for rural residences. Less than one per-cent of the respondents indicated a decrease in demand for rural residences, while 12 percent indicated no change. Twenty-five percent of the respondents indicated that individual nonfarm investors in farmland had increased, while 20 percent indicated that this source of demand had decreased. In 1998, 32 percent of the respondents indicated an increase from individual nonfarm investors, while 13 percent indicated a decrease in demand from individual nonfarm investors.
The purchase of farmland by pension funds and other large investors is always a topic of discussion. Six percent of the respondents indicated that, compared to a year ago, demand from this source had increased, 35 percent indicated a decrease, and 59 percent indicated no change. In 1998, the number indicating an increase was about the same, at five percent, but the number indicating a decrease was only six percent, compared to the 35 per-cent this year.
Land Value/Cash Rent Multiples
While the recent change in land value has a strong influence on land value’s future direction, the returns to a land investment must also be considered. One way to assess the relationship between the return to land and land values is to observe the land value/cash rent multiple. This is similar to the “price/earnings ratio” often referred to by stock market analysts. For example, data from the 1999 Purdue survey indicates a value/rent multiple of 19.0 ($2,092/$110 = 19.0). Is this figure abnormally high, thus suggesting that land values are too high? To answer this question we need to have an estimate of what is “normal.”
For the period 1975 to 1999, the value to rent multiple has ranged from a low of 12.4 in 1986 to a high of 20.6 in 1979 (Figure 2). Over the 1975 to 1999 period, the value to rent multiple averaged 16.0 with a standard deviation of 2.5. At a multi-ple of 19.0, the value to rent multiple is in a range similar to the 1978 to 1981 period. If one assumes that the value to rent multiple is normally distributed, this means there is only a 13-percent chance that a higher value will be achieved. Or looking at it from the other side, there is an 87-percent chance of a lower value to rent multiple. Since 1975, the land value to rent multiple has exceeded 19.0 in only five years (1978-1981 and 1998), indicating that the value to rent multiple is more likely to decline than increase.
There are three ways the value to rent multiple could decline. One is for rent to remain fairly constant and land value to decline. An alternative would be a fairly constant land value and increasing rent. The third alternative would be a combination of both land value and rent changes. Which scenario unfolds will depend on several factors explored in the following section.
Farmland Value Outlook
The fact that average Indiana farm-land values declined for the year ending in June 1999, bringing to a close an 11-year period of increases, raises the question, “Will land values continue to decline?” Certainly, low crop prices will place downward pressure on farmland values. But at the same time, low interest rates and prospects of increased government income support provide positive influences.
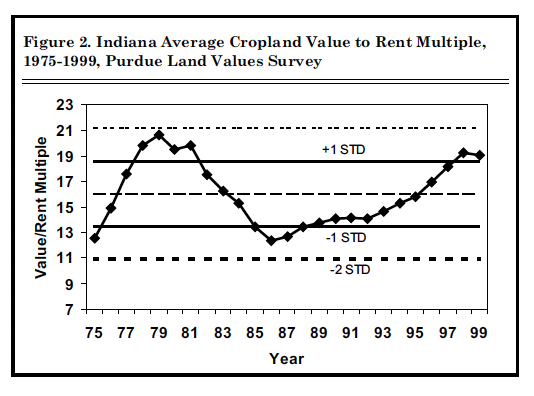
Figure 2. Indiana Average Cropland Value to Rent Multiple 1975-1999, Purdue Land Values Survey
The respondents’ optimism regarding the general trend in land during the June to December period continues to decline. In 1997, 54 per-cent of the survey respondents expected some or all classes of land to increase. In 1998, this percentage dropped to 28 percent and stands at 19 percent this year. In 1997, only six percent of the respondents expected a decline in values. In 1998, 26 percent of the respondents expected some or all types of land values to decline. This year, 38 per-cent of the respondents expect a decline. Thirty-five percent of the respondents expect land values to remain the same, a percentage simi-lar to the 38 percent in 1997 and the 39 percent in 1998.
When asked to project land values for December 1999, respondents reported declines in value for all land types and all areas of the state except the Southeast region. For the southeast, top land was expected to increase 2.0 percent, average land 2.8 percent, and poor land 4.8 per-cent. The largest declines were expected in the central region (Table 1). Compared to last year, when there was no strong consensus regarding the future direction of land values, this year points towards continued short-term declines, except in the Southeast. These projections in the past have accurately predicted direction, but have not been a good indicator of the actual magnitude of change.
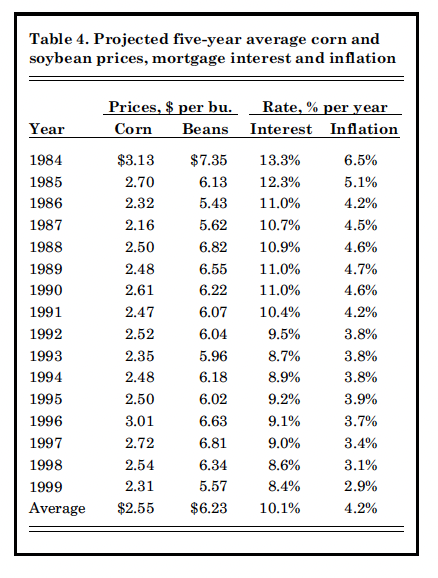
Table 4. Projected five-year average corn and soybean prices, mortgage interest and inflation
When asked about their longer run expectations over the next five years, about 51 percent of the respondents predicted that land values would increase. The remain-ing 49 percent were divided between expecting a decline (25 percent) or no change (24 percent). In last year’s survey, the number of respondents expecting an increase was 65 per-cent, and the number expecting a decline or no change was only 35 per-cent. On average, respondents expected a small increase of two per-cent for the five years. In 1998, respondents expected land values for the five-year period to increase 4.4 percent, and in 1997 they were expecting a 10-percent increase.
Expectations regarding intermediate crop prices have a strong influence on farmland values because of their impact on the return to the land investment and their impact on the cash flows associated with the investment purchase. In order to gain some insight into the income level expected from a land purchase, respondents were asked to estimate annual average prices over the next five years for corn and soybeans. Respondents have made projections since 1984 (Table 4).
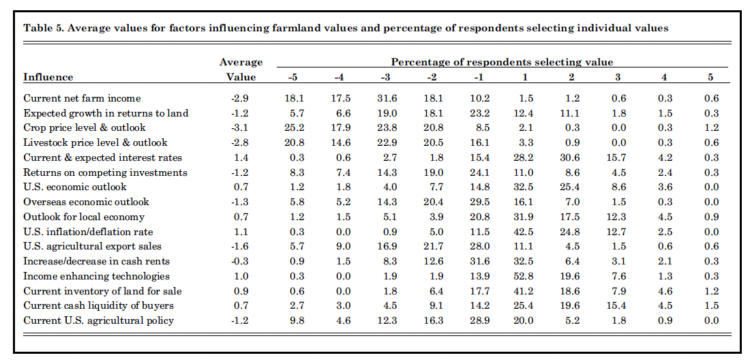
Table 5. Average values for factors influencing farmland values and percentage of respondents selecting individual values
A 23¢-decrease occurred in the expected five-year average price of corn. This year the expected
five-year average price of soybeans declined 77¢. Gross revenue expectations for 126 bushel corn yields and 45 bushel beans in a 50-50 rotation declined $32 per acre from last year. To the extent that land market participants have similar reduced expectations, this reduction in revenue expectations will exert downward pressure on land values.
Other important factors associated with a land purchase include the expected farm mortgage interest rate and the rate of inflation. As mortgage rates decline, the cash flow subsidy that is often required by a land purchase is less. This is the eighth consecutive year that expected farm mortgage interest rates have remained under 10 per-cent and inflation under four percent.
In an effort to gain additional insight into how various factors influence land values, survey respondents were asked to score 16 different influences of farmland value
(Table 5). The value given to each influence could range from a –5 to a+5. The –5 indicates a strong negative influence on farmland values, and a +5 indicates a strong positive influence. The average value for each influence and the percentage of respondents selecting each value is presented in Table 5.
Positive influences included current and expected interest rates, the outlook for the U.S. and local economies, income-enhancing technologies, current land inventories, and the cash liquidity of buyers. While there were several positive influences, none of these factors received a high average rating. With the exception of current and expected interest rates and U.S. inflation/deflation, the positive influ-ences received an average score of 1 or less.
It was not surprising to find crop and livestock price levels, current farm income, exports, and the out-look for overseas economies as major negative influences. Current net farm income and the crop and live-stock price levels and outlook received average scores between –3.1 and –2.8. Only one of the negative influences, the increase/decrease in cash rents, received an average score between 0 and –1.
While the average value provides some indication of the importance of the influence, the distribution of the respondents indicates the level of agreement among respondents regarding the weight of the influence. For example, the U.S. inflation/deflation rate received an average weight of 1.1, and 67 percent of the respondents gave it a weight of 1 or 2. The expected growth in returns to land received a –1.2 aver-age weight, but the values selected were not as concentrated as for the U.S. inflation/deflation rate.
If the opinions of the respondents are representative of other farmland market participants, this would indicate that further reductions in land values are likely. To assess the potential decline in farmland values, let’s consider a possible scenario. Assume that over the next several years cash rent for average land is expected to average $104 per acre, about five percent less than the cur-rent estimated cash rent and about$3 less than the average cash rent for the last five years. Let’s also assume that the value to rent multiple moves closer to its mean by declining by 6.5 percent.**** This would make the value to rent multiple 17.8. Using the estimated cash rent of $104 per acre and the estimated value to rent multiple of 17.8, gives a farmland value of $1,851. This value is 12-percent less than the 1999 value reported for average Indiana farmland.
This is one possible scenario. There are many uncertainties, and thus many other possible future scenarios that could unfold. At this time, the negative influences appear to outweigh the positive influences, and in the short term land values can be expected to decline. It appears likely that this year will result in an abundant U.S. crop of corn and soy-beans. However a crop shortage in other parts of the world can cause the commodity price picture to change quickly. While difficult times often present opportunities, this is a time to be cautious when bidding on farmland to purchase or cash rent. This is a time when developing a plan can have big rewards. It is also a time to develop contingency plans just in case the future we see does not materialize.
The land values survey was made possible by the cooperation of professional farm managers, appraisers, brokers, bankers, county extension educators, and persons representing the Farm Credit System, the Farm Service Agency (FSA) county offices, and insurance companies. Their daily work requires that they stay well-informed about land values and cash rents in Indiana. The authors express sincere thanks to these friends of Purdue and Indiana agriculture. They provided 374 responses representing all Indiana counties. We also express appreciation to Carolyn Hunst of the Department of Agricultural Economics for her help in con-ducting the survey.
* In 1998, 52 percent of the respondents reported that some or all classes of land increased in value from December 1997 to June 1998.
** In 1998, 13 percent of the respondents reported that some or all classes of land declined in value from December 1997 to June 1998.
*** Transitional land is land that is moving out of agriculture.
**** For the period of 1975 to 1999, the value to rent multiple declined eight times. The 6.5 per value is the average of these declines.
![]()
![]()
![]()
![]()
![]()
