Indiana Land Values Increase
August 1, 1988
PAER-1988-1
Authors: J.H. Atkinson, Professor of Agricultural Economics, and Kim Cook
Note: The charts in this article were taken from physical copy scans – as the original documents no longer exist. These versions are very blurry – we apologize in advance for the quality.
A year ago, a majority of the Purdue land values survey respondents felt land values were at or near their low point. Apparently, they were correct. The USDA reported that Indiana land values increased 6 percent in the year ending February 1. The Federal Reserve Bank of Chicago has reported quarterly gains in land values for several quarters. A majority of farmers polled at Extension meetings last winter felt that land values had bottomed and were increasing. The 1988 Purdue land values survey provides evidence that the upward trend in Indiana farmland values continued during the first part of 1988.
The land values survey was made possible by the cooperation of professional managers, appraisers, brokers, bankers, and persons representing the Farm Credit System, the Farmers Home Administration, and insurance companies. Their daily work makes them the experts on land values and cash rent in Indiana. To these friends of Purdue and Indiana agriculture, sincere thanks are expressed. They provided more than 300 responses representing most of Indiana’s counties. Appreciation is also expressed to Julie Frey of the Department of Agricultural Economics for her help in conducting the survey.
Statewide Land Prices and Rents
Results of the survey indicate statewide average increases for the 6 months ending in June 1988 of 5.9 percent on top land, 5.4 percent on average land, and 4.8 percent on poor land (Table 1). Seventy percent of the respondents reported that most classes of land increased during the 6-month period, under 5 percent reported declines, and about a fourth felt there was no change in land values (Table 2). Last year, 40 percent of the respondents indicated declines in land values.
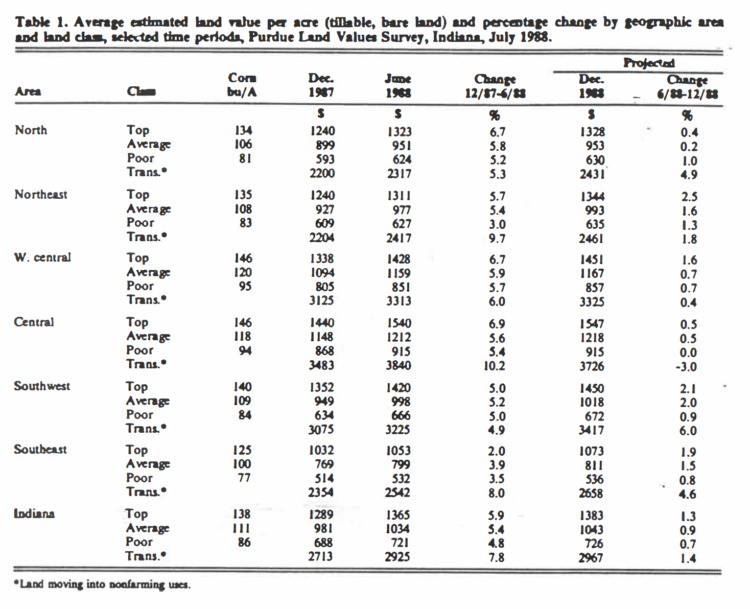
Table 1. Average estimated land value per acre (tillable, bare land) and percentage change by geographic area and land class, selected time periods; Purdue Land Survey, Indiana, July 1988

Table 2. Percentage of respondents reporting specified trends in land values from December 1987 to June 1988, Purdue Land Values Survey, Indiana, July 1988
The statewide increase in value for the year-ending in June 1988 was 14.1 percent on top land, 13.3 percent on average land, and 12.1 percent on poor land (Table 3).
The USDA land value estimates indicate that February 1988 values are still less than half the values of 1981. The Purdue survey also shows this on average and poor land, but top land is now valued at slightly more than half the 1981 value.
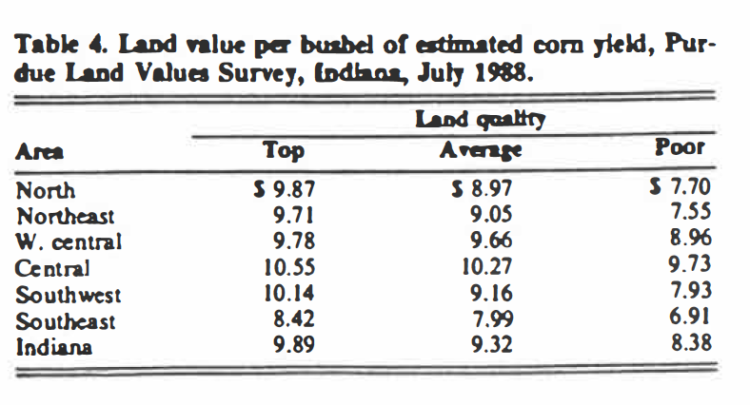
Top quality land had an average estimated value of $1,365 per acre (Table 1) or $9.89 per bushel for the 138-bushel estimated long term yield (Table 4). Average land (11-bushel yield) was valued at $1,034 per acre, while the 86-bushel poor land was estimated to be worth $721 per acre. Land values per bushel of yield estimate were $9.32 on average land and $8.38 on poor land. These figures were 90c to $1.21 more than last year.
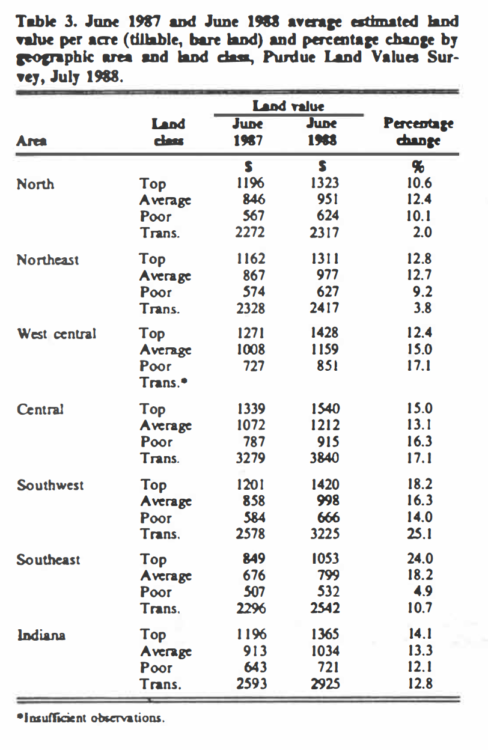
Table 3. June 1987 and June 1988 average estimated area land value per acre (tillable, bare land) and percentage change by geographic area and land class, Purdue Land Survey, July 1988
The value of land moving into nonfarm uses was estimated to have a value of $2,925 per acre in June 1988, up 13 percent for the year (Table 3) with over half of that increase coming over the last 6 months of the period. Relatively few persons report on transition land values, the range in estimates is quite wide and the reliability of the averages is not as good as with farmland.
Cash rents increased statewide from 1987 to 1988 by about 7 percent on top and average land and nearly 10 percent on poor land (Table 5). The USDA reported no change in the $77 per acre cash rent for cropland which was identical to the Purdue estimate for average land. Rent per bushel of estimated yield was 70c, 69c, and 66c respectively for top, average, and poor land or 4c to 6c more than the 1987 estimates. Cash rents were still under 1981 levels by more than a fourth.
Cash rent as a percentage of estimated land value declined slightly for the second year in a row (Table 5). This figure is a little over 7 percent for average and top-quality land and nearly 8 percent on poor land. In 1981 these figures were around 5 percent.
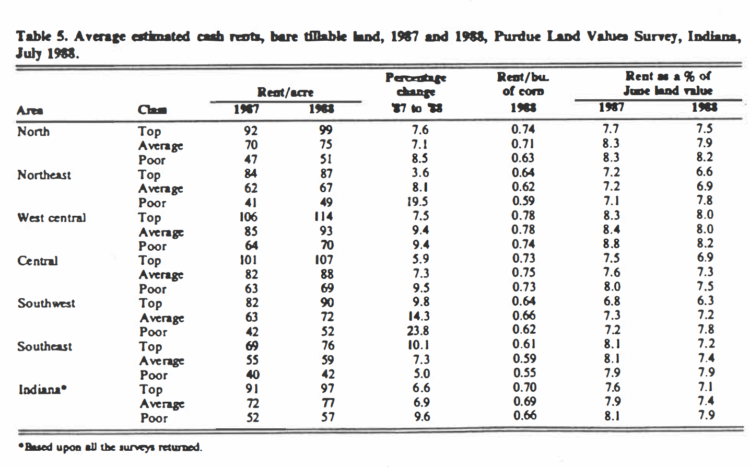
Table 5: Average estimated cash rents, bare tillable land, 1987 and 1988, Land Values Survey, Indiana, July 1988
Area Estimates
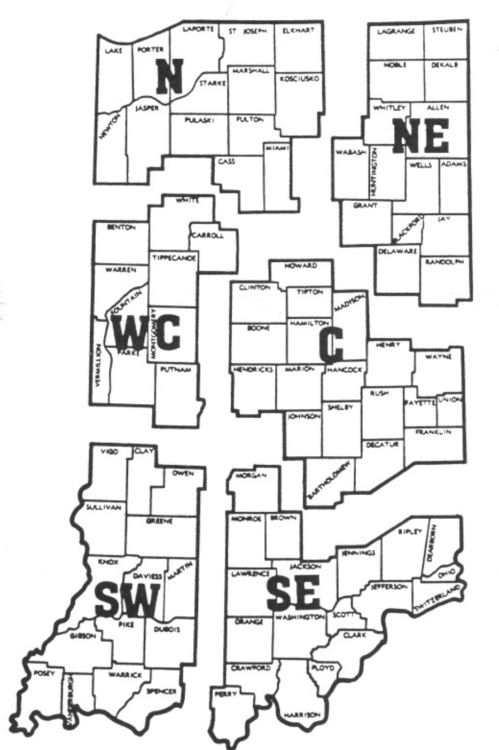
Farmland value increases from December 1987 to June 1988 were mostly 5 percent to 7 percent in all areas (Figure 1) other than the southeast which had 2 percent to 4 percent increases. Except in the two southern areas, and the northeast, there was a tendency for land value increases over this 6-month period to be greater as land quality increased.
The percentage of respondents reporting some or all classes of land to have increased in market value since last December was 83 percent in the north, 70 percent in the northeast, 74 percent in the west central and central areas, 63 percent in the southwest, and only 48 percent in the southeast (Table 2). Unlike last year when a fourth to over half of the area respondents reported declining land values, virtually no one felt values had declined from December to June except in the northeast where 13 percent of the respondents reported declines.
For the year ending June 1988, top and average quality land in the northern and central areas
increased from 11 to 15 percent (Table 3). In the southeast, top land was reported up an average of 24 percent, while average land increased 18 percent, as did top land in the southwest. In contrast, poor land in the southeast increased by only 5 percent. In the central and west central areas, poor land increased in value more than average land. The opposite was true in all other areas. These apparent inconsistencies might be caused by unsettled market conditions from last fall to late winter or spring. During that time, there were conflicting opinions as to how much land values had increased, where the greatest increases were taking place and on what quality of land. Land values in the southern part of the state appear to have increased more rapidly over the past 12 months than in the northern areas.
The central area again had the highest land values per acre as well as per bushel of estimated yield (Table 4). Top land, with an estimated long-term yield of 146 bushels of corn per acre, was valued at an average of $1,540 per acre in the central area or $I0.55 per bushel. In several areas, top land was valued around $10 per bushel of estimated yield with average land a dollar per bushel less; however, the slight difference of 12c in the west central area raises the question of whether average land is over-priced relative to top land.
Cash rents increased in all areas of the state, but the increases varied considerably by area and land quality (Table 5). Average area increases on top and average land fell mostly in the range of 7 percent to 10 percent. Big increases in some areas on poor land may be the result of the combined effects of the Conservation Reserve Program and stronger bean prices early this year.
Although land values were highest in the central area, cash rents were highest in the west central area, $114 per acre on top quality land or 78c per bushel. In the north, west central and central areas rents on top and average land were 71c to 78c. The range in other areas was 59c to 66c.
There was little difference in the rent per bushel on top and average land although budget analysis indicates that a difference of 10c per bushel or more could be justified in many situations between average and top-quality land.
Cash rent as a percent of the value of top and average land fell in all areas. This percentage was highest in the west central area (around 8 percent) and lowest on top land in the southwest (6.3 percent). The USDA reported that 1988 rent in Indiana was 7.2 percent of cropland value, very near the statewide 7.4 percent on average land reported in the Purdue survey.
What of the Future!
Survey respondents were more optimistic than they were a year ago. This year, the percentage of respondents expecting higher land prices by December jumped to 43 percent from 26 percent last year. Only 14 percent expect lower land values, and 42 percent think there will be no change.
The group average amount of expected increase in land values was small: under 1 percent statewide on average land, a little more on top land, and a bit less on poor land (Table I). Increases were expected in all areas with averages from under I percent to 2.5 percent on top land in the northeast.
Nearly 90 percent of the 1988 respondents, in contrast to 82 percent last year, expect land values to be higher 5 years hence. The group average change was 15 percent this year and 12 percent last year. Respondents were asked to estimate annual averages over the next 5 years for corn and soybean prices, farm mortgage interest rates and the rate of inflation. Their responses since 1984 are shown below:
The biggest changes in these 5-year expectations were the jump of over a dollar a bushel in soybean prices and a 34c increase in com prices. These changes imply an increase in per acre revenues from last year’s expectations of $35 to S40 on typical Indiana land. It is surprising that such a change was accompanied by an expected increase in land values of only 15 percent in 5 years.
Most of the responses were received by late June. Although the drought was a major concern during June, conditions continued to worsen, and the replies do not fully reflect this. How will reduced yields affect land prices? Increased amounts of land on the market may come as a result of sales by financially stressed farmers, less cash from 1988 farming operations may force a postponement in land purchase plans of some farmers. The fear of another dry year may make some more cautious. These arc factors that could cause short-term weakness in land prices. On the other hand, the effects of having reduced grain stocks, especially wheat and corn, could be felt in the form of higher prices over the next couple of years or more.
It would not be surprising to see stable to slightly lower land prices until after harvest when the full effects of the drought will be known. Some farmers who end up with fair yields may find themselves in about as good a financial condition as they would have been with normal yields and lower prices. Others may find that they are not as bad off as they had feared once crops are in and government assistance is paid. In such situations, thoughts of the possibility of $3 corn and $10 beans may spark an increased interest in land purchase and a resumption of price increase.
There may be upward pressure on cash rents, especially in areas of fair crops. But in some areas of the state, payment of the second installment of rent may be difficult. Landlords may have to work out some way to defer this payment and help the tenant to obtain financing for 1989. Increasing rent under these circumstances will be difficult. Unfortunately, there may be tenants who will not be able to reach an agreement to continue farming the land. Others may need to shift to share rent or grow the crops on a custom basis.
