2000 Indiana Land Values Rise
September 1, 2000
PAER-2000-13
Craig L. Dobbins, Professor and Kim Cook, Research Associate
![]()
![]()
![]()
![]()
![]()
The 2000 Purdue Land Values Survey indicates that the value of an acre of average bare Indiana cropland was$2,173 per acre in June 2000. This was $81 more than the value reported in June 1999, a 3.9 percent increase. This increase more than off-sets the 2.9 percent decline that was reported in 1999. Cash rents increased from 1999 to 2000 on aver-age land by a little less than 2 per-cent to $112 per acre. This is the same per acre value reported in 1998.
Statewide Land Values
For the six months ending in June 2000, the value of bare tillable land was reported to have increased 0.9 percent on top land, 0.6 percent on average land, and 0.6 percent on poor land (Table 1). While only a small upward change, these numbers indicate that the declines reported last year have not continued.
While statewide land values moved higher for this six-month period, local conditions always exert important influences. Thirty-two percent of the survey respondents indicated that all classes of land were the same or higher during the December 1999 to June 2000 period. This was an increase from 24 percent of the respondents in last year’s report. Thirteen percent of the respondents indicated that some or all classes of land fell in value during the same six-month period.*
Forty-four percent indicated that land values remained unchanged during the six-month period.
The statewide 12-month increase in average value from June 1999 to June 2000 was 3.9
percent (Table 1). Top-quality land 157 bushel corn yield rating) was estimated to have increased by $72 per acre to $2,715 (Table 1). Average land (127 bushel corn yield rating) was valued at $2,173, an increase of$81, while poor land (98 bushel corn yield rating) was estimated to be worth $1,630 per acre, an increase of $84.
The land value per bushel of corn yield rating also increased this year. For top-quality land, the value per bushel of yield was $17.28, up by 1.2 percent. Average quality land value was $17.04 per bushel, while the poor quality value was $16.70 per bushel (Table 1). The percentage increases were 2.8 percent on aver-age land and 4.9 percent on poor land. These per-bushel figures are$0.20 higher than last year on top land, $0.47 higher on average land, and $0.78 higher on poor land.
The value of transition land** also exhibited increases. The average value of transitional land in June 2000 was $6,532, an increase of 8.5 percent from June 1999. For the six-month period from December 1999 to June 2000, transitional land increased by $138 per acre, 2.2 per-cent (Table 1). However, due to the wide variation in estimates (from $1,000 to $30,000 in June, 2000), the median value may give a more meaningful picture than the arithmetic average. The median value of transitional land in June, 2000 was$5,000 per acre, the same value reported in June, 1999.

Table 1. Average Estimated Indiana Land Value Per Acre (Tillable, Bare Land) and Per Bushel of Corn Yield, Percentage Change by Geographic Area and Land Class, Selected Time Periods, Purdue Land Values Survey, June 2000
Statewide Rents
Cash rents increased statewide from 1999 to 2000 by $2 per acre on all classes of land (Table 2). The estimated cash rent on top land was $140 per acre, $112 per acre on aver-age land, and $86 per acre on poor land. Rent per bushel of estimated corn yield was $0.89 on top land and$0.88 on average and poor land. This value is the same as 1999 for top land and is a 1¢ increase for average and poor land.
Statewide, cash rent as a percentage of estimated land value remained the same or decreased. For 2000, cash rent as a percentage of value was 5.2 percent on top and average land. The value for poor land decreased to 5.3 percent (Table 2).
Area Land Values
Changes in the value of farmland in the six different geographic areas of Indiana (Figure 1) for December 1999 to June 2000, ranged from a -2.1 percent decrease for poor land in the Southwest to an increase of 5.1 percent for average land in the Southeast region (Table 1). For the December 1999 to June 2000 period, the Southeast, Central, and North regions reported increases for all land types. The Southeast region reported the strongest increases. The Southwest reported declines for all land types. In the Northeast and West Central regions, small declines were reported for poor land, and small increases were reported for top and average land.
For the year ending in June 2000, the change in land values ranged from a 2.7 percent decline in top farmland in the Southeast region to a 9.2 percent increase for poor land in the Central region. All regions except the West Central region reported strong increases in some or all land types for the year ending in June 2000. The changes in land values for West Central Indiana were still positive, but smaller than those reported in other regions. The decline in land value was for top land in the Southeast region, declining 2.7 percent.
The highest valued top-quality land was in the Central area, $3,006 per acre. The next highest values were in the West Central ($2,786), Southwest ($2,663), North ($2,638), and Northeast ($2,630). Reported values for average quality land were$2,519 in the Central and $2,289 in the West Central areas but only around $1,800 to $2,100 in the other areas.
Land values per bushel of estimated average corn yield (land value divided by bushels) on top land were$17.61 and $18.43 for the West Central and Central regions (Table 1) and between $16.54 and $16.96 for the Southwest, North, and North-east. The Southeast had the lowest land value per bushel at $15.35.
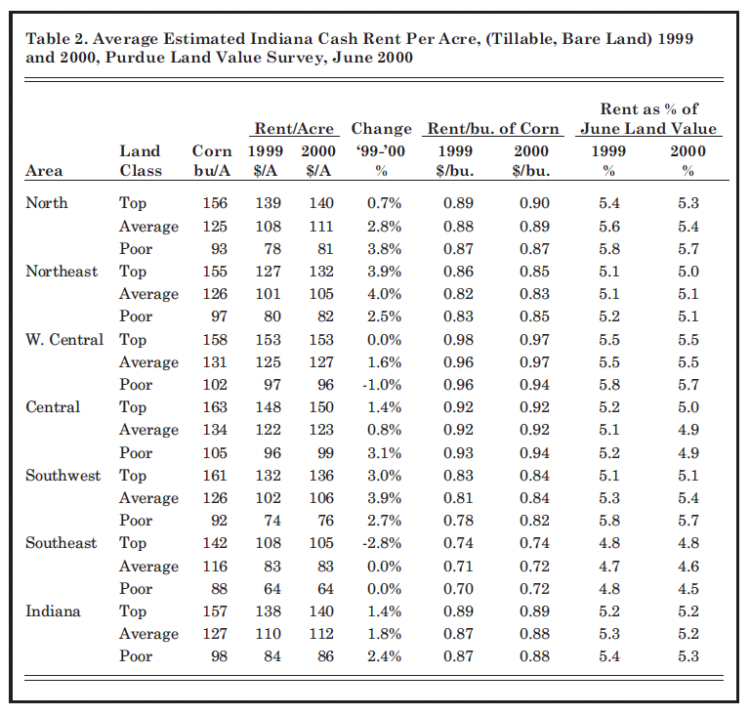
Table 2. Average Estimated Indiana Cash Rent Per Acre, (Tillable, Bare Land) 1999 and 2000, Purdue Land Value Survey, June 2000
Respondents were asked to estimate rural home sites with no accessible gas line or city utilities and located on a black top or well-maintained gravel road. The median value for five-acre home sites was $5,000 in all areas except the Central region, where the median was
$6,000 per acre (Table 3). Estimated per acre median values of the larger tracts (10 acres) ranged from $4,000 to $5,500.
Area Cash Rents
All regions except the Southeast reported increases in cash rents for the year (Table 2). This is a sharp contrast to last year’s survey, in which only the North region reported cash rent increases. In the South-east, a decline of 2.8 percent was reported for top land, and no change was reported for average and poor land. The only other cash rent decline reported was for poor land in the West Central region.
The largest percentage increase in cash rent occurred for average land in the Northeast region, increasing 4.0 percent. This was followed by an increase of 3.9 percent for top land in the Northeast and average land in the Southwest region.
Cash rents were again highest in the West Central and Central areas at $153 and $150 per acre, respectively, for top land, and $127 and $123 per acre, respectively, for aver-age land. Cash rents per bushel for the Central and West Central regions ranged from $0.92 to $0.97. These were also the highest in the state. The per-bushel rent for top land was 90¢ in the North, 85¢ in the Northeast, 84¢ in the Southwest, and 74¢ in the Southeast. In all areas, rates per bushel within areas varied by 3¢ or less by land quality.
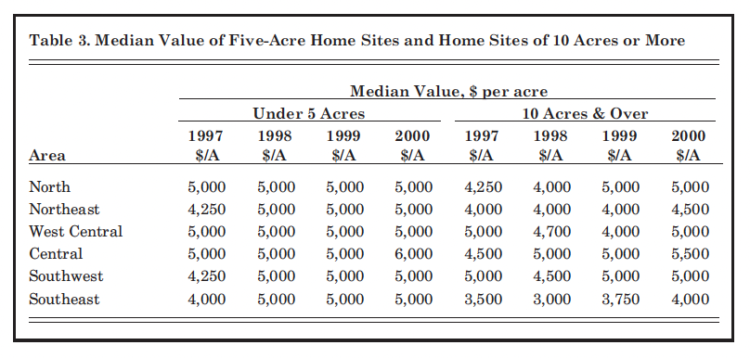
Table 3. Median Value of Five-Acre Home Sites and Home Sites of 10 Acres or More
Land Market Activity
In a period of low commodity prices in which there are only a few “must sell” transactions, there is often a reduced number of farmland transfers. In effect, price is maintained by limiting supply. While the survey does not provide strong evidence that transfer numbers are declining, sur-vey respondents indicated that some reduction in the number of transfers may be occurring. The number of farmland transfers in the six months ending in June compared to a year earlier was estimated to be up by 20 percent of the respondents. In 1999, 22 percent of the respondents indicated an increase in transfers. In 1998, 34 percent indicated an increase. No change in the number of transfers was reported by 51 percent of the respondents, while 28 percent (compared to 30 percent in 1999 and 20 percent in 1998) indicated a reduction in the number of transfers. Less land was thought to be on the market by 37 percent of this year’s respondents. More land was thought to be on the market now by 11 per-cent of this year’s respondents.
Respondents were asked to pro-vide their perceptions of how the purchasers of farmland had changed from a year earlier. Demand from farmers was said to have increased by 26 percent of the respondents, while 17 percent of the respondents indicated that farmer demand had declined. In 1999, 15 percent of the respondents indicated an increase in farmer demand, while 39 percent indicated a decline.
Nearly everyone (83 percent) indicated an increase in demand for rural residences. Less than three percent of the respondents indicated a decrease in demand for rural residences, while 15 percent indicated no change. Thirty-two percent of the respondents indicated that individual nonfarm investors in farmland had increased, while 19 percent indicated that this source of demand had decreased. In 1999, 25 percent of the respondents indicated an increase from individual nonfarm investors, while 20 percent indicated a decrease in demand from individual nonfarm investors.
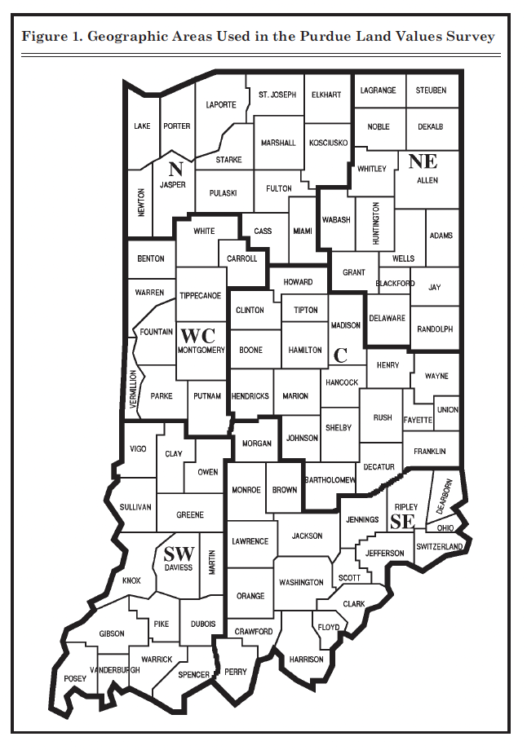
Figure 1. Geographic Areas Used in The Purdue Land Values Survey
The purchase of farmland by pension funds and other large investors is always a topic of discussion. Compared to a year ago, 8.0 percent of the respondents indicated that demand from this source had increased, 28 percent indicated a decrease, and 64 percent indicated no change. These are similar to the numbers reported in 1999, when 6.0 percent of the respondents indicated an increase and 35 percent indicated a decrease.
Land Value/Cash Rent Multiples
While the recent change in land value has a strong influence on land value’s future direction, the annual return to a land investment must also be considered. One way to assess the relationship between the annual return and land values is to observe the land value/cash rent multiple. This is similar to the “price/earnings ratio” often referred to by stock market analysts. For example, data from the 2000 Purdue survey indicates a value/rent multiple of 19.4 ($2,173 ÷ $112 = 19.4). Is this figure abnormally high, thus suggesting that land values are too high? To answer this question we need to have an estimate of what is “normal”.
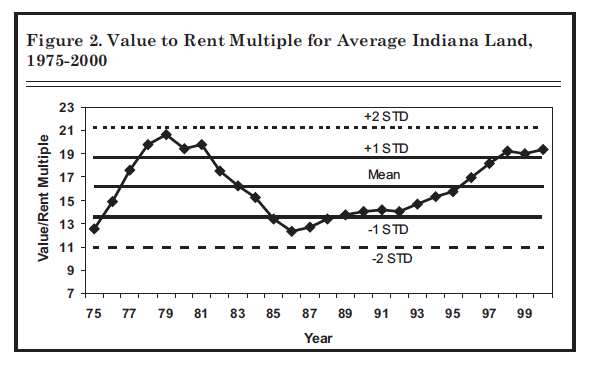
Figure 2. Value to Rent Multiple for Average Indiana Land, 1975-2000
For the period 1975 to 2000, the value to rent multiple has ranged from a low of 12.4 in 1986 to a high of 20.6 in 1979 (Figure 2). Over the 1975 to 2000 period, the value to rent multiple averaged 16.2, with a standard deviation of 2.6. At a multiple of 19.4, the value to rent multiple is in a range similar to that in the 1978 to 1981 period. If one assumes that the value to rent multiple is normally distributed, this means there is only a 11-percent chance that a higher value will be achieved. Or looking at it from the other side, there is an 89-percent chance of a lower value to rent multiple. Since 1975, the land value to rent multiple has exceeded 19.0 in seven years (1978-1981 and 1998-2000), indicating that the value to rent multiple is more likely to decline than increase.
Farmland Value Outlook
The decline in land values last year raised the question, “Will land values continue to decline?” This year’s survey indicates the answer is “no.” Low crop prices place downward pressure on farmland values. But at the same time, increasing yields and increased government income support provide positive influences.
However, the survey respondents were pessimistic about any further increases in land values during the period of June to December 2000. When asked to project land values for December 2000, respondents reported declines in value for all land types in the North, Northeast, and Southwest regions. Strong increases in land values in the Southeast were expected. For the Southeast, top land was expected to increase 2.2 percent, average land 2.1 percent, and poor land 2.9 percent. The largest declines were expected in the North-east region (Table 1). Land values in the Central and West Central regions were expected to remain the same. These projections in the past have accurately predicted direction, but have not been a good indicator of the actual magnitude of change.
Longer term, respondents were more optimistic. When asked where they expected land values to be five years from now, 67 percent of the survey respondents expected land values to increase. The remaining 33 percent were divided between expecting a decline (11 percent) or no change (22 percent). In last year’s survey, the number of respondents expecting an increase was 51 per-cent, and the number expecting a decline or no change was 49 percent. On average, respondents expected an increase of 9.0 percent for the five years. In 1999, respondents expected land values for the five-year period to increase 2.0 percent.
Expectations regarding intermediate crop prices have a strong influence on farmland values because of their impact on the return to the land investment and their impact on the cash flows associated with the investment purchase. In order to gain some insight into the income level expected from a land purchase, respondents were asked to estimate annual average prices over the next five years for corn and soy-beans. Respondents have made these projections since 1984 (Table 4).
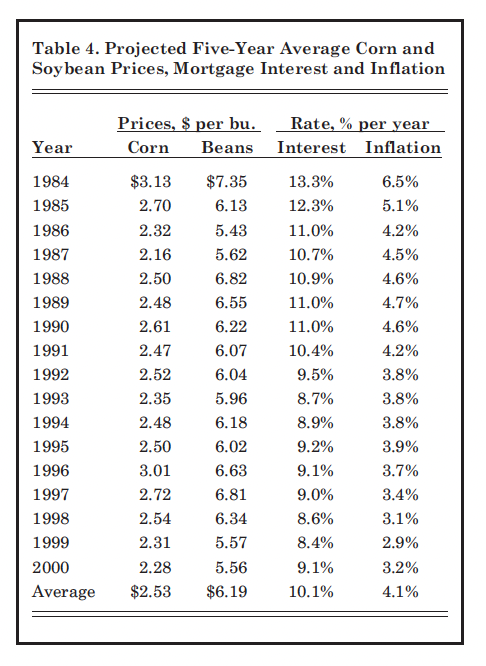
Table 4. Projected Five-Year Average Corn and Soybean Prices, Mortgage Interest and Inflation
A decrease occurred in the expected five-year average price of corn and soybeans. However, these changes, 3¢ for corn and 1¢ for soy-beans are small compared to the decline of 77¢ for soybeans and 23¢for corn reported in 1999. To the extent that land market participants have similar reduced expectations, these low price expectations will exert downward pressure on land values.
Other important factors associated with a land purchase include the expected farm mortgage interest rate and the rate of inflation. The estimated interest rate increased this year, the first estimated increase in four years. As mortgage rates increase, the cash flow subsidy that is often required by a land purchase will increase. If long-term interest rates continue to rise, this will add increased downward pressure on land values.
In a market that, over the last several years, has been characterized by either a series of increases or declines (Figure 3), the land market seems unsure about the direction in which it should go. At the current time, low grain prices, increasing petroleum prices, and increasing interest rates point toward lower land values and cash rents. Improved profits from hog and beef enterprises, increased government payments, and the continued strength of the general economy with its demand for country home sites and recreational land point toward high land values and cash rent.
Like last year, low grain prices and rising costs seem to call for downward adjustments in land value and cash rent. Will a decline occur? If the Federal Reserve continues to increase interest rates to slow the general economy and fuel prices remain high, we may see some decline in the demand for development land and thus in land values. The direction that cash rents take will be determined by expectations regarding government payments. At this time, little change in cash rents or land values is expected in the year ahead.
Periods such as this, while creating difficulties for some producers, provide opportunities for others. For some, the changes of the past two years have resulted in a decision to leave farming. For others, it has presented the opportunity to expand farm size by renting or purchasing. If you are expanding the farm business, it is always prudent to do some careful budgeting and develop a plan of action for dealing with a surprise that results in substantial revenue reductions.
The land values survey was made possible by the cooperation of professional farm managers, appraisers, brokers, bankers, Purdue Extension educators, and persons representing the Farm Credit System, the Farm Service Agency (FSA) county offices, and insurance companies. Their daily work requires that they stay well-informed about land values and cash rents in Indiana. The authors express sincere thanks to these friends of Purdue and Indiana agriculture. They provided 360 responses representing nearly all Indiana counties. We also express appreciation to Carolyn Hunst of the Department of Agricultural Economics for her help in conducting the survey.
* In 1999, 37 percent of the respondents reported that some or all classes of land declined in value from December 1998 to June 1999.
** Transitional land is land that is moving out of agriculture.
![]()
![]()
![]()
![]()
![]()
