1995 Indiana Land Values Rise Another Seven Percent
August 1, 1995
PAER-1995-07
H. Atkinson, Professor and Kim Cook, Research Associate
![]()
![]()
![]()
![]()
![]()
From 1989 to 1993 the increase in average Indiana cropland values was 13% about the same as the inflation rate. Then, in the year ending in June 1994, values rose around 10%. This was followed by an increase in the value of top and average land of over 7% for the most current year ending in June, 1995, according to the Purdue land values survey. Crops were good in 1994, corn and bean prices moved up nicely after harvest and interest rates showed signs of declining. Transition land values also rose. Farmers and other landowners who sold transition land for several times the value of cropland have tended to add strength to the market as they bought replacement land.
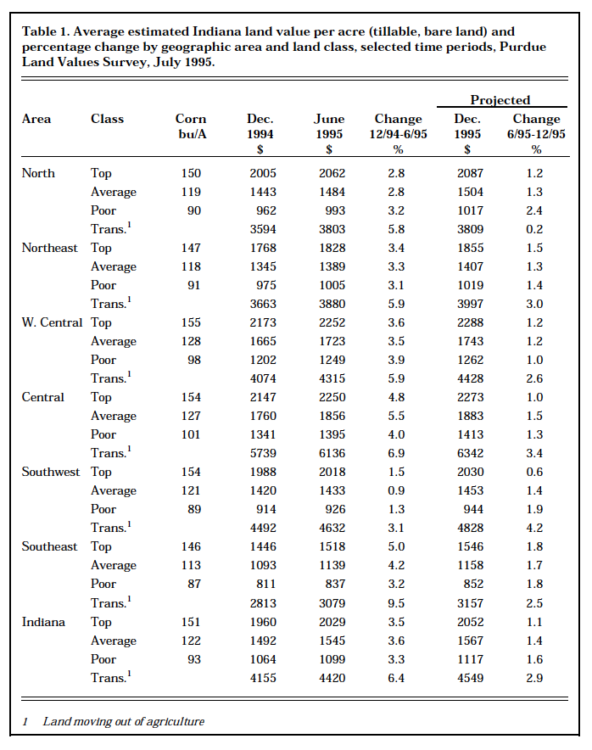
Table 1. Average estimated Indiana land value per acre (tillable, bare land) and percentage change by geographic area and land class, selected time periods, Purdue Land Values Survey, July 1995
According to the Purdue survey, this is the eighth consecutive year of increasing Indiana land values. Average quality land values are now 69% above the low levels of 1987 but still 26% below the high of 1981.
The number of farmland transfers in the 6 months ending in June compared to a year earlier was esti-matedtobeupby31%of the respondents versus 41% last year. More land was thought to be on the market by 12% of the respondents both this year and last year. Land brokers report difficulty in finding top quality land for sale in some areas.
Statewide Land Prices
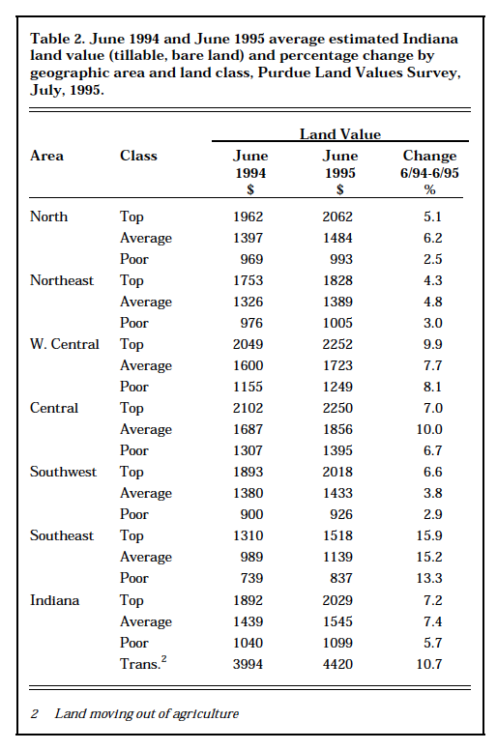
Table 2. June 1994 and June 1995 average estimated Indiana land value (tillable, bare land) and percentage change by geographic area and land class, Purdue Land Values Survey, July, 1995
For the six months ending in June 1995, the value of average land was reported to have increased 3.6%; 3.5% for top land; and 3.3% for poor quality land (Table 1). Two-thirds of the respondents reported that some or all classes of land went up from December 1994 to June 1995, the same as last year. Only 12 responses indicated that some or all classes of land fell during that period.
The statewide 12 month increase in average cropland value was 7.4%(Table 2). Land rated at 151 bushel corn yield was estimated to have increased by $129 per acre to $2029 (Table 1). Average land (122 bushel corn yield rating) was valued at $1545 while the 93 bushel poor land was estimated to be worth $1099 per acre.
The land value per bushel of yield also increased. For top quality land, value per bushel of yield was $13.44, an increase of 5.2%. Average quality land was $12.66 of value per bushel, while a poor quality was $11.82 per bushel (Table 3). Percentage increases were a little higher on average and poor land. These per-bushel figures are $.66 higher than last year on top land, $.67 higher on average land, and $.64 higher on poor land.
The value of transition land moving into non-farm uses increased 6.4% in the 6-month period ending in June to over $4400 per acre. The percentage increase for the year was 10.7% compared to an increase in average farmland of 7.4% (Table 2). Estimates for transition land ranged from under $1000 per acre in some strictly rural counties to over $20,000 in expanding urban areas. Estimates were obtained of the value per acre for individual homesites up to 5 acres and for tracts of 10 acres or more suitable for residential sub-divisions. The median value statewide for both uses was the same -$3500 per acre. The generally high values and strong market for transition land tends to spill over into the farmland market as farmers and other owners sell or trade transition land and replace it further away from developing areas.
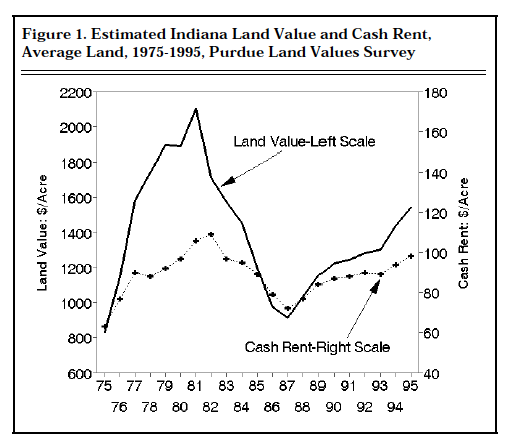
Figure 1. Estimated Indiana Land Value and Cash Rent, Average Land, 1975-1995, Purdue Land Values Survey
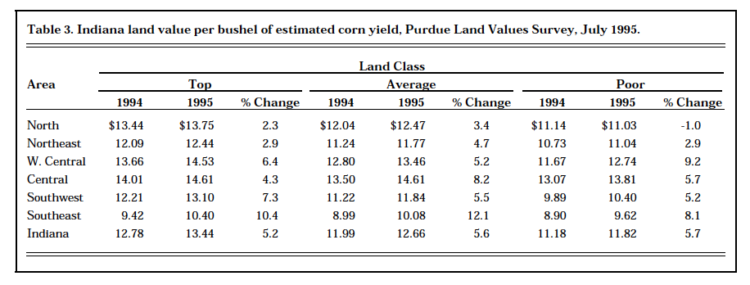
Table 3. Indiana land value per bushel of estimated corn yield. Purdue Land Values Survey, July 1995
Statewide Rents
Cash rents increased statewide from 1994 to 1995 by $4 per acre on top and average land, and $2 per acre on poor land (Table 4).
The estimated cash rent on aver-age land was $98 per acre, $122 on top land, and $73 on poor land. Rent per bushel of estimated yield was$.81 on top land, $.80 on average land, and $.78 on poor land, up one to two cents from last year. Cash rent on top land in 1995 was about 15% below the record 1981 level but 34% above the recent low in 1987.
Statewide, cash rent as a percentage of estimated land value declined a little for the fifth consecutive year. These estimates are 6.0% for top land, 6.3% for average land, and 6.6% for poor-quality land (Table 4). These declining percentages are the result of greater increases in land values than in cash rents (Figure 1). Rent as a percentage of land value was 5% in 1981 and interest rates were very high. Land values declined by nearly 20% the next year. A major difference in the cur-rent situation is that debt servicing costs are much lower. There is less farm debt, interest rates are lower and may decline over the next year or so.
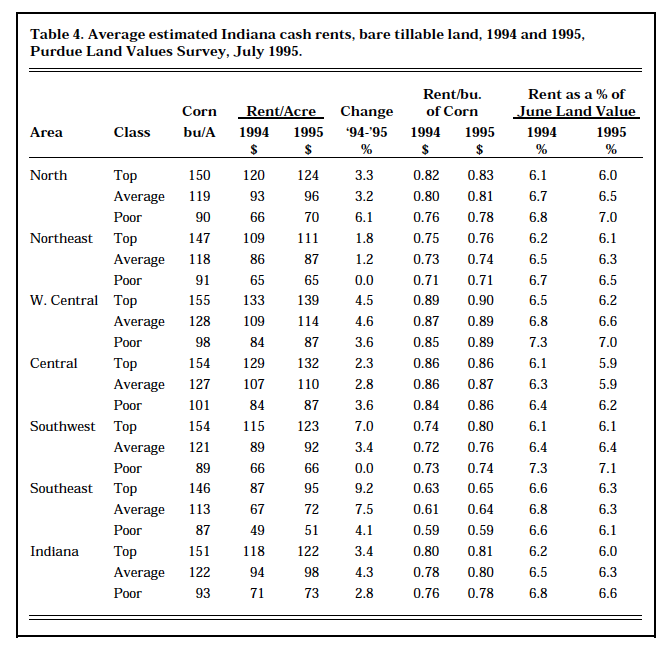
Table 4. Average estimated Indiana cash rents, bare tillable land, 1994 and 1995, Purdue Land Values Survey, July 1995
Area Estimates
Increases in the value of farmland by areas from December 1994 to June 1995 were generally in the narrow range of 2.8% to 5.5% except in the southwest where increases were 1 to 1.5% (Table 1). Increases for poor land were less than for top land except in the west central and north-ern areas.
For the year ending in June 1995 the greatest increases in all classes of farmland were in the southeast
(13% to 16%) followed by west central top land and average land in the central area (10%) (Table 2). Increases ranging from 2.5% to 8.1%were reported for other land qualities and areas.
The highest valued top quality land was in the west central and central areas, around $2250 per acre. Next highest values were in the north ($2062) and southwest ($2018). Average quality values were $1856 in the central and $1723 in the west central areas but $300 to$400 lower in the north and south-west. Both of these areas have some land of excellent quality but over-all land productivity is lower than in the central and west central areas.
Land values per bushel of estimated average corn yield (land value divided by bushels) on top land were in the range of $13.75to$14.61in the north, west central and central areas (Table 3). Top land values per bushel were $12.44 in the northeast and $13.10 in the southwest. The per bushel value of average land in these two areas was a little under$12.00. Lowest values, around $10, were in the southeast. Land values per bushel tended to decline in all areas as land quality (corn yield esti-mates) declined. These per bushel values have been increasing since 1987, but are much lower than in 1981 when the per bushel estimate for average land in central Indiana was $21.50. This figure dropped to about $9.50 in 1987 and currently is $14.61.
Cash rents for top land increased by $6 to $8 per acre in the west central, southwest and southeast areas and $2 to $4 in the other areas. Increases were generally less for average and poor land (Table 4). The highest percentage increase was for top land in the southeast (9.2%).
Cash rents were highest in the west central and central areas – $139 per acre and $132 respectively for top land, $114 and $110 per acre for average land. Cash rents per bushel were also highest in these areas, ranging from 86¢ to 90¢. The per-bushel rent for top land was 83¢in the north, 76¢ in the northeast, 80¢ in the southwest, and 65¢ in the southeast. These rates declined by a few cents per bushel as land quality declined.
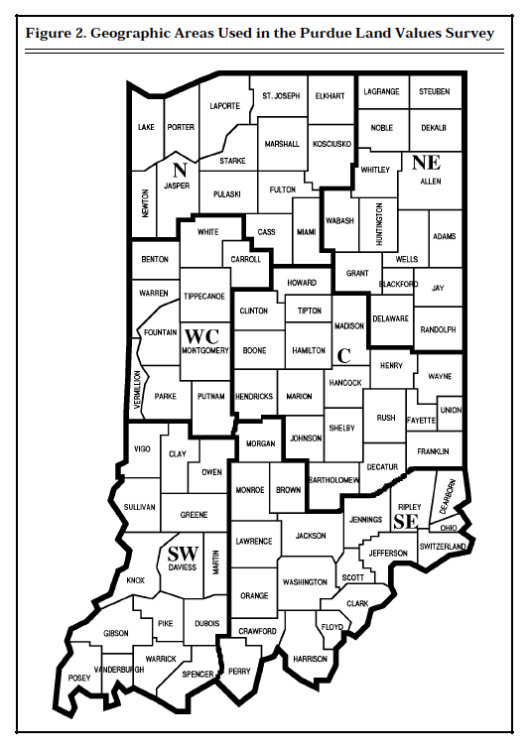
Figure 2. Geographic Areas Used in The Purdue Land Values Survey
Cash rent as a percentage of land value declined again in all areas except the southwest. This rate of return on top and average land was in the range of 5.9% to 6.6% in all areas. There was some tendency for the rate to increase as land quality declined.
Cash rent as a percentage of land value declined again in all areas except the southwest. This rate of return on top and average land was in the range of 5.9% to 6.6% in all areas. There was some tendency for the rate to increase as land quality declined.
Respondentsʼ Outlook
This is the fourth year in which respondents have become slightly more optimistic than the year before that farmland values would rise by year-end. Fifty-three percent expect some or all classes of land to increase, up from 52% last year. Only 7% of the respondents expect a decline in values while 37% expect no change. The average expected increase was small in all areas of the state -mostly under 2%. If this rate of increase occurred and continued through the first half of 1996, the annual rate of would be only a little over half of the 1994-95 rate.
Respondents were mildly optimistic about the longer run (5 year) out-look for land values, with 83% expecting increases, down slightly from last year. Eleven percent expected no change and 6% expected declines. The modest average increase of 9% is about the same as last year’s projection.
Respondents were asked to estimate annual averages over the next five years for corn and soybean prices, the farm mortgage interest rate, and the rate of inflation. The projections they made since 1984 are shown in Table 5.
Corn price expectations rose by two cents per bushel and declined 16 cents for beans. Inflation rate expectations declined slightly and interest rate projections were a little higher.
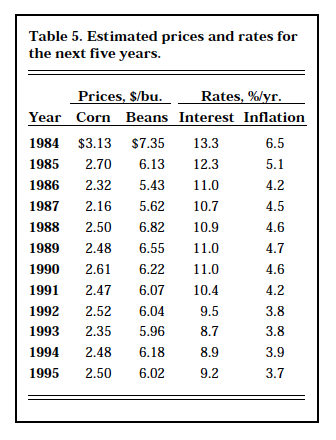
Table 5. Estimated prices and rates for the next five years
Several factors favor further increases in land values and cash rents in the year ahead. First, corn, bean and wheat prices are more favorable than they have been in several years and Indiana crop prospects are fairly good. Second, export sales have been better than expected and carry-over stocks this fall will be much lower than earlier projections, thus raising the possibility that favorable prices may continue into 1997. Third, interest rates likely will decline in the months ahead. These factors are likely to outweigh the negative influence of expected cuts in government program payments, thus land values are expected to increase over the next year or so.
The land values survey was made possible by the cooperation of professional farm managers, appraisers, brokers, bankers, county extension educators, and persons representing the Farm Credit System, the Farmers Home Administration, CFSA county offices, and insurance companies. Their daily work requires that they stay well-informed about land values and cash rents in Indiana. The authors express sincere thanks to these friends of Purdue and Indi-ana agriculture. They provided nearly 400 responses representing most of Indiana’s counties. We also express appreciation to Sandy Dottle of the Department of Agricultural Economics for her help in conducting the survey and to Professors Chris Hurt and Howard Doster for their review of this report and helpful suggestions.
![]()
![]()
![]()
![]()
![]()
