Indiana Land Values Steady
August 1, 1987
PAER-1987-1
Author: J.H. Atkinson, Professor of Agricultural Economics, and Kim Cook
Note: The charts in this article were taken from physical copy scans – as the original documents no longer exist. These versions are very blurry – we apologize in advance for the quality.
The sharp decline in Indiana farmland values is about over. That’s the conclusion of a majority of Purdue land values survey respondents who answered a question on when and at what level land values will “bottom out.” Fifty-eight percent of those who responded to the question believe that the low point in land values will be 95 to 100 percent of mid-1987 values. An additional 25 percent felt the low point would be 90 to 94 percent of mid-1987 levels. Thus, 83 percent of the respondents felt that the low point in land values already had been reached or would be no more than 10 percent under mid-1987 values.
Over half of the respondents (54%) were of the opinion that 1987 would be the year of the low point in Indiana land prices. An additional 9 percent felt the low point occurred in 1985 or 1986.
Statewide Land Prices and Rents
Results of the survey indicate that average cropland values declined 6.5 percent in the year ending in June 1987, only about a third as much as was reported last June. Cash rents on average land declined by about 9 percent from 1986 to 1987.
Most of this year-to-year decline in bare cropland values occurred from June to December 1986. Statewide average declines for the 6 months ending in June 1987 were only 1.2 percent on top land, 1.6 percent on average land, and 2.9 percent on poor land (Table 1). About 19 percent of the respondents reported that most classes of land increased during the 6-month period, 40 percent reported declines and 38 percent felt there was no change in land values (Table 2). Last 1 year, nearly three-fourths of the respondents indicated declines in land values in contrast to only 40 percent this year.
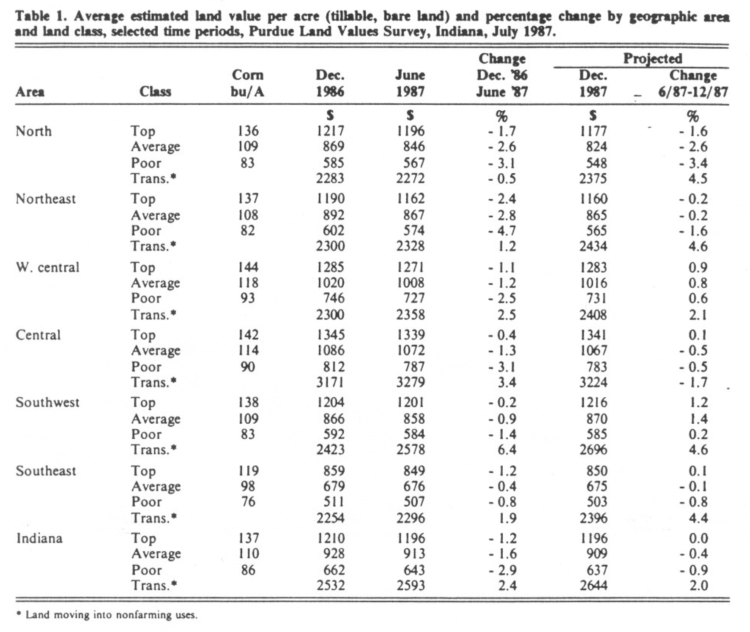
Table 1. Average estimated land value per acre (tillable, bare land) and percentage change by geographic area and land class, selected time periods; Purdue Land Survey, Indiana, July 1987

Table 2. Percentage of respondents reporting specified trends in land values from December 1986 to June 1987, Purdue Land Values Survey, Indiana, July 1987
The statewide price decline for the year ending in June 1987 was 6.9 percent on top land, 6.5 percent on average land, and 5.4 percent on poor land (Table 3), a reversal of the tendency of recent years for decreases in value to be greater on lower quality land. These annual percentage decreases are only about half of the 12 percent decrease reported by USDA for the year ending February 1 and by the Federal Reserve Bank of Chicago for the year ending April 1. The Federal Reserve survey reported a leveling off of land values in several Corn Belt states in the 3 months ending April 1.
The USDA land value estimates indicate a decline of 56 percent in Indiana farmland from 1981 to 1987, practically identical to the 57 percent drop for average land based on the Purdue survey. Poor quality land declined 58 percent and top land 55 percent according to the Purdue survey.
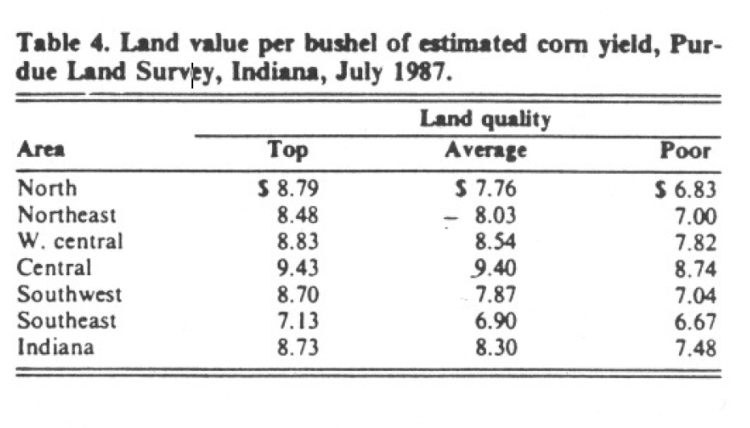
Top quality land had an average estimated value of $1,196 per acre (Table 1) or $8.73 per bushel for the 137 bushel estimated long term yield (Table 4). Average land (110 bushel yield) was valued at $913 per acre, while the 86 bushel poor land was estimated to be worth $643 per acre. Land values per bushel of yield estimate were $8.30 on average land and $7.48 on poor land. These figures were $.52 to $.64 less than last year.
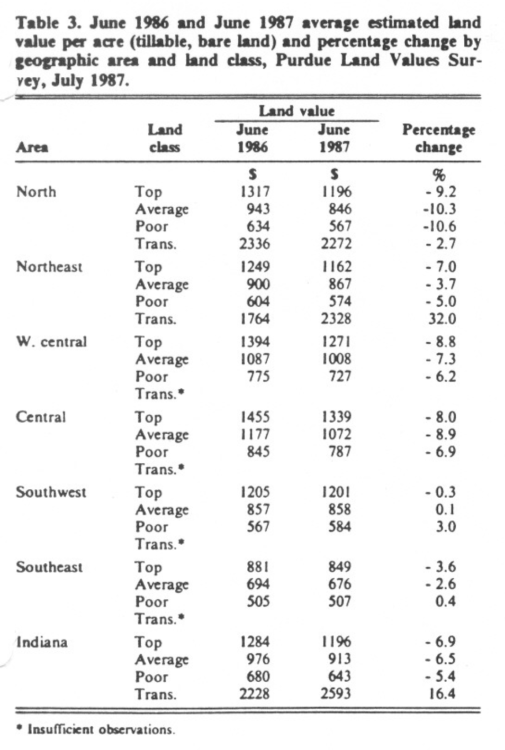
Table 3. June 1986 and June 1987 average estimated area land value per acre (tillable, bare land) and percentage change by geographic area and land class, Purdue Land Survey, July 1987
Cash rents declined statewide from 1986 to 1987 by about 9 percent to 11 percent or slightly less than last year’s decline. The declines were slightly higher on top quality than on average or poor land (Table 5). The USDA reported a 10 percent decline in cash rent for cropland to an average of $77 per acre. The Purdue estimate for average land was $72 per acre. Rent per bushel of estimated yield was $.66, $.65 and $.60 respectively for top, average, and poor land or $.07 to $.08 less than the 1986 estimates. Cash rents have declined by about one third since 1981.
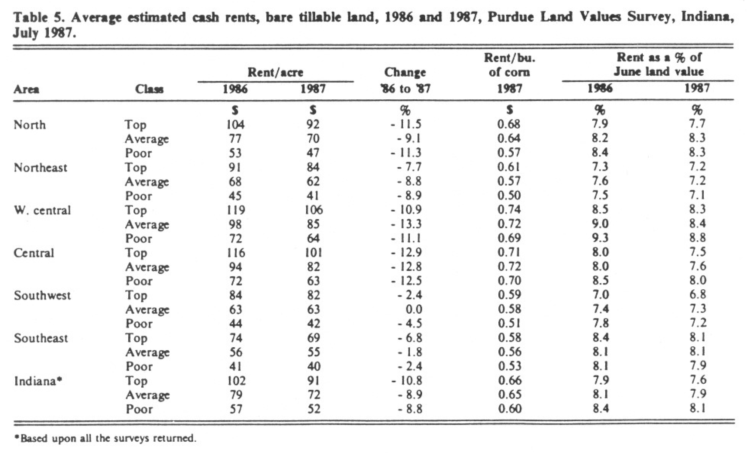
Table 5: Average estimated cash rents, bare tillable land, 1986 and 1987, Land Values Survey, Indiana, July 1987
Cash rent as a percent of estimated land value declined slightly after several years of increases (Table 5). This figure is 7.6 percent for top quality land and around 8 percent on average and poor land. In 1981 these figures were around 5 percent.
The value of land moving into nonfarm uses was estimated to have a value of $2,593 per acre in June 1987, up 16 percent for the year (Table 3) with only about 2 percent of that increase coming over the last six months of that period. Relatively few persons report on transition land values, the range in estimates is quite wide and the reliability of the averages is not as good as with farmland. The median value was $2,000 in June 1987, unchanged from December 1986 and up only slightly from June 1986. It may be that transition land has increased sharply in a few areas of the state and has been about stable in other areas.
Area Estimates
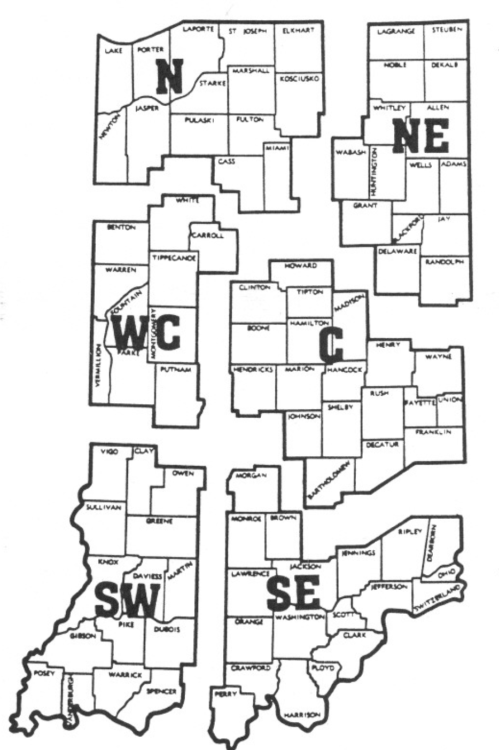
Declines in farmland values in the two southern areas (Figure 1) from December 1986 to June 1987 were generally 1 percent or less while declines in other parts of the state were mostly from 1 percent to 3 percent.
The percentage of respondents reporting some or all classes of land to have declined in market value since last December was 54 percent in the north, 51 percent in the northeast, 42 percent in the west central area, 35 percent in central Indiana, 32 percent in the southwest, and only 25 percent in the southeast (Table 2). These are substantial declines from the range of 44 percent to 90 percent reported last year and indicate a stronger land market the first part of 1987 than the same period in 1986. Except in the north and northeast, the combined “stable” and “up” categories exceeded 50 percent. In the two northern areas a sizable majority of respondents reported stable to lower prices from December 1986 to June 1987.
For the year ending June 1987, declines in cropland values were highest in the north, ranging by land class from 9 to 11 percent (Table 3). Declines were 6 to 9 percent in the west central and central areas, and 4 to 7 percent in the northeast. The two southern areas had both slight increases and slight decreases.
The central area again had the highest average land values, even when adjusted for yield differences. The average reported value of top land with an estimated long term corn yield of 142 bushels per acre was $1,339 per acre (Table I). This results in a land value per bushel of $9.43 (Table 4), only $.03 higher than average land. Top land value per bushel in the north, northeast, west central and southwest ranged from $8.48 to $8.83. In the southeast with an average reported yield of only 119 bushels, land value per bushel was $7.13. As land quality decreased, land value per bushel also decreased.
Cash rent was stable to down about 7 percent in the two southern areas (Table 5). Greater average declines of 8 percent to 13 percent were reported in the other areas. There was no consistent relationship between the percentage decline and land quality by area of the State; however, on a statewide basis, declines were slightly less on average and poor land than on top land, a reversal of the tendency of the past few years.
Cash rent per bushel of estimated corn yield was highest in the central and west central areas, ranging from $.69 to $.74 per bushel. Rent per bushel on top and average land in the two southern areas and the northeast was about $.12 less than the figures for the central and west central areas with this differential being about $.06 less in the north. Compared to last year, these estimates range from no change to $.03 less in the two southern areas. In the rest of the State, the decline from 1986 to 1987 was $.07 to $.10 per bushel.
Rent as a percent of land value declined slightly in all areas and fell generally in the range of 7 percent to 8.4 percent. This figure has increased from around 5 percent in 1980-81 and has apparently now leveled off.
What of the Future?
Survey respondents are considerably more optimistic than they were a year ago about changes in land prices over the next 6 months. Last year, 59 percent of the respondents expected the value of all or most classes of land to be lower by December. This year, only half as many expect declines while those who expect mostly increases rose from 8 percent in 1986 to 26 percent in 1987. Forty-four percent expect prices to be stable.
The statewide average was an expected decline of under 1 percent on average and poor land (Table I). No change was expected in top quality land. Expected declines in farmland values of 2 percent to 3 percent were reported in the north. Increases or decreases of under 1 percent were the general rule in other areas. Increases of 4 percent to 5 percent in transition land values were expected in all except the central area where a decline of 2 percent was expected.
Eighty-two percent of the 1987 respondents, in contrast to 67 percent last year, expect land values to be higher 5 years hence. The group average percentage change was an increase of 12 percent, up from 7 percent last year.
Respondents were asked to estimate annual averages over the next 5 years for corn and soybean prices, farm mortgage interest rates and the rate of inflation. Their responses since 1984 are shown below:
After declining since 1984, corn and bean price expectations are about the same as last year: corn prices down $.16 and beans up $.19 per bushel. The expected inflation rate rose slightly from last year and the farm mortgage interest rate was expected to be 10. 7 percent, down from last year’s expectation of 11 percent. This combination of responses, expecting a little higher rate of inflation, slightly lower interest rates and a stabilizing of corn and bean prices, may be a clue as to why these respondents are more optimistic about land prices than they were a year ago.
This survey, the Chicago Federal Reserve survey and perhaps others are providing evidence that the steep slide in Corn Belt land prices may have ended. Although there has been some improvement in the quantity of grain being exported, we have prospects for a large 1987 crop and huge carryover stocks. Considerable land is on the market or will be on the market as financially troubled landowners dispose of land. On the other hand, many farmers and investors have been sitting on the sideline for several years, waiting for signs that land prices have reached bottom. These signs are now appearing, and funds being held for eventual land purchase are earning less than they earned during most of the period of declining land values. Thus, land prices may stabilize and there may be reports of price increases, or a reduction in reports of “bargain” sales. The tough question, however, is whether this stability in land prices represents a base from which they increase or whether it is a pause in a downtrend which has not yet run its course. The answer to this question will depend upon such factors as governmental farm policy (both here and abroad), worldwide production, international trade policies and changes in grain utilization.
Investing in land at the present time carries the risk that prices and returns to land may decline from present levels. The potential reward lies in the possibility that current land prices reflect the probability of some further drop in farm profits, after which worldwide adjustments in production and use of grains could result in increasing farm profits and rising land values.
The land values survey was made possible by the cooperation of professional managers, appraisers, brokers, bankers, and persons representing the Farm Credit System, the Farmers Home Administration, and insurance companies. Their daily work makes them the experts on land values and cash rent in Indiana. To these friends of Purdue and Indiana agriculture, sincere thanks are expressed. They provided more than 300 responses representing most of Indiana’s counties. Appreciation is also expressed to Julie Frey of the Department of Agricultural Economics for her help in conducting the survey.
