1996 Indiana Land Values Surge!
August 1, 1996
PAER-1996-1
H. Atkinson, Professor and Kim Cook, Research Associate
![]()
![]()
![]()
![]()
![]()
Statewide, values of average Indiana cropland increased by 14.2% in the year ending in June 1996, nearly double the 7.4% increase a year ago. According to the Purdue land values survey, this is the ninth consecutive year of increasing Indiana land values. Increases of around 35% were registered in both the first and last third of this 9 year period. There was a lull in the upward trend during the middle 3 years with only a 7%increase over the period. For the entire 9 years, going back to the low level of 1987, statewide top and aver-age cropland values have gained over 90% and poor land has doubled. Even so, 1996 land values are still about 15% below the record levels of 1981.
The number of farmland transfers in the 6 months ending in June compared to a year earlier was estimated to be up by 34% of the respondents versus 31% last year. More land was thought to be on the market now by 16% of the respondents versus 12% a year ago. Land brokers report difficulty in finding top quality land for sale in some areas.
Statewide Land Prices
For the six months ending in June 1996, the value of top and average land was reported to have increased 5.2%, and 4.8% for poor quality land (Table 1). Most respondents (78%) reported that some or all classes of land went up from December 1995 to June 1996, compared to two-thirds last year. Only 6 responses indicated that some or all classes of land fell during that period.
The statewide 12 month increase in average cropland from June 1995 to 1996 was 14.2% (Table 2). Top quality land (149 bushel corn yield rating) was estimated to have increased by $245 per acre to $2274. Average land (121 bushel corn yield rating) was valued at $1765 while the 93 bushel poor land was estimated to be worth $1303 per acre, up more than 18% for the year. In spite of this big increase in poor land, it remains 15% below the 1981 peak, the same as top land.
The land value per bushel of corn yield rating also increased substantially. For top quality land, value per bushel of yield was $15.26, up by 13.5%. Average quality land value was $14.59 per bushel, while the poor quality value was $14.01 per bushel (Table 3). The percentage increase of 18.5 on poor land was noticeably higher than on average and top land. These per-bushel figures are $1.82 higher than last year on top land, $1.93 higher on average land, and $2.19 higher on poor land.
The value of transition land moving into non-farm uses increased less than 1% in the 1-year period ending in June to over $4437 per acre compared to an increase of 10.7% last year (Table 2). Estimates for transition land vary widely from county to county and even within some counties. The median value of individual homesites up to 5 acres and sites of 10 acres or more suit-able for residential sub-divisions was the same – $4000 per acre, up from $3500 last year. The percent-age increase (14.3%) was about the same as for average tillable land.
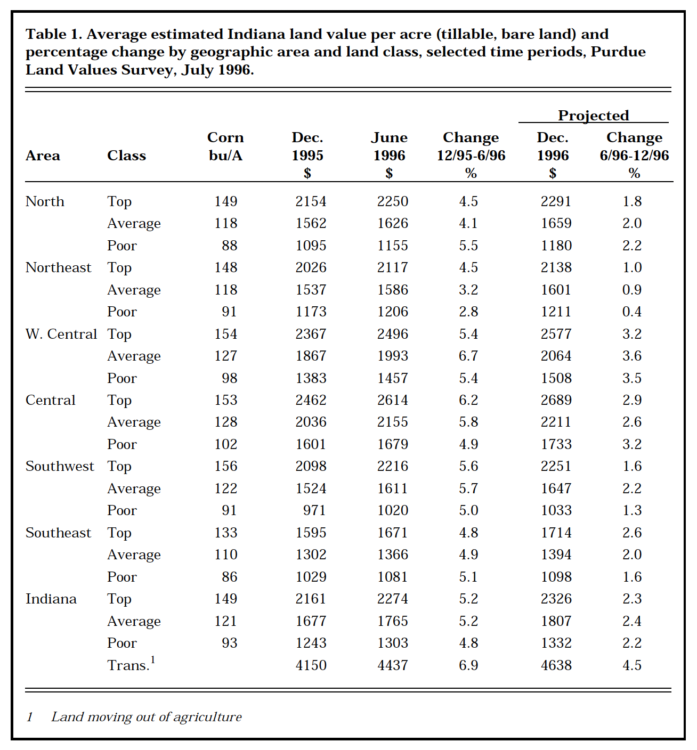
Table 1. Average estimated Indiana land value per acre (tillable, bare land) and percentage change by geographic area and land class, selected time periods, Purdue Land Values Survey, July 1996.
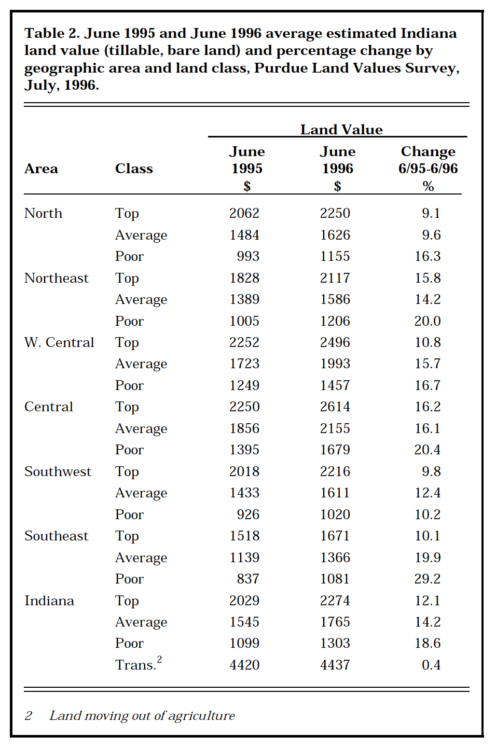
Table 2. June 1995 and June 1996 average estimated Indiana land value (tillable, bare land) and percentage change by geographic area and land class, Purdue Land Values Survey, July, 1996.
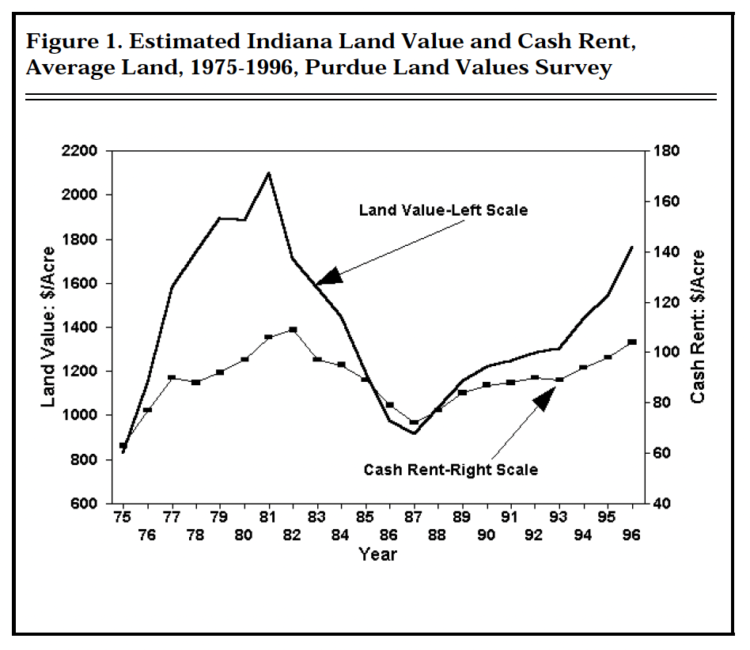
Figure 1. Estimated Indiana Land Value and Cash Rent, Average Land, 1975-1996, Purdue Land Values Survey
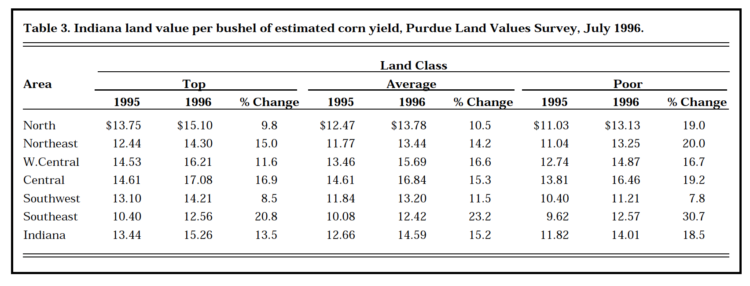
Table 3. Indiana land value per bushel of estimated corn yield, Purdue Land Values Survey, July 1996.
Statewide Rents
Cash rents increased statewide from 1995 to 1996 by $7 per acre on top and poor land, and $6 per acre on poor land (Table 4).
The estimated cash rent on average land was $104 per acre, $129 on top land, and $80 on poor land. Rent per bushel of estimated yield was$.87 on top land and $.86 on average land and poor land, up six to eight cents from last year. Cash rent on top land in 1995 was about 6% below the record 1981 level but 42% above the recent low in 1987.
Statewide, cash rent as a percent-age of estimated land value declined for the fifth consecutive year. These estimates are 5.7% for top land, 5.9% for average land and 6.1% for poor quality land (Table 4). Greater increases in land values than in cash rents (Figure 1) caused these declines, but the percentages are still higher than the 5% levels of 1979-81.
Area Estimates
Increases in the value of farmland by areas (Figure 2) from December 1995 to June 1996 were in the rangeof2.8%to6.7%(Table1). The only areas that reported greater increases for poor land than for top land were the north and southeast areas.
For the year ending in June 1996 the greatest increase in top or aver-age farmland was in the southeast (19.9% on average land) followed by around 16% increases on top land in the northeast, average in west central Indiana, and top and average in the central areas (Table 2).
Other increases on top and average land ranged from 9.1% to 14.2%. In all areas of the state, poor land value increases were greater than for top quality land. The per-centage increase on poor land in the southeast was nearly three times that of top land. Since 1987, top land has increased 97% and poor land 113%. Increases were from the low point the same for top and poor land in the southwest (80%). Values for all classes of land roughly doubled in the west central area (100%). The greatest difference in top and poor land increases since 1987 was the northeast where top land was up 82% and poor land rose 101%.
The highest valued top quality land was the west central and central areas, around $2500 to $2600 per acre. Next highest values were in the north ($2250) and southwest ($2216). Average quality values were $2155 in the central and $1993 in the west central areas but only around $1600 in the north, south-west and northeast. These areas have some land of excellent quality but over-all land productivity is lower than in the central and west central areas. Corn yield ratings were lower by 5 to 10 bushels.
Land values per bushel of estimated average corn yield (land value divided by bushels) on top land were in the range of $15.10to$17.08in the north, west central and central areas (Table 3). Top land values per bushel were $14.30 in the northeast and $14.21 in the southwest. The per bushel value of average land in these two areas was about $1 less than on top land. Lowest values, around $12.50, were in the south-east. Land values per bushel tended to decline in all areas as land quality (corn yield estimates) declined. These per bushel values have been increasing since 1987, but are much lower than in 1981 when the per bushel estimate for average land in central Indiana was $21.50. This figure dropped to about $9.50 in 1987 and currently is $16.84.
The median value per acre of both small and large homesites was$5000 in the central area, up from the 1995 estimate of $4500 for 5 acres or less and $4000 for tracts of 10 acres or more. In all other areas the median value in 1996 was $4000 per acre for the smaller tracts, up from $3000 a year earlier. The $4000 figure was also reported for the larger tracts in the central and two northern areas, up from $3000 last year. In the southeast, tracts of 10 acres or more had an estimated median value of $3000 this year and last year. The $4100 per acre estimate for 1996 in the southwest was up from $3500 last year.
Cash rents for top land increased by $11 per acre in the central area and $3 to $8 in the other areas. Increases for average and poor land ranged from $5 to $8 (Table 4). The highest percentage increase was for poor land in the southeast (13.7%).
Cash rents were again highest in the west central and central areas -$142 per acre and $143 respectively for top land, $120 and $118 per acre for average land. Cash rents per bushel were also highest in these areas, ranging from 92¢ to 96¢, up 2¢ to 7¢ from last year. The per-bushel rent for top land was 89¢ in the north, 80¢ in the northeast, 82¢in the southwest, and 74¢ in the southeast. Except in the southeast, these rates were about the same regardless of land quality.
Cash rent as a percentage of land value declined again except on poor land in the southwest. This rate of return on top and average land was in the range of 5.5% to 6.3% in all areas, down from 5.9% to 6.6% in 1995. There was some tendency for the rate to increase as land quality declined.
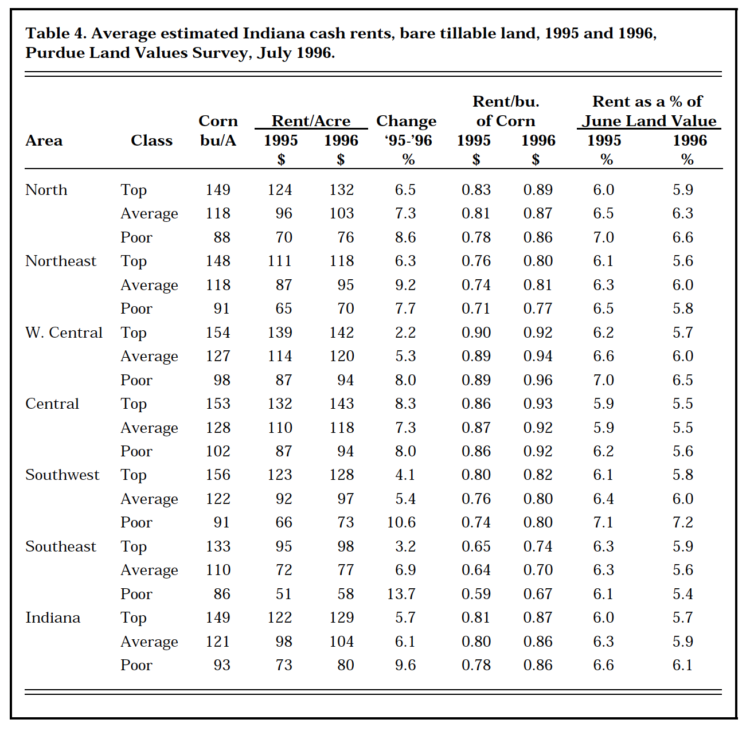
Table 4. Average estimated Indiana cash rents, bare tillable land, 1995 and 1996, Purdue Land Values Survey, July 1996.
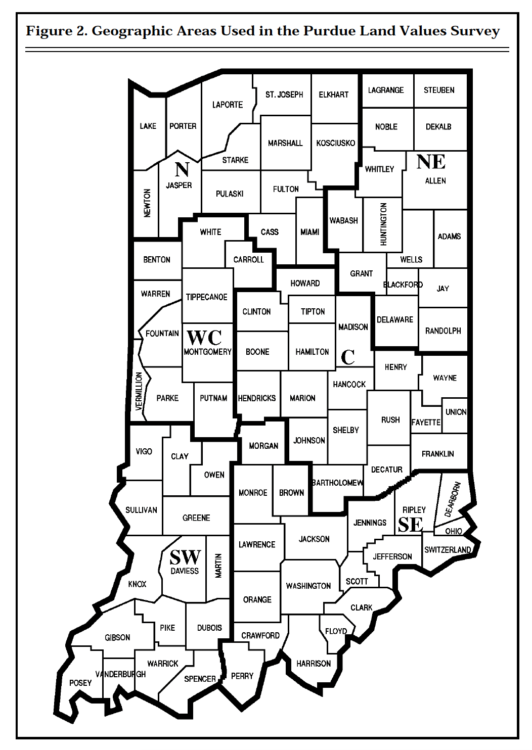
Figure 2. Geographic Areas Used in the Purdue Land Values Survey
Respondents’ Outlook
This is the fifth year in which respondents have become more optimistic than the year before that farmland values would rise by year-end. Seventy-nine percent expect some or all classes of land to increase, up from 53% last year. Only 7% of the respondents expect a decline in values, the same as last year, and 28% expect no change, down from 37% last year. The aver-age expected increase was small in all areas of the state -mostly under 3.5% (Table 1). These projections in the past have been in the right direction but have not been a good indica-tor of the magnitude of change.
Most respondents (87%) predicted that land values would increase over the next 5 years. Only 7% expected a decline and 6% expected no change. The modest average increase of 11%for the 5 years is two percentage points higher than last year’s projection.
Respondents were asked to estimate annual averages over the next five years for corn and soybean prices, the farm mortgage interest rate, and the rate of inflation. The projections they made since 1984 are shown in Table 5 below:
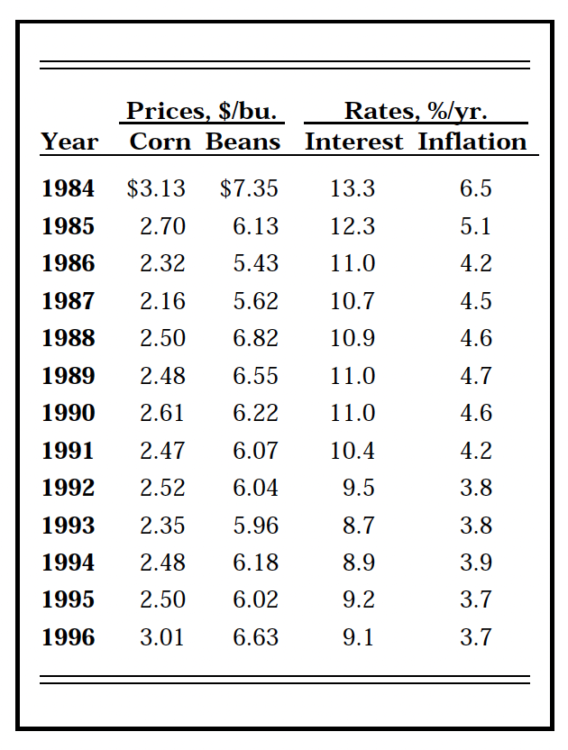
Table 5: Estimated annual averages over the next five years for corn and soybean prices, the farm mortgage interest rate, and the rate of inflation
This is the fifth year that expected farm mortgage interest rates have remained under 10% and inflation under 4%. Large increases occurred in expected prices of corn and soybeans. This is the first year since 1984 that the expected corn price has been at or above $3 per bushel. Higher farm earnings expectations no doubt have been a major factor in the current and recent strength in the land market. And to the extent that participants in the land market have 5 year expectations of $3 corn and over $6.50 bean prices, further increases in both land values and cash rents likely will occur. Cash rents also will be boosted by substantial government payments in 1997.
Are We Headed for a “Boom and Bust” in Land Values?
Farmland sale prices of $3000 or more are common in parts of Indi-ana. The question is being raised as to whether land prices may be headed for unrealistically high levels and then suffer a collapse – a repeat of the late seventies and early eighties. There are major differences between the two periods. Inflation and interest rates are much lower now than in the early eighties, farm debt is lower, some of our farm export countries are better able to maintain purchases from us (less external debt, higher incomes), land rent to value ratios are higher, lenders are more cautious and many land buyers paid cash or borrowed conservatively. These differences offer no guarantee against a decline in land values following a couple of years of 10 or 11 billion bushel corn crops. What they do suggest, if there is a decline from present or some-what higher land values, is that the decline would not be nearly as great as it was in 1981-87. One reason is that recent increases in values have been based mainly (not entirely) on increases in net returns to land rather than on the inflationary expectations of the earlier period. A second reason is that farm land is in much stronger financial hands. As a result, a decline in land values would not result in widespread financial stress severe enough to cause forced land sales and further declines in values.
This is not a time for pessimism but it is a time to reflect on the les-sons that should have been learned 15 to 20 years ago.
***********
The land values survey was made possible by the cooperation of professional farm managers, appraisers, brokers, bankers, county extension educators, and persons representing the Farm Credit System, the Farm Service Agency (FSA) county offices, and insurance companies. Their daily work requires that they stay well-informed about land values and cash rents in Indiana. The authors express sincere thanks to these friends of Purdue and Indiana agriculture. They provided nearly 400 responses representing most of Indiana’s counties. We also express appreciation to Sandy Dottle of the Department of Agricultural Economics for her help in conducting the survey and to Professors Chris Hurt and Howard Doster for their review of this report and helpful suggestions.
![]()
![]()
![]()
![]()
![]()
