Indiana Manufacturing: The Changing Face of a Manufacturing State
May 19, 2010
PAER-2010-04
Elizabeth A. Dobis, Graduate Student and Kevin T. McNamara, Professor
![]()
![]()
![]()
![]()
![]()
Manufacturing is an important part of Indiana’s economy. Manufacturing investment provides jobs that lower unemployment, provides personal income that enters the local economy through spending, increases government revenues, and creates cost saving benefits that make that geographic location more attractive to other firms. The presence and investment of manufacturing firms varies across space. Understanding manufacturing growth patterns can help communities understand potential growth opportunities and develop policies to attract or retain manufacturing firms.
In Indiana, the manufacturing sector contributed 25 percent, $64 billion, of the state’s $255 billion gross domestic product (GDP) in 2008 (US Department of Commerce’s Bureau of Economic Analysis). GDP is a measure of the valued goods and services produced within a geographic area. Indiana manufacturing contributes a larger percentage to state GDP than the sector does in any other state. Iowa and Wisconsin follow Indiana’s lead with manufacturing adding 21 percent and 20 percent to their state economies, respectively. Nationally, the share of GDP manufacturing provides is 12 percent, 13 percentage points less than in Indiana. Indiana was also the state receiving the highest portion of its GDP from manufacturing in 2004. This suggests that the ongoing change from labor-based to capital intensive manufacturing over the last five years is not reducing the relative importance of the manufacturing sector to Indiana’s economy.
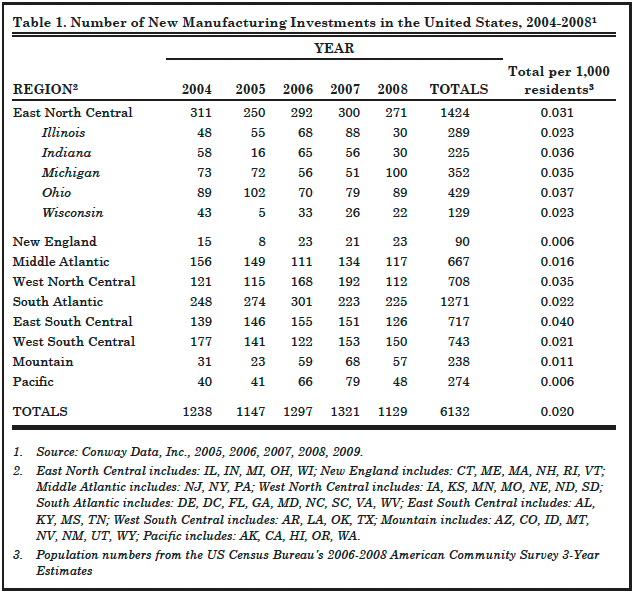
Table 1. Number of New Manufacturing Investments in the United States, 2004-20081
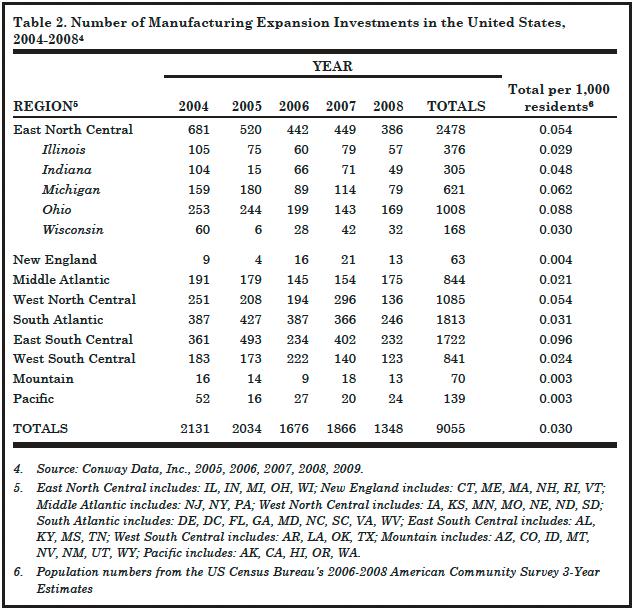
Table 2. Number of Manufacturing Expansion Investments in the United States, 2004-20084
Manufacturing Investment in Indiana
Indiana is a leader in attracting manufacturing investment. This is important because of the employment, financial, and fiscal benefits that result from the establishment of new manufacturing facilities or the expansion of existing facilities. Indiana had .036 new manufacturing investments per 1,000 people over the 2004 to 2008 time period, more than all census divisions except the East South Central division of the United States (Table 1). This places the state eighth in the country for new manufacturing investments and well above the national rate of .02. While Indiana (.048) ties with North Carolina for thirteenth in terms of manufacturing expansions per 1,000 people, the state is again greater than the national .03 (Table 2).
Indiana attracted 225 new manufacturing investments between 2004 and 2008 (Table 1). This is 16 percent of the East North Central census division total, slightly more than the state’s regional population share (14%). The East North Central division’s 1,424 new investments account for 24 percent of investments in the United States over this time period. Ohio leads the division’s new investments over the five-year time period, followed by Michigan and Illinois. This follows a historical pattern for the region.
Indiana had 305 manufacturing expansions from 2004 to 2008 (Table 2). This accounted for 13 percent of divisional growth. While this figure is slightly smaller than the state’s divisional population share, it is three percent of growth in the United States, larger than Indiana’s two percent national population share. From this analysis we find that, despite the shift from labor-based to capital intensive manufacturing, Indiana continues to attract more manufacturing investments than most of the United States. It is possible that this is due to policies that are already in place as well as the cost savings firms receive from locating near similar facilities or firms for which they provide products or from which they purchase inputs.*
Distribution of Manufacturing Jobs in Indiana
Indiana’s 521,059 manufacturing jobs represent 19 percent of the 2,806,039 jobs in the state. Marion County (65,660) and Elkhart County (53,048) have the largest number of manufacturing jobs (Table 3). Generally, the north and northeastern regions of the state have larger concentrations of manufacturing occupations (Figure 1) due to a long tradition of third tier automotive and recreational vehicle manufacturing and, more recently, medical devices.
Manufacturing employment growth in Indiana between 2004 and 2008 was uneven across the state. Twenty-four of Indiana’s 92 counties had an increase in the number of manufacturing jobs and 68 counties lost jobs (Table 3). Job growth tended to occur in clusters on the western side of the state. The largest gains in employment occurred in Franklin County (69%) and Hendricks County (68%).
Eighteen counties lost 25 percent or more of their manufacturing jobs. Fayette County (-61%) and Madison County (-43%) experienced the largest declines in manufacturing jobs. These losses also tended to occur in county clusters (Figure 2). In this analysis of the growth and losses of manufacturing jobs, it is important to note that percent change wasused. With percent change, counties may experience a large loss or gain in jobs with the birth or death of one facility if they have a small total number of employees.
Manufacturing employment is the largest sector in some Indiana counties, accounting for as much as 46 percent of jobs (Elkhart and Noble Counties) (Table 3). Two large strips of heavy manufacturing employment are apparent in Figure 3. One cluster is in northeast Indiana where a large number of recreational vehicle and auto related manufacturers are located. The other is in the southern region of the state. This southerly band of manufacturing is anchored on both ends by car manufacturing, Honda in Decatur County and Toyota in Gibson County. The share of employment devoted to manufacturing is smaller in and around Indianapolis. This reflects more diversification in the local economy.
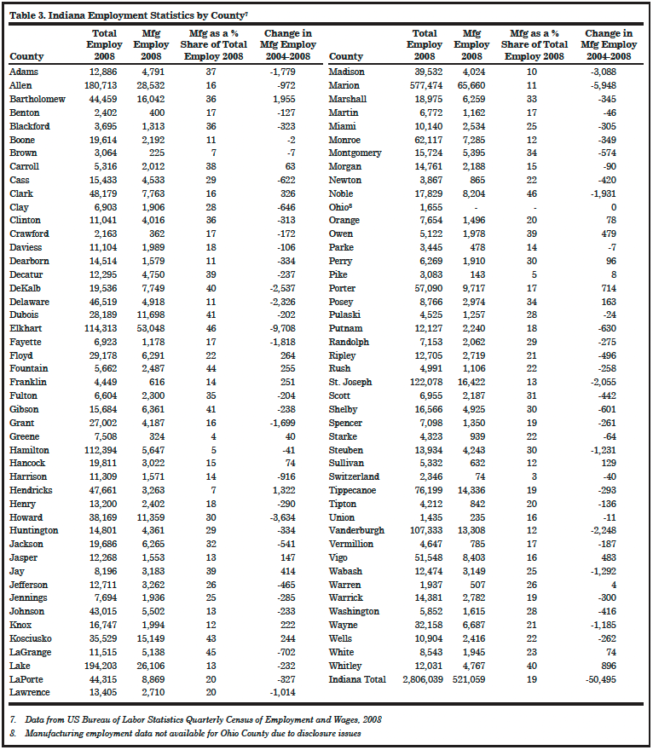
Table 3. Indiana Employment Statistics by County
Summary
Manufacturing accounts for 25 percent, or $64 billion, of Indiana’s $255 billion GDP and roughly 19 percent (520,000) of Indiana’s three million jobs. Growth rates in manufacturing facilities and expansions are above the national rate and place Indiana firmly in the middle of the states in the East North Central region. The number of employees and the change in manufacturing employment varies among Indiana’s counties. For example, Marion county has 65,000 manufacturing employees, contrasting with Switzerland County’s 74 employees. This large spread between the counties also appears in a 69 percent increase in manufacturing employment in Franklin County and a 61 percent decrease in manufacturing employment in Fayette County. The share of total employment dedicated to manufacturing is also quite disparate among Indiana’s counties. Counties in northeast and in southern Indiana have economies where manufacturing jobs dominate employment. Through the patterns of growth and loss highlighted by the maps, communities and counties may band together to implement policies to attract further manufacturing employment.
While remaining a national leader in manufacturing with rates of new manufacturing investment and facility expansions well above the national averages, Indiana manufacturing will likely continue its shift from labor-based to more capital intensive manufacturing in response to international competition as well as the availability of new technologies. As the economy recovers from the current recession, slow or declining employment growth might continue, along with positive changes in manufacturing GDP. Rural communities, a long time base for Indiana manufacturing, are unlikely to see a return of high wage manufacturing jobs. In fact, rural communities will probably face increased difficulty competing with urban areas for new manufacturing investment. Exceptions like the Honda plant in Decatur County might occur, however, the urban shift will likely remain as the defining trend.
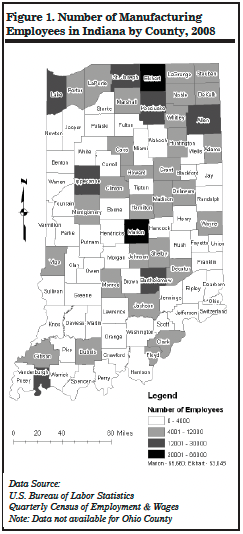
Figure 1. Number of Manufacturing Employees in Indiana by County, 2008
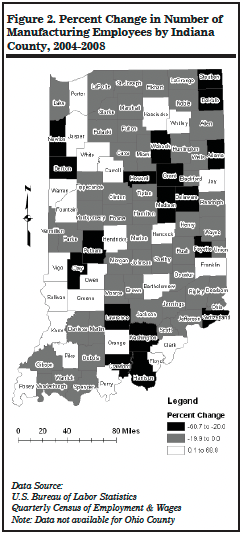
Figure 2. Percent Change in Number of Manufacturing Employees by Indiana County, 2004-2008
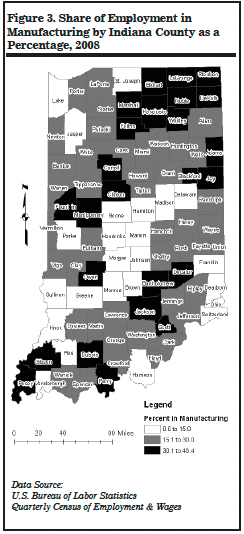
Figure 3. Share of Employment in Manufacturing by Indiana County as a Percentage, 2008
![]()
![]()
![]()
![]()
![]()
