Indiana Pasture Land, Irrigated Farmland, Hay Ground, and On-Farm Grain Storage Rent
August 23, 2012
PAER-2012-08
Craig L. Dobbins, Professor and Kim Cook, Research Associate
![]()
![]()
![]()
![]()
![]()
Estimates for the rental value of irrigated farmland, pasture land, hay ground, and on-farm grain storage in Indiana are often difficult to locate. For the past several years, questions about these items have been contained in the Purdue Farmland Value Survey. The values from the June 2012 survey are reported here. Because the number of responses for some items may be small, the number of responses is also reported.
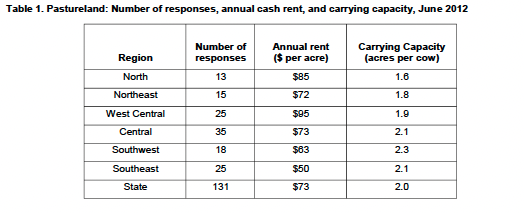
Table 1. Pastureland: Number of responses, annual cash rent, and carrying capacity, June 2012
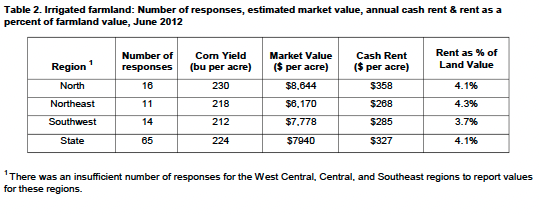
Table 2. Irrigated farmland: Number of responses, estimated market value, annual cash rent & rent as a percent of farmland value, June 2012
Averages for pasture rent, the market value of and cash rent for irrigated farmland, and the rental of on-farm grain storage are presented in Tables 1, 2, and 3, respectively. The rental rate for grain bins includes the situation where there is just a bin and the situation where there is a bin and utilities. Table 4 provides information about the rental rate for established alfalfa-grass and grass hay ground. Information from prior years’ surveys can be found in the Purdue Agricultural Economics Report archive.
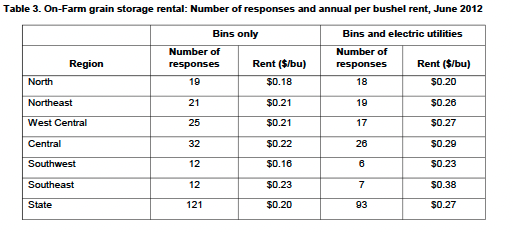
Table 3. On-Farm grain storage rental: Number of responses and annual per bushel rent, June 2012
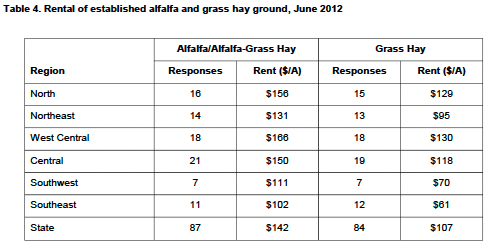
Table 4. Rental of established alfalfa and grass hay ground, June 2012
![]()
![]()
![]()
![]()
![]()
