Indiana Restaurants: A Promising Market for Indiana Aquaculture
August 16, 1992
PAER-1992-17
Jean Rosscup Riepe, Research Associate and Marshall A. Martin, Professor
![]()
![]()
![]()
![]()
![]()
At the same time that Americans are increasing their per capital consumption of seafood, natural constraints on wild catch are limiting the seafood supply. Aquaculture offers an alternative to fill this gap. Many farmers are seeking profitable alternative enterprises. Some forward-thinking Indiana farmers see aquaculture as a natural fit given their experience with livestock; the abundance of clean water, corn, and soybean meal; and the availability of small ponds or unused livestock facilities. In recent years, Purdue University staff have received numerous inquiries from Indiana fanners interested in starting an aquaculture operation. Purdue has responded by hiring an extension aquaculture specialist and expanding its aquaculture research program. However, little market analysis has been conducted on the potential for farm-raised fish in Indiana. That is the focus of this article.
Lack of market know ledge has been a great source of uncertainty for current and potential aquaculturists in the Midwest. Given the costs and risks of starting up an aquaculture operation, market information is critical. To address this need, a survey of Indiana restaurants’ finfish sales and purchasing behavior was conducted in June, 1991. Restaurants were chosen as a key set of potential customers because they often comprise the first successful market for farm-raised fish.
Survey Description and Procedures
A four-page survey was mailed to 2,864 restaurants in the state of Indiana. These restaurants represent about half of the restaurants on the Indiana Restaurant Association mailing list. A broad definition of “restaurant” was used since many types of establishments serve food and fish, and thus are potential customers for local aquaculturists. The survey contained four sections: (1) socioeconomic classification, (2) current fish suppliers and their characteristics, (3) interest in farm-raised fish species and factors affecting their purchase, and ( 4) catfish purchasing preferences. After two mailings, a total of 711 usable surveys were returned yielding a response rate of 25%.
Survey Results
Characterization of Respondents
Restaurants are not homogenous. The percentages in Table l reveal the socioeconomic diversity of the restaurants responding to the survey. Restaurant classifications were made based on type of ownership, style of service, primary sales, size (gross sales level), location in Indiana, and local population. Almost all respondents (90.4%) classified themselves as “independent.” About 56% of the respondents indicated their style of service as either family-style or atmosphere table service. The 21.8% classified as ”other” are primarily taverns and private clubs. Half of all respondents indicated that they primarily sold food while one fourth (23.7%) reported primary sales as alcoholic beverages. While all sizes of restaurants are represented among the respondents, 74.1 % are of either small or medium size (annual gross sales less than $500,000). Twice as many respondents are located in central Indiana (43.2%) as in southern Indiana (21.3%). Just over one-third are located in the northern part of the state. The restaurants are evenly distributed among population centers ranging in size from less than 5,000 (rural) to over 100,000 (major urban).
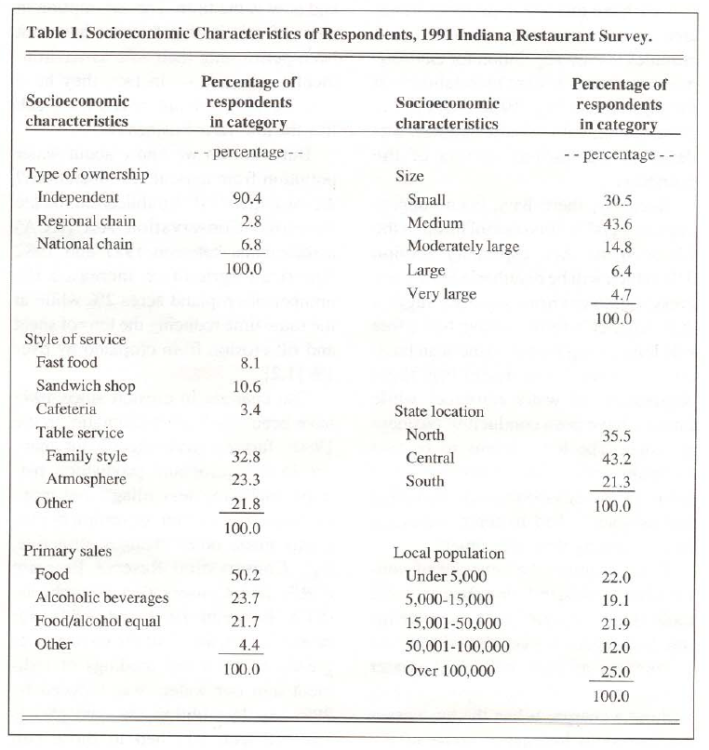
Table 1. Socioeconomic Characteristics of Respondents, 1991 Indiana Restaurant Survey
Since no socioeconomic data are available for all Indiana restaurants, the informed opinions of a Purdue University Restaurant, Hotel, Institutional, and Tourism Management professor and an Indiana Restaurant Association executive staff member were sought to determine the relationship between survey respondents and all Indiana restaurants. These experts noted that the survey group is biased toward restaurants that are independent, are smaller in size, provide table service, and rely on alcoholic beverage sales. More specifically, the experts pointed out that while only about 10% of the respondents indicated any chain affiliation, 50% is probably more accurate. Also, fast food service likely accounts for up to half of all Indiana restaurants rather than the 18.7% that classified themselves as either fast food or sandwich shop. The diversity within the respondent group as well as the differences between the responding restaurants and the entire population of Indiana restaurants must be kept in mind when interpreting survey results, especially for averages across all responding restaurants. Still, the survey results offer useful insights into Indiana restaurants as a potential market for farm-raised fish.
Likelihood of Offering Fish
About two-thirds (66.8%) of all responding restaurants currently offer fish on their menus, another 10% are considering it, and almost one-fourth (23.3%) indicated that they have no plans to ever offer fish (Table 2). Given the diversity among restaurants, percentages were calculated for the various socioeconomic subgroups.
To establish whether or not there are statistically significant differences in preference for offering fish across socioeconomic characteristics, statistical tests were performed on the cross tabulation frequencies between answers to the question about offering fish and each question about characteristic classification. Only two characteristics were found to be unrelated to a preference for offering or not offering fish: local population and location in the state. This means that a responding restaurant was not more or less likely to offer fish because it is located in the northern part of the state rather than the southern or in a rural area as opposed to a large metropolitan area.
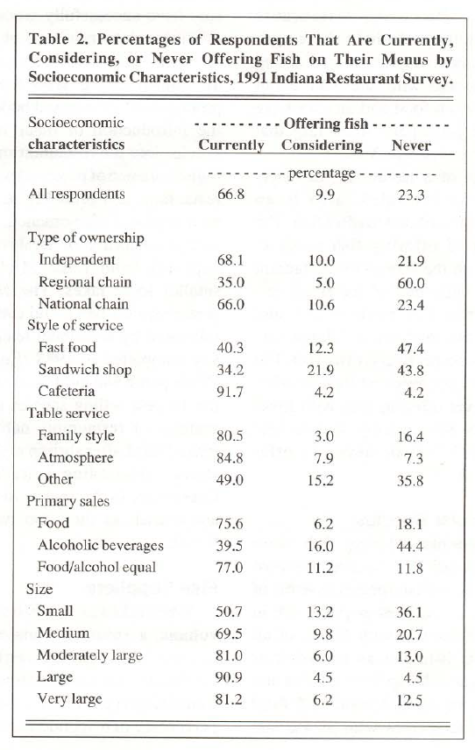
Table 2. Percentages of Respondents That Are Currently, Considering, or Never Offering Fish on Their Menus by Socioeconomic Characteristics, 1991 Indiana Restaurant Survey.
For socioeconomic characteristics for which the preference for offering fish differs significantly (99% confidence), the response frequencies to the question about offering fish are presented in Table 2. Higher percentages in the “Currently” column indicate that restaurants with the associated socioeconomic characteristics are more likely to offer fish than restaurants with characteristics exhibiting lower percentages. Since restaurants that already offer finfish are more likely to become successful markets for farmraised fish, this information suggests that a marketing plan for farm-raised fish should identify those restaurants that currently offer fish based on observable socioeconomic characteristics.
Results indicate that national chain and independent restaurants have a stronger preference for offering fish than do regional chain restaurants. While independents and national chains both exhibit response rates similar to the average for all respondents, only 35% of regional chains indicated that they currently offer fish, and a large majority (60%) never intend to offer fish. Of all types of restaurants, regional chains are the least likely to offer fish.
The likelihood of offering fish differs by style of service. Cafeterias, followed by atmosphere and family-style table-service restaurants, are the most likely to offer fish. From 80.5 to 91.7% of the restaurants in these three categories offer fish. These figures are substantially higher than the overall average of 66.8%. The remaining service styles are much less likely to offer fish. Although sandwich shops are the least likely to offer fish (34.2%), they are the most likely to consider offering fish (21.9%). Fast food restaurants are the most likely never to offer fish.
Restaurants responding to the survey differ in their likelihood of offering fish depending on their primary sales item. Respondents who indicated that food sales are either primary or at least as important as alcoholic beverage sales have a much stronger preference for offering fish than do respondents primarily selling alcoholic beverages (Table 2). About 76% of the foodoriented establishments offer fish, while only 39.5% of the establishments that primarily serve alcoholic beverages serve fish. However, restaurants primarily selling alcoholic beverages have the highest proportion considering fish. Restaurants with sales split about evenly between food and alcohol have the lowest percentage indicating that they would never offer fish.
The size of a restaurant, as determined by gross sales, also is an indicator of likelihood to offer fish. The likelihood of offering fish tends to increase with the size of the restaurant (Table 2). Only half of the small restaurants offer fish while 69.5% and 90.9% of the medium and large size restaurants, respectively, offer fish. The percentages are reversed for considering and never offering fish, with small restaurants more likely to consider offering (13.2%) or never to offer (36.1 %) fish.
Most Popular Species
Respondents offering fish were asked to list their first, second, and third most popular finfish species in terms of sales. Cod is the most popular fish in Indiana restaurants, with 48.7% of all respondents listing it as one of their three most popular species. Catfish and perch are the clear second and third most popular species with 39.4% and 27.1 % of the respondents listing these species, respectively. These relative rankings hold whether looking at species in terms of being any one of three most popular species or in terms of being ranked as first most popular. Other species in order of popularity are orange roughy, whitefish/pollock, salmon, walleye, swordfish, tuna, sole, halibut, red snapper, and trout.
The high ranking of catfish is rather surprising given that Indiana is not a traditional catfish-consumption area. Apparently, the marketing efforts of southern catfish producers and processors have successfully wooed Indiana consumers into trying and liking catfish when they eat out at restaurants. This is an encouraging sign for Indiana producers of catfish and bodes well for the introduction of other farm-raised species into the restaurant market. The high incidence of perch sales by Indiana restaurants can probably be explained as a regional phenomenon associated with availability of freshwater perch supplies from Lake Michigan and smaller local lakes. The Midwestern preference for perch and catfish is corroborated by a national telephone survey completed in 1988 (Engle et al.). While perch was not found to be among the 10 best-selling species of fish and seafood in restaurants nationwide, it ranked third after shrimp and cod in the states surrounding Lake Michigan. Consumers in the region ranked perch and catfish as their top two favorite finfish.
Fish Suppliers
When asked to rank fish suppliers by volume, a substantial majority of the respondents (69%) ranked local wholesalers/distributors as number one. Remaining types of businesses and the percentage of respondents ranking each as first by volume include: out-of-state wholesaler (18.7%), producer of farmraised fish (3.3%), retailer (2.9%), lake or coastal fleet (1.3%), other (0.7%), and processor (0.1 %). Since wholesalers so strongly dominate the fish supply market, perhaps they should be targeted as a likely market for Indiana farm-raised fish. That “producer of farm-raised fish” is the third ranked fish supplier implies that some aquaculturists are already successfully marketing their products. However, some of these producers likely are located outside Indiana.
Survey results reveal that 95.7% of the responding restaurant managers make their own decisions on the selection of fish suppliers. This implies that Indiana aquaculturists should be able to market fish directly to restaurateurs. The only socioeconomic subgroups of responding restaurants in which less than 90% reported making their own decisions are: national chains (71.4% ), regional chains (61.3%), fast food style (70.0%), large size (86.8%), and very large size (88.5%).
Restaurant managers were asked to rate the importance of several characteristics in influencing supplier selection, and then to list the three most important. The top five characteristics were rated significantly more important than the others. These top characteristics, along with the percentage of respondents listing it as one of the three most important, include: high-quality product (82.6%), price (57.0%), yearround supply (55.3% ), consistent sizing (46.4%), and good reputation (17.4%).
Farm-Raised Fish
Over half (56.0%) of the respondents who are already offering fish, or are considering offering it, indicated that they are either currently offering or considering offering fam-raised fish on their menus. Responses are statistically different by style of service, primary sales, size, and volume offish purchases (99% confidence). Socioeconomic subgroups having greater than 60% of the respondents offering or considering offering farm-raised fish include: “Cafeteria” and “Table-service” (family style and atmosphere) styles, primarily food-offering restaurants, all sizes except “Small” and “Large,” all state locations except “North,” and respondents with “Medium” or “High” volumes of fish purchases (more than $6,000).
Restaurant managers were asked to indicate their interest in offering several farm-raised species by checking one of four possible responses: “Wouldn’t Offer(=l),” “Uncertain(=2),” “Plan to Offer(=3),” and “Offer Now(=4).” Numeric values were assigned to the responses (“Wouldn’t Offer” = I) and averaged across all respondents for each species to obtain an average score for the species. Higher scores indicate higher interest levels by respondents.
Catfish is currently being offered by a 66.4% of the responding restaurants (Table 3). The average score for catfish (3.47) is significantly higher than the scores of other species indicating that respondents are the most interested in offering farm-raised catfish. Trout is the second most popular farm-raised species with 22.1 % of the respondents currently offering it and almost as high a percentage, 19.0, planning to offer it. Walleye, perch, and salmon rank third, fourth, and fifth, respectively, in interest of responding restaurant managers. These are followed, somewhat distantly, by large-mouth bass, hybrid striped bass, bluegill, and tilapia.
All but three (walleye, salmon, tilapia) of the farm-raised species included in the survey are being produced in Indiana aquaculture operations (Scott, Swann). Survey results suggest that Indiana restaurants comprise a ready market for catfish and trout, while selling large-mouth bass, hybrid striped bass, or bluegill to the restaurants will be a tougher marketing challenge.
The importance of various factors in encouraging respondents to purchase local farm-raised fish were rated by respondents who were then asked to list the three most important factors. The five key factors, along with the percentage of respondents listing each as one of three most important, include: fish available year-round (60.4%), volume and frequency guarantees (48.8%), fish exhibit higher quality than other sources ( 46.5% ), chef provided with sample to test (41.0%), and producer has good reputation (31.8%). Aquaculture entrepreneurs desiring to successfully market their fish to Indiana restaurants should incorporate these factors into their marketing plans.
Farm-Raised Catfish Purchasing Preferences
Restaurant managers were surveyed for their specific preferences, when purchasing farm-raised catfish, for product form, product size, frequency of delivery, and volume. This information is vital for anyone desiring to successfully market catfish to Indiana restaurants. Without this knowledge, a producer might raise fish to the wrong size or have no means of performing needed processing or storage; and consequently could end up with no market. Information on the average price paid by restaurant managers for each product form along with the maximum price they would be willing to pay for Indiana-raised catfish also was requested. Reliable market price information is critical to producers. They must compare market price to their production costs to determine if they can make a profit in the restaurant market.
Frozen fillet is the most desirable product form, followed by frozen headed and gutted, fresh fillet, and fresh headed and gutted (Table 4 ). These four product forms are highly preferred by respondents relative to the 11 alternative product forms. Prices paid vary considerably among product forms with $1.27 difference between fresh fillet and frozen headed and gutted.
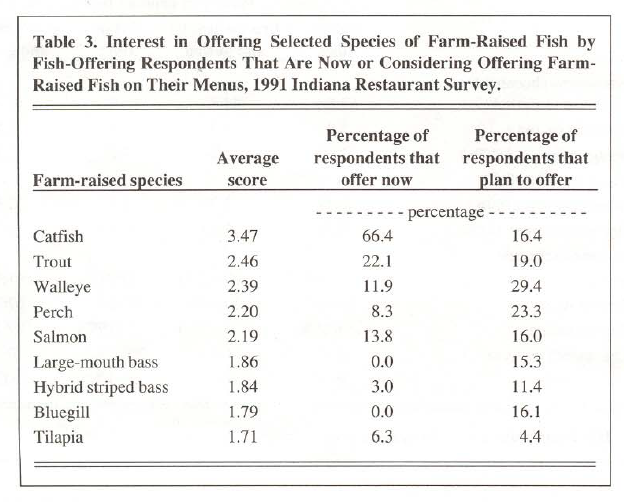
Table 3. Interest in Offering Selected Species of Farm-Raised Fish by Fish-Offering Respondents That Are Now or Considering Offering Farm-Raised Fish on Their Menus, 1991 Indiana Restaurant Survey
Responding Indiana restaurant managers are not willing to pay more for farm-raised catfish produced in Indiana rather than in other states. This is shown by the small implied premiums for Indiana-raised catfish that are listed in Table 4. As a result of the small premiums, the maximum prices that respondents reported they would be willing to pay for Indiana-raised catfish are only 1.2 to 5.1 % above the average prices they have been paying for all catfish.
Survey information on minimum purchase volumes and preferred purchasing schedules provide guidelines to current or potential catfish producers as to how much fish they could be expected to deliver and when (Table 4). For instance, 46 pounds per week of frozen catfish fillets translates into 2,392 pounds of fillets per year or 6,600 fillets. Assuming a 40% dressing Joss and two fillets per fish, a producer would need to annually raise 3,300 catfish weighing 1.21 pounds each for a total of 3,993 pounds of fish. At least two-thirds of the respondents prefer to purchase catfish once a week except when purchasing fresh fillets. In this case, slightly over half (55%) still prefer once a week, while one-fourth prefer de] i veries every three to four days. One fourth of respondents indicated that they would purchase frozen catfish products on a monthly basis.
Summary and Recommendations
Many diverse factors in the U.S. fish market and Indiana agriculture have generated substantial interest in aquaculture among Indiana farmers. Since aquaculture is not a well-established industry in Indiana, starting up such an operation is a risky venture which can require substantial investments in time as well as capital. Marketing is perhaps the greatest source of risk and uncertainty for aquaculturists. The purpose of this study is to provide meaningful, comprehensive data on one of the major markets for food fish in the state: restaurants.
A broad cross section of lndiana restaurants was surveyed for their current attitudes and practices toward offering and purchasing finfish in general, and farm-raised fish in particular. The empirical results presented in this article offer aquaculturists in Indiana and neighboring states useful information with which to develop successful marketing strategies. Fish is a standard menu item in most Indiana restaurants, and indeed one farm-raised species, catfish, is consumed widely across the state.
To increase the probability and ease of penetrating the Indiana restaurant market, aquaculturists should target restaurants that: (1) provide table service or a cafeteria environment, (2) primarily serve food rather than alcoholic beverages, (3) are at least of moderate size, and (4) already have a moderate amount of fish on their menus. The most desirable farm-raised fish species currently is catfish, followed by trout, walleye, perch, and salmon. There seems to be little interest at this time by Indiana restaurant managers in offering largemouth bass, hybrid striped bass, bluegill, or tilapia on their menus. Successfully marketing these four species will be a greater marketing challenge.
When purchasing any fish, Indiana restaurant managers are especially concerned with obtaining adequate, yearround supplies of high-quality, consistently sized fish from reputable sources at appropriate prices. Currently, two-thirds of the restaurant market is supplied by local wholesalers or distributors. Since all but a few of the surveyed restaurants make their own decisions about the selection of fish suppliers, aspiring aquaculturists should directly approach restaurant managers about possible sales. Bringing along a product sample for the chef to test should improve chances for success.
Indiana restaurateurs purchasing farm-raised catfish prefer to buy fresh or frozen fillets and fresh or frozen fish that have been headed and gutted. Size, volume, and delivery preferences all differ by product form, but weekly deliveries are most preferred. Fresh fillets command the highest price, but they also involve more processing costs and waste. Aquaculturists should not expect to obtain a significantly higher price for catfish raised within the state.
Before any private or corporate entity initiates an aquaculture operation, a market feasibility study is critical. This article suggests several key factors that should be incorporated into any restaurant market analysis for farmraised fish in the Midwest.
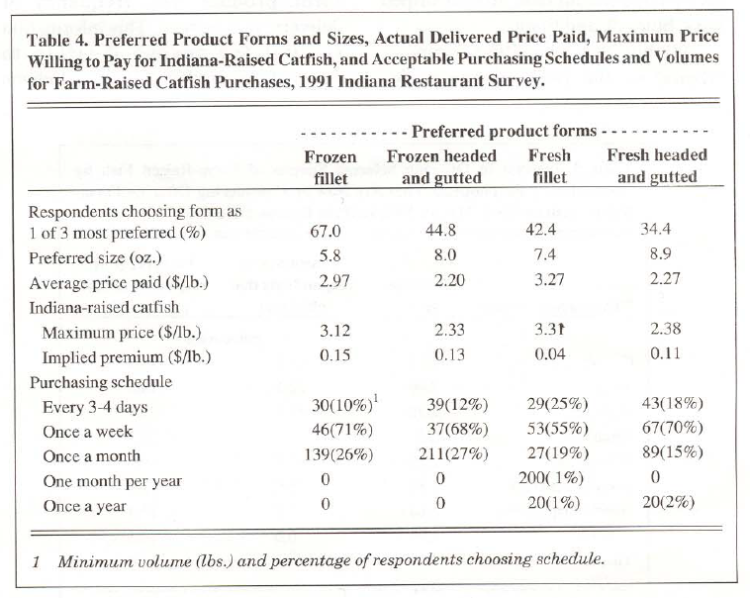
Table 4. Preferred Product Forms and Sizes, Actual Delivered Price Paid, Maximum Price Willing to Pay for Indiana-Raised Catfish, and Acceptable Purchasing Schedules and Volumes for Farm-Raised Catfish Purchases, 1991 Indiana Restaurant Survey
References
Engle, Carole, Oral Capps, Jr., Lynn Dellenbarger, James Dillard, Upton Hatch, Henry Kinnucan, and Robert Pomeroy. The U.S. Market for Farm-Raised Catfish: An Overview of Consumer, Supermarket, and Restaurant Surveys. Arkansas Agr. Exp. Sta. Bull. No. 925, University of Arkansas, Sept. 1990.
Riepe, Jean Rosscup, Marshall A. Martin, and Lee
- Schrader. A Market for Farm-Raised Fish: 1991 Survey of Indiana Restaurants. Purdue Agr. Exp. Sta. Bull., Purdue University, forthcoming, I 992.
Scott, Nancy A. “Economic Feasibility of Catfish Production in Indiana.” M.S. thesis, Purdue
University, Dec. 1990.
Swann, LaDon. Personal communication. Aquaculture Extension Specialist, Department of Animal Sciences, Purdue University, Feb. 1992.
![]()
![]()
![]()
![]()
![]()
