Indiana Restructures Its State Budget
June 23, 2011
PAER-2011-06
Larry DeBoer
![]()
![]()
![]()
![]()
![]()
The Indiana General Assembly passed a state budget for the 2012-13 biennium on April 29, 2011, on time, with no special session required. The apparent ease with which the budget passed belies its importance, however. This budget restructures Indiana state government.
The April Revenue Forecast
In mid-April, 2011 the long session of the General Assembly was nearing its climax. As usual during budget years, a revised revenue forecast was to be announced on April 15, in time for the final negotiations about the state’s budget for the 2012 and 2013 fiscal years. Everyone expected an upward revision. Revenues were running $100 million ahead of the revenue forecast made in December for the first nine months of fiscal 2011. That was money in the bank, literally. It was reasonable to expect similar upward revisions for the next two years, so many thought the new forecast would increase expected revenues by $300 to $400 million.
Instead, the revenue forecast jumped $762 million. It was a ray of sunshine after years of budget gloom. It was the first time the April forecast had shown an upward revision since April 2005.
The reason for the big increase in expected revenues was a more optimistic forecast for the Indiana economy. The state hires the IHS Global Insight company to do its economic forecasting. In April, Global Insight projected that Indiana income will grow 12.9% from fiscal year 2010 to fiscal year 2013. Back in December, it had projected growth of only 10.8%. The company predicted that the Indiana unemployment rate will drop to 8.2% by 2013, instead of December’s prediction of 9.2%. They also had stock market values rising an extra 7% and U.S. gross domestic product growing about 1% more than in December’s projection.
These improved economic projections entered the state’s revenue formulas and increased revenue forecasts. More Indiana income growth means more consumer spending, which raises sales tax revenue. A lower unemployment rate should inspire more consumer confidence, which would increase sales tax revenue some more. More income growth means more income tax revenue. Higher GDP growth and a bigger rise in the stock market should increase income taxes on capital gains.
Table 1 shows the numbers. Through May—11 months of the 2011 fiscal year—Indiana has collected $11,659 million. This is $110 million or 1.1% above what was projected in December 2010. Revenues are 9.1% higher than they were in the first ten months of fiscal 2010. In an expanding economy growth is usually around 4% per year. A 9.1% growth rate is revenue acceleration.
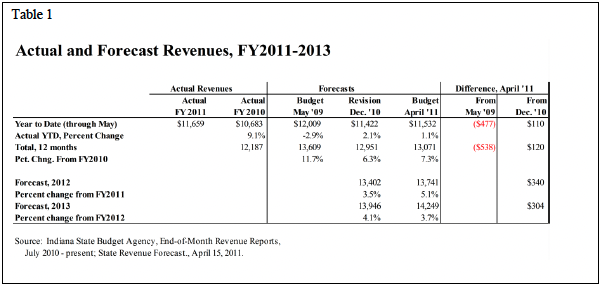
Table 1. Actual and Forecast Revenues, FY 2011-2013
But we’re growing out of a deep hole. That’s evident from a comparison of the year-to-date revenue and what we expected to have by now when the 2011 budget was written. The last forecast before the legislature passed the 2011 fiscal year budget predicted that revenues would be $12,009 million through May. We’ve collected $477 million less than that. Revenues are up, but not nearly enough to fund what we’d planned to spend back in 2009.
The April 2011 forecast shows 5.1% growth for fiscal 2012, up from 3.5% in the December 2010 forecast. That’s mainly the result of the improved economic outlook for Indiana’s economy. The percent change for 2013 actually was cut from 4.1% to 3.7% by the April revision, but since it was slightly slower growth from a bigger 2012 number, total collections were up. The total increase of $762 million is the sum of the forecast increases for 2011, 2012 and 2013. That’s shown in the table, off by a couple million due to rounding.
Table 2 shows some additional detail about revenues. The revenue totals in Table 2 include a small amount of additional revenue that is not part of the revenue forecast. Sales tax revenue is the largest share of the state’s general fund total. It is expected to grow 4.6% on average over the next two years, as the economy is expected to expand.
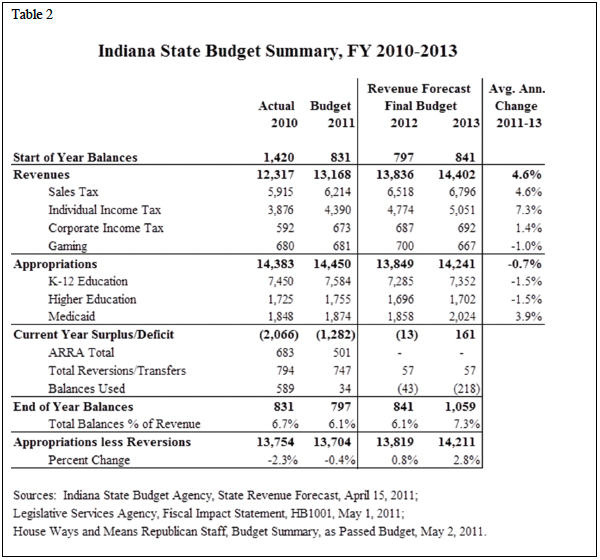
Table 2. Indiana State Budget Summary, FY 2010-2013
Individual income tax revenue is next largest, and shows a larger 7.3% growth rate. This is due to expectations of faster economic growth, but also reflects a quirk in Indiana’s method for distributing local income tax revenue. Local income tax revenue is collected by the state in the same way as state income tax revenue, but is distributed to local governments based on the previous year’s collections. State revenues are the residual after local distributions. Collections are growing with the expanding economy, so local distributions lag, and the state’s residual shows faster growth.
Revenues are dominated by sales and income taxes. Sales and individual income taxes sum to 82% of total general fund revenues. The remainder includes corporate income taxes, gaming taxes, and (not shown) tobacco, alcoholic beverage, inheritance, insurance, and several smaller revenue sources.
Corporate income taxes are expected to increase modestly over the next two years. The slower growth rate is due in part to the reduction in the corporate income tax rate passed by the General Assembly. It will phase down from 8.5% to 6.5% over the next four years. Gaming taxes are expected to decline in 2013 with the opening of a casino in Cincinnati. It will compete with the three Indiana riverboats that serve that market.
The 2012-13 Biennium Budget
What will we do with this money? On the day of the April forecast Governor Daniels recommended an added $150 million for K-12 education over the two-year budget, partly to fund grants for all-day kindergarten. He also warned that the new revenues were “no reason to abandon caution.”
―Cautious‖ is a good description of the budget for the coming biennium. An outline of the budget is shown in Table 2. The improved revenue picture in 2011 will allow us to end fiscal 2011 (and start the new biennium) with balances of about $797 million, which is 6.1% of the budget. That’s better than the rock-bottom minimum near 5% in the governor’s original budget proposal.
A budget is a set of appropriations passed by the General Assembly. Appropriations are the legal authorizations to spend on the various functions of the state government. Appropriations are down in 2012-13, by an average of 0.7% per year. In fact, total appropriations for 2013 are lower than they were in 2009. The recession cut about five years off state budget growth.
Appropriations are dominated by education and Medicaid. In 2013 52% of the state’s general fund will be devoted to K-12 education. The state pays for almost all local school operating costs, including teacher pay. Add higher education, and 64% of the budget goes to education. Education plus Medicaid makes up 78% of the budget. The remainder includes general government operations, public safety, health and social services and other functions not shown in Table 2.
Appropriations for Medicaid are rising. Medicaid is the joint state and Federal program of health care for low income people. It is an entitlement, so the state must pay its share of the costs of medical care for eligible people. Health care costs are rising, and the number of recipients is trending upward as well. This does not take account of the Federal health care reforms, which begin in 2014.
Other appropriations are falling. The cuts in appropriations are because revenues fell so far short of the projections used to set appropriations for the 2010-11 budget. Because of that shortfall spending had to be cut below appropriations. When the state spends less than its legal authorization, the money ―reverts‖ to general fund balances. So spending cuts are called ―reversions.‖ Appropriations less reversions are a measure of spending. The 2012 and 2013 appropriations less reversions show small increases over 2011, of 0.8% and 2.8%. In effect, the new budget incorporates those spending cuts into the plan for the next biennium.
This is also indicated by the current year surplus/deficit. The budgets for 2010 and 2011 were expected to be balanced when they were passed. Revenues as forecast were expected to cover appropriations. Instead, revenues fell short by $3.3 billion in total. Revenues are forecast to grow in the coming biennium, but growth from that reduced level still leaves them short of what was needed to fund planned appropriations for 2010 and 2011. So appropriations have been cut.
The current year surplus/deficit shows near balance in 2012, and a surplus for 2013. This is an indication of the caution that the governor recommended. The budget does not increase appropriations to match revenue growth. Balances will rise instead. The state is expected to have 7.3% of the budget in the bank by the end of the biennium in mid-2013.
How did Indiana cover those big deficits in 2010 and 2011? Partly with Federal stimulus aid. The American Recovery and Reinvestment Act (ARRA) was the Federal stimulus aid originally passed in February 2009. As part of that program, the state budget received about $1.2 billion in 2010-11. A large part of this revenue was an increase in the Federal government’s share of Medicaid spending. This added money did not increase Medicaid spending, which is defined by the entitlement rules. It simply increased the Federal revenue available to support this spending, which freed up some state revenue for other uses. About 35% of the two-year deficit was covered by Federal stimulus dollars.
Reversions and transfers summed to $1.5 billion over the biennium. This figure is mostly reversions, which are the spending cuts ordered by the governor. State agencies, universities and local schools spent less than their legal spending authorizations during the biennium. Reversions and transfers covered about 45% of the two-year deficit.
The remaining 20% was covered by balances. One reason balances are accumulated is to cover shortfalls in revenues. The ―rainy-day fund‖ is a part of balances devoted specifically to this purpose. In fiscal 2010 balances fell from $1.4 billion to $831 million. The difference, $589 million, covered part of the deficit. Another $34 million was used in 2011. At that point balances were near 5% of the budget. Indiana always keeps at least 5% of its budget in balances, to cover cash flow.
This accounting of the current year deficits is a third way to understand the state’s re-structuring. Indiana was able to cover its deficit with Federal aid, balances, and spending cuts. The ARRA aid for state budgets ends as of June 30, 2011, and Congress is unlikely to come up with more. Balances are near the rock-bottom 5% minimum. So, for the next biennium, only spending cuts remain to balance the budget. Appropriations for 2012 and 2013 incorporate these spending cuts. The state’s budget has been re-set, down-sized, restructured to match lower revenue expectations.
Does Indiana Have a Structural Budget Deficit?
Does Indiana have a structural budget deficit? In one sense, Indiana has never had a deficit at all. Article 10, section 5 of our state constitution says ―No law shall authorize any debt to be contracted, on behalf of the State, except in the following cases: to meet casual deficits in the revenue; to pay the interest on the State Debt; to repel invasion, suppress insurrection, or, if hostilities be threatened, provide for the public defense.‖ We interpret this section to mean that the state balances must be positive at the end of each fiscal year, which is one definition of a balanced budget. This requirement has always been met, one way or another, so there’s never a deficit in a Constitutional sense.
When we say “deficit,” maybe we mean that current revenues are not enough to cover current appropriations. These would be the current year deficits shown in Table 2. Revenues fell short of appropriations by $1.3 billion in 2011. That’s one measure of the budget deficit. But what is a ―structural deficit?‖
In the public budgeting business there are two kinds of deficits: “cyclical” and “structural.” Recessions cause cyclical deficits. Revenues fall because incomes and sales drop; spending rises because more people receive entitlement benefits. When the economy recovers a cyclical deficit goes away. Revenues grow and benefit payments fall, so the budget is balanced again. A cyclical deficit can be closed simply by waiting for economic recovery to increase revenues.
A structural deficit is one that continues, even after the economy recovers. Action is required to close a structural deficit. The federal government’s deficit is both cyclical and structural. The deficit is huge because of the recession, but even with recovery a large deficit will remain. We haven’t figured out how to pay for rising federal medical and retirement benefits over the long haul.
Certainly Indiana’s deficits are partly cyclical. The budgets for 2010 and 2011 were expected to be balanced. The recession reduced revenues below forecasts, and created big deficits. The deficits would be structural if part remains after the economy recovers.
Here’s an experiment to test for a structural deficit. Suppose for 2010 we calculate K-12 education appropriations per pupil, higher education appropriations per college student, Medicaid appropriations per beneficiary, and all other appropriations per person. That’s a measure of the service level that the state provided in 2010. Then, let’s increase these per-person spending amounts by estimated inflation each year, and let’s multiply those figures by the projected number of students, beneficiaries, and other people. That tells us how much money we would need in the future in order to provide services at the 2010 level, to more people at ever-higher prices.
Figure 1 shows the result. Revenues are shown with the thick solid line. Federal stimulus aid is excluded, since it is not a permanent revenue source. Revenues are those actually received in 2009 and 2010, forecast for 2011-13, and projected at a 3.7% growth rate for 2014-19. That 3.7% growth rate simply continues the growth forecast for 2013.
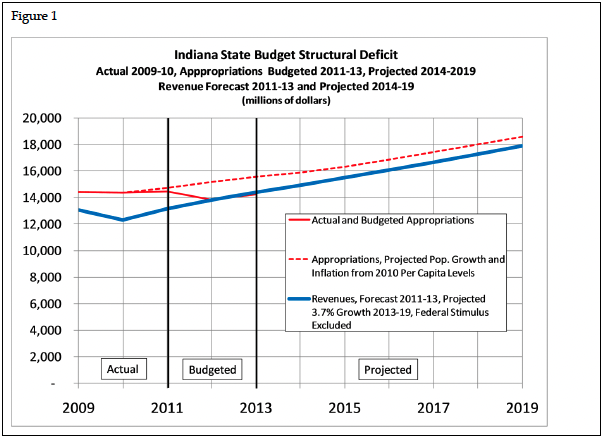
Figure 1. Indiana State Budget Structural Deficit, Actual 2009-2010, Appropriations Budgeted 2011-2013, Projected 2014-2019. Revenue Forecast 2011-13 and Projected 2014-2019.
Appropriations are shown with the thin solid line. These are actual appropriations for 2009 and 2010, and budgeted appropriations through 2013. After 2010, the dotted line shows the amount needed to provide state services at the 2010 level, with inflation and population growth.
Revenues never recover enough to support the 2010 service level. All the way out to 2019, revenues fall below the 2010 spending amount. This would represent a structural deficit.
Except, budgeted appropriations fall to match revenues as of 2012. So, unless revenues accelerate, or government service delivery becomes more efficient, Indiana’s state government will provide less in services in the future than it did in the past. Likewise, because the state funds virtually all K-12 education operating costs, we’ll see a reduction in school services too, unless school corporations learn to deliver more services for fewer dollars. The widespread budget difficulties experienced by our local school corporations can be interpreted as budget restructuring.
Does Indiana have a structural deficit? No. The governor and General Assembly, in the 2011 budget session, eliminated the structural deficit by cutting appropriations. The state budget was re-structured. Instead of a structural deficit we have a smaller state government.
| References
Indiana Legislative Services Agency, Fiscal Impact Statement, HB1001, May 1, 2011 [http://www.in.gov/legislative/bills/2011/PDF/FISCAL/HB1001.008.pdf]. |
| Indiana State Budget Agency, End-of-Month Revenue Report, May 31, 2011 [http://www.in.gov/sba/files/revreport_may2011.pdf]. |
| Indiana State Budget Agency, State Revenue Forecast, April 15, 2011 [http://www.in.gov/sba/files/rev_forecast_20110415_revenue_forecast.pdf].
For further information, see Larry DeBoer’s Indiana Local Government website, http://www.agecon.purdue.edu/crd/Localgov. |
![]()
![]()
![]()
![]()
![]()
