International Benchmarks for Corn Production
June 13, 2015
PAER-2015-7
Elizabeth Lunik, Graduate Assistant, and Michael Langemeier, Center for Commercial Agriculture
![]()
![]()
![]()
![]()
![]()
Examining the competitiveness of corn production in different regions of the world is often difficult due to lack of comparable data and agreement regarding what needs to be measured. To be useful, international data needs to be expressed in common production units and converted to a common currency. Also, production and cost measures need to be consistently defined across production regions or farms.
This paper examines the competitiveness of corn production for important international corn regions using 2008 to 2013 data from the Agribenchmark network. Agribenchmark is a global network led by the Johann Heinrich von Thunen Institute of Farm Economics (vTI) in Braunschweig, Germany. They collect data on beef, cash crops, dairy, pigs and poultry, horticulture, and organic products for 32 countries. The Agribenchmark concept of typical farms was developed to understand and compare current farm production systems around the world. Participant countries follow a standard procedure to create typical farms that are representative of national farm output shares, and categorized by production systems or combinations of enterprises and structural features. Purdue contributes data for Indiana farms.
The sample of farms used in this paper came from 35 corn farms representing 16 countries (Argentina, Brazil, Bulgaria, Canada, China, Czech Republic, France, Hungary, Italy, Poland, Russia, South Africa, Ukraine, United States, Uruguay, and Vietnam) with data from 2008 to 2013. The country and farm abbreviations used in this paper are listed in Table 1.
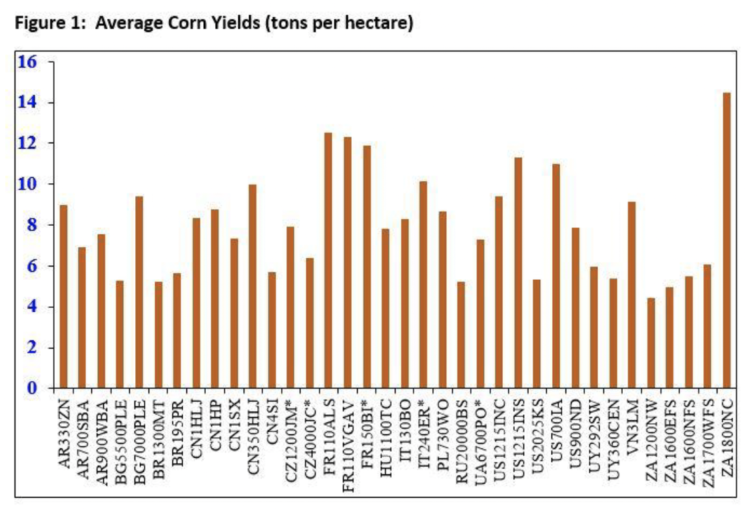
Figure 1. Average Corn Yields (tons per hectare)
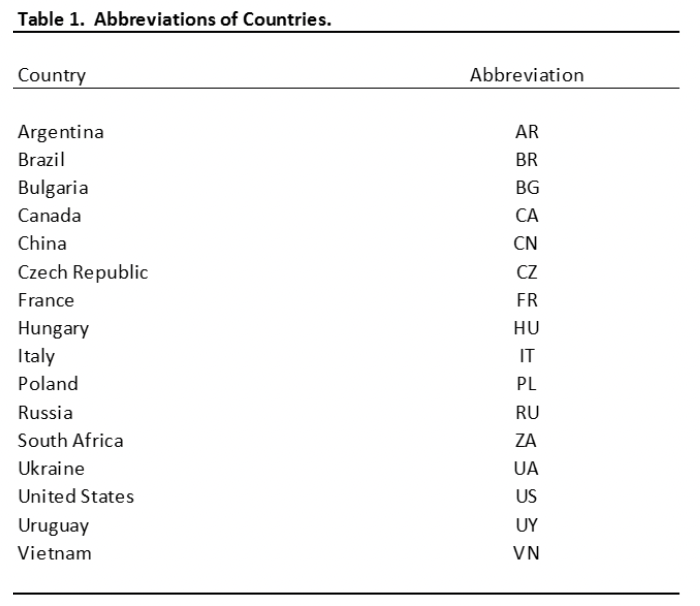
Table 1. Abbreviations of Countries.
While the farms produce a variety of crops, this paper only considers corn production. Typical farms used in the Agribenchmark network are defined using country initials, hectares (1 hectare = 2.47 acres) on the farm, and location in the country. For example, the US1215INC farm is a U.S. farm with 1215 hectares (3000 acres) located in central Indiana. The other U.S. farms are defined as follows: US1215INS is a farm with 1215 hectares (3000 acres) located in southern Indiana, US2025KS is a farm with 2025 hectares (5004 acres) in northwestern Kansas, US700IA is a farm with 700 hectares (1730 acres) located in Iowa, and US900ND is a farm with 900 hectares (2224 acres) located in eastern North Dakota.
Corn Yields
Although yield is only a partial gauge of whole-farm performance, it reflects the available production technology across farms. Average corn yield for the farms in 2013 was 7.98 tons per hectare (127 bushels per acre). Figure 1 illustrates the average corn yield per hectare for each farm for the years data were available (between 1 to 6 years). Corn yields ranged from approximately 5 to 15 tons per hectare (80 to 239 bushels per acre). Farms with the highest yields were located in France, United States, or South Africa. The average land used for corn varied significantly across the farms, from 0.16 hectares to 1,870 hectares (0.4 to 4,621 acres).
Input Cost Shares
The mix of input use across the farms varies substantially. This is due to differences in technology adoption, input prices, fertility levels, efficiency of the farm operators, trade policy restrictions, exchange rate effects, and labor and capital market constraints, Figure 2 presents the average input cost shares for each farm. Cost shares were broken down into seven categories: seed, fertilizers, crop protection, labor, land, fixed capital, and other direct services. Fixed capital included the ownership costs associated with machinery and buildings, custom charges, depreciation, repairs and maintenance, energy costs other than drying, irrigation costs, crop insurance, and financing costs on direct inputs such as seed, fertilizers, and crop protection.
The average input cost shares for corn, beginning with the largest shares are as follows: fixed capital (27.8%), fertilizers (19.9%), land (18.3%), seed (11.9%), labor (11.2%), crop protection (5.6%), and other direct services (5.3%).
There is a lot of variation in costs across these world farms. Labor wage rates averaged $18 per hour, but ranged from $0.64 per hour to $140 per hour. Land rental rates averaged $285 per hectare ($115 per acre), but ranged from $13.81 per hectare ($5.59 per acre) to $1,161 per hectare ($470 per acre). Long-term interest rates averaged 7.3%, and ranged from 3% to 21%. Such large differences across the world mean that much different production systems are used in various areas.
Efficiency Measures
Technical and cost efficiency are commonly used benchmark measures. This paper focuses on cost efficiency which measures whether individual farms are producing on the production frontier (producing as much output as possible given its technology and input usage) and using the optimal mix of inputs. A cost efficient firm is producing at the lowest cost for a specific level of output. An index of 1 indicates that a farm is cost efficient. Farms with indices less than 1 could improve cost efficiency by adjusting their production system and/or using a different input mix.
Table 2 presents cost efficiency indices for 13 world farms that had continuous corn data from 2008 to 2013. Cost efficiency indices ranged from 0.456 for one Brazilian farm to 1.000 for two farms from Argentina, a farm from Italy, a farm from the Ukraine, and one U.S. farm (Iowa farm). The farm from North Dakota (US900ND) had a cost efficiency index of 0.773. This farm has the potential to reduce cost by 22.7% (1.000 – 0.773) and still achieve the same level of output.
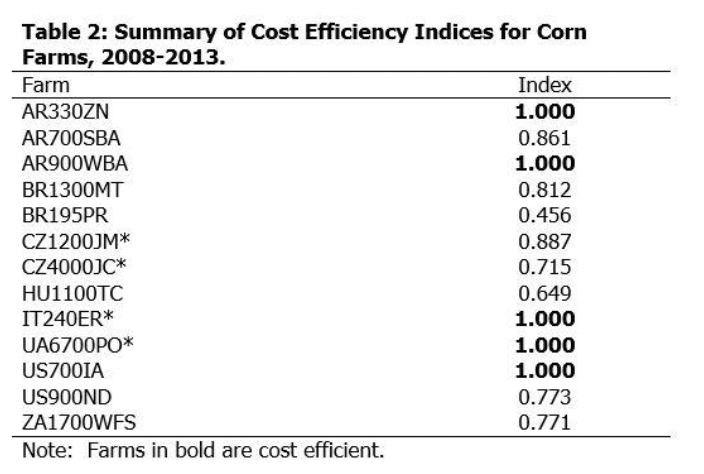
Table 2. Summary of Cost Efficiency Indices for Corn Farms, 2008-2013.
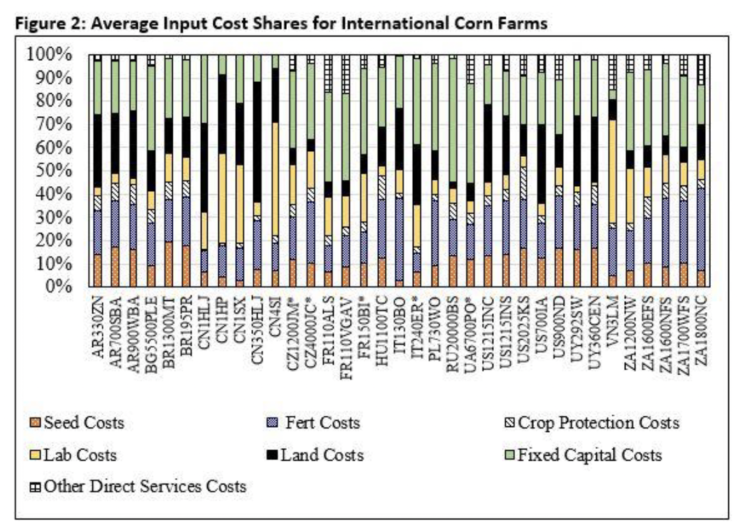
Figure 2. Average Input Cost Shares for International Corn Farms.
Conclusions
Purdue has been participating in a project to compare farms across the globe. This is not an easy task because of so many differences across borders and currencies and requires standardized procedures. Over time, we will be able to make more comparisons that can be beneficial to understanding how U.S. farms compare against competitors.
This paper examined the competitiveness of 35 corn farms in 16 countries using data from the Agribenchmark network. Corn yields and input cost shares varied substantially among the farms. If all of the farms were adopting the best available technology in their region and using the appropriate mix of inputs given local input prices, the cost efficiency index would be 1 for each farm. This, however, was not the case. Cost efficiency averaged 0.84. This means that on average, farms could potentially lower costs by 16% and still achieve the same level of output. This could be done with a better set of technology or a more optimum mix of inputs. Several farms had a cost efficiency index of 1 which means they were achieving their output at the lowest costs possible. These farms were from Argentina, Italy, Ukraine, and the United States.
In the future we hope to gain more insight into how Indiana farms can be among the most competitive in the world.
![]()
![]()
![]()
![]()
![]()
