Is Farmland Currently Priced as an Attractive Investment?
August 7, 2014
PAER-2014-10
Timothy G. Baker, Michael D. Boehlje & Michael R. Langemeier, Professors
![]()
![]()
![]()
![]()
![]()
Farmland prices in the Corn Belt and Great Plains states have increased dramatically during the last few years. For example, farmland prices in West Central Indiana have increased 92% since 2010. The recent dramatic increase in farmland prices has attracted interest from the broader investment community as a component of their investment portfolio, as illustrated by financial services company TIAA-CREF’s recent acquisition of the farmland portfolio of Westchester, a large farmland realtor and investment company with farm properties throughout the United States. Similar investment interest is reflected by numerous articles on farmland investing found on banking and financial websites.
Concern is being expressed by many investment analysts that farmland prices will become higher than justified by the fundamentals, and will result in what we will later recognize as a bubble. One justification for this concern is that previous research has established the tendency of the farmland market to over-shoot its fundamental value. Thus, from the standpoint of the literature and of history, another bubble in farmland prices would not be a surprise.
A standard measure of financial performance most commonly used for stock is the price to earnings ratio (P/E). A high P/E ratio sometimes indicates that investors think the investment has good growth opportunities, relatively safe earnings, a low capitalization rate, or a combination of these factors. However, a high P/E ratio may also indicate that an investment is less attractive because the price has already been bid up to reflect these positive attributes.
This paper determines the equivalent ratio of farmland price to cash rent ratio (P/rent) and compares the P/rent ratio for farmland to the P/E ratio of stocks included in the S&P 500. We use land value and cash rent data for the 1960 to 2014 period for West Central Indiana to illustrate the P/rent ratio. That data from 1975 to 2014 were obtained from the annual Purdue Land Value and Cash Rent Survey. For 1960 to 1974, the 1975 Purdue survey numbers were indexed backwards using the percentage change in USDA farmland value and cash rent data for the state of Indiana.
Price to Rent Ratio
The P/rent ratio for West Central Indiana has an average value of 18.2 over the 55 year period from 1960 to 2014, with a high of 33.0 reached in this year (2014) and a low of 11.1 in 1986, which was perhaps the bottom of the valley after the price bubble of the 1970s and very early 1980s (Figure 1). At the peak of this bubble, the P/rent ratio reached a high of just over 20 from 1977 through 1979. The P/rent ratio subsequently dropped to the teens in the early 1980s, and reached its low in 1986. The rise from around 15 in 1976 into the 20s and down to 11.1 in 1986 corresponds exactly to what is viewed as the bubble in farmland prices that was followed by one of the more difficult periods for agriculture in the early-to-mid 1980s. The current value of 33.0 relative to the historic average of 18.2 and previous high around 20 at least raises concerns that current farmland prices could be overvalued in relationship to returns.
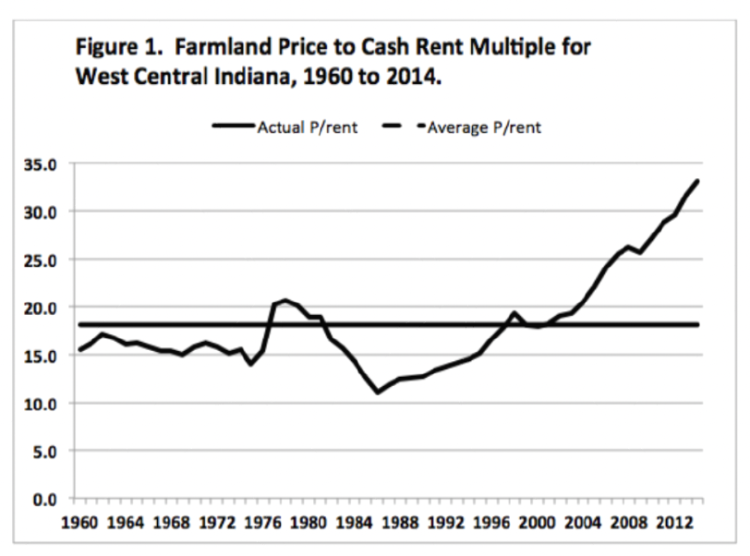
Figure 1. Farmland Price to Cash Rent Multiple for West Central Indiana, 1960 to 2014
Farmland Versus Stock
A comparison of the P/rent ratio to the P/E ratio used for stocks provides insight into the comparative attractiveness of farmland as an investment. Figure 2 shows the P/E ratio for the S&P 500 and the P/rent ratio for farmland. The average P/E ratio for the S&P 500 for the 1960 to 2014 period at 18.7 is relatively close to the 18.2 average for the P/rent ratio for farmland. The P/E ratio for stocks was generally higher than the P/rent ratio for farmland from 1986 to 2004. Since 2004, except for 2009 which exhibited a very high P/E ratio for stocks, the P/rent ratio for farmland has been higher than the stock P/E ratio. In addition, to being relatively high, the P/rent ratio has exhibited an upward trend in the last ten years. The current P/rent ratio of 33.0 is well above the average P/E multiple of 18.7. From an investor viewpoint, to receive $1,000 of earnings they would have to buy $33,000 of farmland compared to only $18,700 worth of stock to get the same earnings. This is at least a signal that farmland prices are very high compared to alternative investments in the stock market.
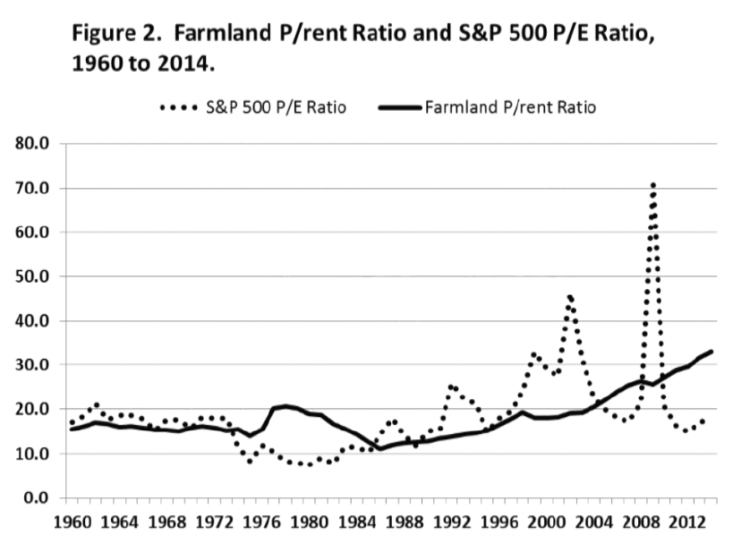
Figure 2. Farmland P/rent Ratio and S&P 500 P/E Ratio, 1960 to 2014
Cyclically Adjusted P/Rent
Shiller (2005; 2014) uses a 10-year moving average for earnings in the P/E ratio, often labeled either P/E10 or cyclically adjusted P/E (CAPE), to remove the effect of the economic cycle on the P/E ratio. When earnings collapse in recessions, stock prices often do not fall as much as earnings, and the P/E ratios based on the low current earnings sometimes become very large (e.g., in 2009). Similarly, in good economic times P/E ratios can fall and stocks look cheap, simply because the very high current earnings are not expected to last, so stock prices do not increase as much as earnings. By using a 10-year moving average of earnings in the denominator of the P/E ratio, Shiller has smoothed out the business cycle by deflating both earnings and prices to remove the effects of inflation. Shiller also uses the P/E10 to gain insight into future rates of return. That is, if an investor buys an asset when its P/E10 is high, do subsequent returns from that investment turn out to be low, and vice versa? Similar to Schiller we want to examine if there has been a similar relationship for farmland?
The P/rent ratios reported thus far are the current year’s farmland price divided by current year cash rent. Here we model our P/rent10 after Shiller’s cyclically adjusted P/E ratio. Cash rent and farmland prices are deflated, and then 10-year moving averages of real cash rent are calculated. The P/rent10 ratio is computed by dividing the real farmland price by the 10-year moving average real cash rent. A similar computation is done for 10-year owner-operator returns (P/OO-10).
Figure 3 shows all three of these ratios: P/rent10; P/OO-10, and Schiller’s P/E10. The P/OO-10 fell through the first half of the 1970s when real returns grew faster than land values, increased from around 20 in the mid 1970’s to 28.2 in 1977, and then fell to 6.8 in 1987. The P/OO-10 then increased steadily until it reached 37.0 in 2014. In the last three years, the P/rent10 ratio has risen substantially above the P/OO-10 ratio.
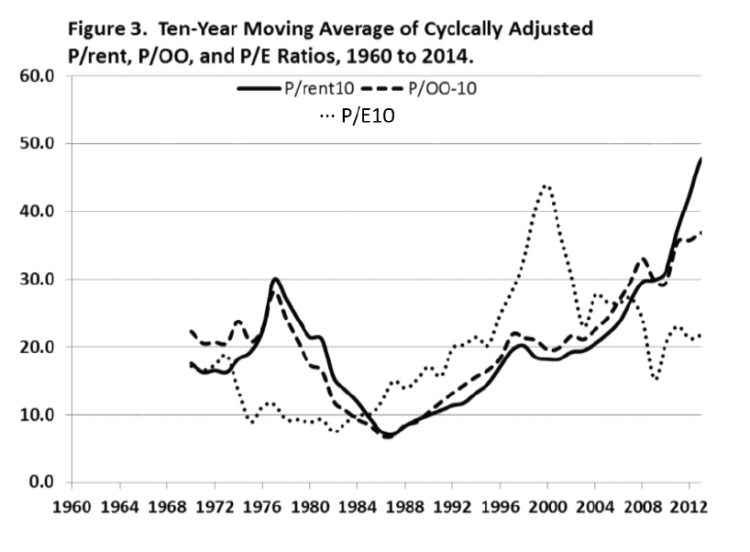
Figure 3. Ten Year Moving Average of Cyclically Adjusted P/rent, P/OO, and P/E Ratios, 1960 to 2014
Two important points are evident from Figure 3. First, the P/rent10 ratio in 2014 now exceeds the peak of the S&P 500 P/E10 ratio during the dot-com stock bubble in the late-1990s and early-2000s. Could this be suggesting that the current farmland market is also in an extreme bubble? Second, the relationship between the P/rent10 ratio and the P/OO-10 ratio suggests that producers are not bidding all of the increases in owner/operator returns into cash rents. Producers may be expecting owner/operator returns to decline, which would make it difficult to maintain high cash rents. However, this relationship could also be explained if one expects cash rents to adjust slowly to changes in operator returns. Historically, there have been times when cash rents were slow to adjust.
Buy a High Ratio: Get a Low Future Return?
Shiller also discusses the relationship between the P/E10 ratio and the annualized rate of return from holding S&P 500 stocks for long periods. In general, his results show that the higher the P/E10 ratio at the time of purchase, the lower the resulting multiple year returns, like for the next 10 or 20 years. The West Central Indiana farmland and cash rent data from 1960 to 2014 are used to compute 10 and 20 year annualized rates of return. Returns are the sum of the average of cash rent as a faction of the farmland price each year, plus the annualized price appreciation over the holding period.
The results for farmland show a negative relationship similar to that exhibited in Shiller’s stock data. The 10-year holding period returns for farmland show a strong negative relationship (Figure 4). That is, if one purchased farmland when the P/rent10 ratio was very high, like now, they tended to have a low 10-year rate of return. Alternatively, if one purchased farmland when the P/rent10 was intermediate or low, they tended to have moderate to high 10-year returns.
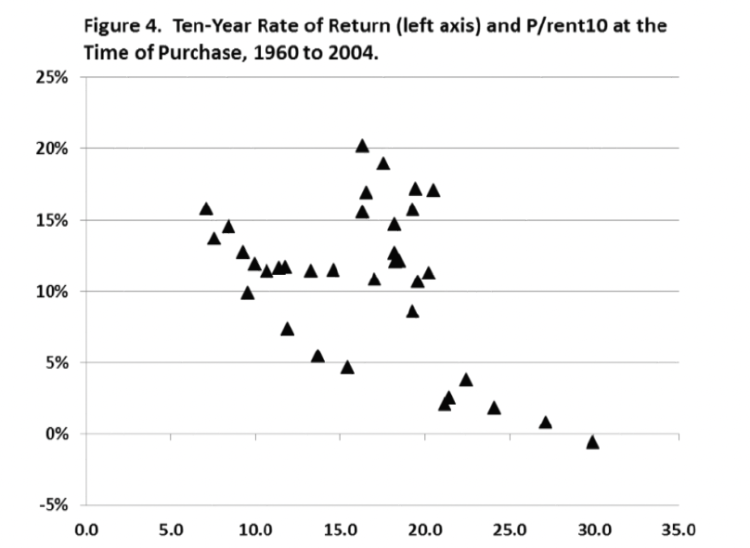
Figure 4. Ten Year Rate of Return (left axis) and P/rent10 at the Time of Purchase, 1960-2014
The 10-year returns ranged from a small negative to 20%. In a similar way, the 20-year holding period returns also exhibit a strong negative relationship with the P/rent10 ratio (Figure 5). The 20-year holding returns range from 6 to 14%.
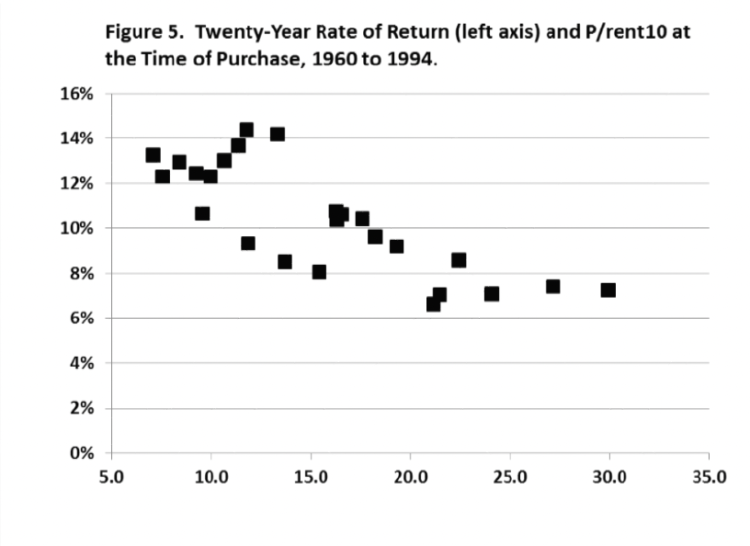
Figure 5. 20-Year Rate of Return (left axis) and P/rent10 at the Time of Purchase, 1960-2014
The highest historical P/rent10 in our data for which a 10-year holding period return can be calculated is 30 in 1977, resulting in a negative 10-year holding period return in our data. The P/rent10 levels in 2011 through 2014 have grown to values well above 35, which is literally off the chart (horizontal axis of Figure 4). In this recent period, cash rents have increased, but farmland prices have increased much more. Farmland prices in 2014 were at a historically high multiple of moving average cash rent, even higher than the level seen in the late 1970s prior to the agricultural crisis of the 1980s.
The high P/rent10 in 2011-2014 could be partially explained by market participants incorporating the current high rents into future expectations faster than they are incorporated into a 10-year moving average. Biofuel demand has been a step-up in demand that is not very likely to decline substantially. Similarly, increased export demand, mainly soybean demand by China, could be seen as likely to hold and even expand rather than decline. However, even if one considers the average of only the highest two years of cash rent, one still requires a combination of strong continued growth expectations and low cost of capital to justify current farmland prices and the current ratios.
Final Comments: Land Buyers Beware
Farmland prices are currently at unprecedented levels and our analysis indicates that the P/rent ratio (price per acre divided by cash rent per acre) is substantially higher than historical values, and that this ratio is also high relative to the comparable P/E ratio on stocks as measured by the S&P 500. In addition, in order to maintain the current high farmland values, cash rents would have to remain very high, or even move higher, and interest rates would also have to remain very low. Most agricultural economists expect crop returns to drop sharply and for interest rates to move upward in coming years.
“Most agricultural economists expect crop returns to drop sharply and for interest rates to move upward in coming years.”
Furthermore, we demonstrated that farmland values have tended to have a cyclical component in which farmland values move too high relative to the underlying fundamentals and then over time move too low relative to fundamentals. We use a cyclically adjusted P/rent ratio to show that a very high P/rent ratio, as we have now, tends to be associated with low subsequent returns. Simply stated this means that the historical relationships show that those who bought farmland when the P/rent ratio was high tended to have low subsequent returns. On the other hand, those who bought farmland when the P/rent ratio was intermediate or low, tended to have intermediate or high subsequent returns. The current record high P/rent ratio could be a warning to current farmland buyers that their odds of favorable returns on these purchases may be low.
Our reading from examining 55 years of history is that current farmland values are now extremely elevated in relationship to the underlying economic fundamentals. If we are correct, this means that those purchasing farmland at current prices have a high probability of experiencing “buyer’s remorse” in coming years.
“If we are correct, this means that those purchasing farmland at current prices have a high probability of experiencing “buyer’s remorse” in coming years.”
But having said this, there remain some possible situations in which farmland values could be maintained or even increase. These might include further unexpected growth in grain and soybean demands, perhaps with a greater ramping-up of biofuels programs, or with even greater expansion of exports to developing countries like China. Rising farmland values could also result from long-term factors that limit crop supplies such as global climate change or lack of irrigation water, both of which could reduce world crop productivity.
References
Dobbins, C.L. and K. Cook. 2014. “A Time of Change: Indiana’s Farmland Market in 2014.” Purdue Agricultural Economics Report, Purdue University, August 2014.
Shiller, R.J. 2005. Irrational Exuberance, Second Edition. New York: Crown Business.
Shiller, R.J. 2014. S&P 500 P/E Ratio. www.multpl.com, accessed July 18, 2014.
![]()
![]()
![]()
![]()
![]()